Validating Neuroplasticity Markers Across Species: Bridging the Translational Gap for Drug Development
This article provides a comprehensive roadmap for the validation of neuroplasticity markers across different species, a critical step in translating preclinical findings into effective human therapeutics.
Validating Neuroplasticity Markers Across Species: Bridging the Translational Gap for Drug Development
Abstract
This article provides a comprehensive roadmap for the validation of neuroplasticity markers across different species, a critical step in translating preclinical findings into effective human therapeutics. Aimed at researchers and drug development professionals, it explores the fundamental molecular mechanisms of neuroplasticity, evaluates advanced measurement techniques from animal models to human applications, addresses key challenges in cross-species comparison, and establishes robust validation frameworks. By synthesizing current research and emerging methodologies, this work aims to enhance the predictive validity of neuroplasticity biomarkers, ultimately accelerating the development of novel treatments for neurological and psychiatric disorders.
Core Mechanisms of Neuroplasticity: From Molecules to Neural Circuits
Neuroplasticity, a fundamental property of the nervous system, refers to the brain's remarkable capacity to adapt its structure and function in response to experience, environmental demands, and injury throughout the lifespan. This dynamic process encompasses a spectrum of mechanisms ranging from molecular and cellular changes to large-scale network reorganization [1] [2]. Once believed to be a static organ after critical developmental periods, the brain is now recognized as highly malleable, continuously refining its circuits through mechanisms including synaptic strengthening and weakening, axonal sprouting, cortical remapping, and in specific regions, the generation of new neurons (adult neurogenesis) [3] [4].
Understanding neuroplasticity is paramount for developing novel therapeutic interventions for neurological and psychiatric disorders. Research has established that impaired neuroplasticity constitutes a core pathophysiological mechanism in conditions such as depression, stroke, and Alzheimer's disease [1] [5]. Conversely, interventions that harness or enhance neuroplasticity—including rehabilitation, pharmacotherapy, and targeted cognitive training—hold promise for facilitating functional recovery. This review objectively compares key manifestations of neuroplasticity across different experimental contexts and species, providing a critical analysis of the supporting data and methodologies that underpin our current understanding.
Comparative Analysis of Neuroplasticity Manifestations
The following tables summarize quantitative findings and characteristics of neuroplasticity across various research domains, highlighting both the diversity and common principles of neural adaptation.
Table 1: Software Variability in Quantifying Hippocampal Volume – A Critical Comparison
| Software Application | Left Hippocampus Mean Difference (mm³) | Right Hippocampus Mean Difference (mm³) | Intraclass Correlation (ICC) | Key Finding |
|---|---|---|---|---|
| FreeSurfer (FS) | -209 | -232 | 0.88 (LH), 0.86 (RH) | Showed highest consistency vs. mean of all methods [6] |
| SPM-Neuromorphometrics | -820 | -745 | Data Not Provided | Moderate agreement [6] |
| SPM-Hammers | -1474 | -1547 | Data Not Provided | Low agreement [6] |
| Quantib | -680 | -723 | 0.36 (RH) | Low agreement, particularly for right hippocampus [6] |
| GIF | 891 | 982 | Data Not Provided | Moderate agreement [6] |
| STEPS | 2218 | 2188 | 0.42 (LH) | Lowest agreement vs. mean of all methods [6] |
Table 2: Occupational Neuroplasticity – Meta-Analysis Findings from Expert vs. Novice Studies
| Brain Metric | Brain Region | Expert vs. Novice Difference | Proposed Functional Correlation |
|---|---|---|---|
| Functional Activation | Left Precentral Gyrus (BA6) | Stronger activation in experts | Motor planning and execution [2] |
| Functional Activation | Left Middle Frontal Gyrus (BA6) | Stronger activation in experts | Cognitive control and motor learning [2] |
| Functional Activation | Right Inferior Frontal Gyrus (BA9) | Stronger activation in experts | Complex cognitive processing [2] |
| Gray Matter Volume | Bilateral Superior Temporal Gyrus (BA22) | Greater volume in experts | Auditory processing and integration [2] |
| Gray Matter Volume | Right Putamen | Greater volume in experts | Motor skill automatization and learning [2] |
Table 3: Interspecies Comparison of Key Neuroplasticity Features
| Feature | Rodents (e.g., Mice/Rats) | Non-Human Primates | Humans |
|---|---|---|---|
| Hippocampal Neurogenesis Rate | High and relatively stable in adulthood [4] | Sharply decreases after juvenile stage; 10x lower than rodents [4] | Persistent through life, but rate is debated; steep decline after childhood reported [4] |
| Neuronal Maturation Rate | Faster maturation rate [4] | Protracted maturation, longer functional window [4] | Slow maturation, similar to primates [4] |
| Subventricular Zone-Olfactory Bulb Neurogenesis | Robust, with a clear rostral migratory stream [3] [4] | Reduced compared to rodents [4] | Highly controversial; likely present in children but rare/absent in adults [4] |
| Cortical Immature Neurons (cINs) | Present, but drop rapidly with age [3] | Data Not Provided | More abundant and widespread in gyrencephalic species; maintained at advanced ages [3] |
Key Experimental Protocols in Neuroplasticity Research
Volumetric MRI Analysis for Hippocampal Atrophy
Objective: To quantify the agreement and variability across different automated software applications for measuring hippocampal volume, a key biomarker in conditions like Alzheimer's disease [6].
Methodology:
- Population: A clinically relevant sample is selected, typically including both patients with confirmed hippocampal atrophy (e.g., Alzheimer's dementia) and age-/gender-matched healthy controls [6].
- MRI Acquisition: High-resolution isovoxel T1-weighted magnetization-prepared rapid gradient-echo (MPRAGE) sequences are acquired using a 3 Tesla MRI scanner to ensure consistent image quality [6].
- Software Processing: The same MRI datasets are processed through multiple, well-established volumetric software packages. In a seminal study, these included FreeSurfer (FS), Statistical Parametric Mapping (SPM) using two different atlases (Neuromorphometrics and Hammers), Geodesic Information Flows (GIF), Similarity-and-Truth-Estimation-for-Propagated-Segmentations (STEPS), and the commercial platform Quantib [6].
- Statistical Analysis: Agreement is assessed by:
- Comparing categorization of volumes into quartiles.
- Calculating Intraclass Correlation Coefficients (ICCs) between each method and the mean of all methods.
- Employing Bland-Altman statistics to visualize the amount of disagreement across the data spread [6].
Key Data Output: Hippocampal volume in mm³ for each subject from each software, allowing for direct comparison of absolute values and inter-method reliability [6].
EEG as a Biomarker for Rehabilitation-Induced Neuroplasticity
Objective: To identify neuroplasticity changes via electroencephalogram (EEG) signals and associate them with functional improvements during post-stroke gait rehabilitation, comparing different therapy frequencies [7].
Methodology:
- Study Design: A randomized, single-blinded, controlled trial among subacute stroke individuals.
- Intervention: Participants are randomized into an Intervention Group (IG) receiving high-frequency gait training (3 times/week) and a Control Group (CG) receiving low-frequency training (once/week) for 12 weeks. Training includes strengthening, balance, and gait exercises [7].
- Outcome Measures:
- Functional Measures: Assessed at pre- (R0) and post-intervention (R1), including the 6-Minute Walk Test (6MWT), Motor Assessment Scale (MAS), Berg Balance Scale (BBS), and Modified Barthel Index (MBI) [7].
- EEG Measures: Resting-state EEG is recorded at R0 and R1 using a 32-electrode cap. Key quantitative indices are derived:
- Delta to Alpha Ratio (DAR)
- Delta+Theta to Alpha+Beta Ratio (DTABR) [7].
- Statistical Analysis: Changes in functional and EEG measures are calculated. The core analysis investigates the association between the change in EEG indices (DAR, DTABR) and the change in functional scores, with the hypothesis that correlations will be stronger in the high-frequency IG [7].
Key Data Output: Correlation coefficients demonstrating the relationship between neurophysiological changes (EEG indices) and functional recovery, providing an objective measure of a dose-response relationship in neuroplasticity [7].
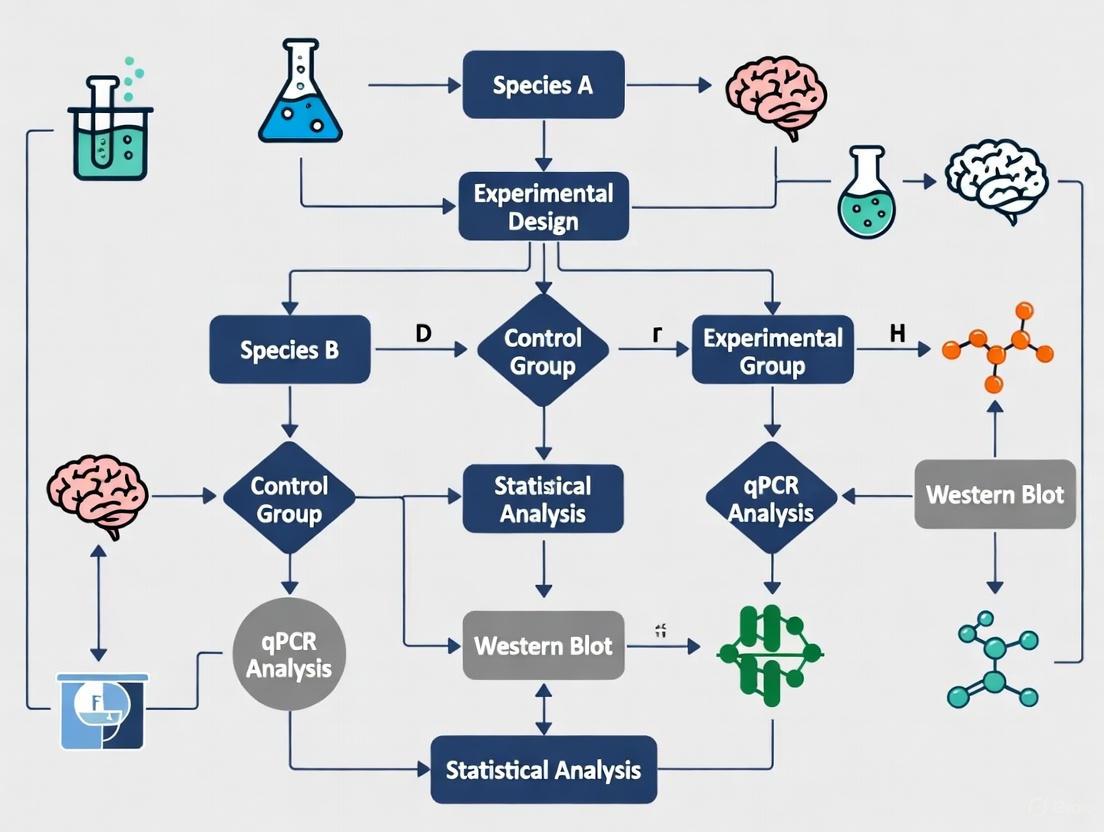
Signaling Pathways and Neuroplasticity Workflows
The following diagrams illustrate key molecular pathways and experimental designs relevant to neuroplasticity research.
The Scientist's Toolkit: Research Reagent Solutions
Table 4: Essential Reagents and Tools for Neuroplasticity Research
| Research Tool / Reagent | Primary Function in Neuroplasticity Research | Example Application |
|---|---|---|
| BrdU (Bromodeoxyuridine) | Thymidine analog that incorporates into DNA during synthesis; labels dividing cells for birth-dating and tracking new neuron survival and integration [4]. | Validating adult neurogenesis in post-mortem human hippocampal tissue [4]. |
| DCX (Doublecortin) Antibody | Immunohistochemical marker for immature and migrating neurons; used to identify and quantify neuroblasts and young neurons [3] [4]. | Detecting newly generated neurons in the dentate gyrus; caution required as it may also label non-newly born "dormant" neurons in some contexts [3]. |
| PSA-NCAM Antibody | Marker for polysialylated neural cell adhesion molecule, expressed on immature neurons with high synaptic plasticity; indicates structural remodeling [4]. | Studying neuronal maturation and synaptic reorganization in the post-stroke brain [4]. |
| BDNF ELISA Kits | Quantify levels of Brain-Derived Neurotrophic Factor (BDNF), a key protein supporting neuronal survival, differentiation, and synaptic plasticity [1]. | Measuring BDNF changes in serum or post-mortem brain tissue in depression models and after antidepressant treatments like ketamine [1]. |
| qEEG Analysis Software | Computes quantitative indices from electroencephalogram (EEG) data, such as Delta/Alpha Ratio (DAR), to serve as non-invasive biomarkers of brain state and plasticity [7]. | Objectively monitoring neuroplasticity changes in response to rehabilitation frequency in stroke patients [7]. |
| Volumetric MRI Software (e.g., FreeSurfer) | Automated segmentation and quantification of brain structure volumes (e.g., hippocampus) from MRI scans to assess atrophy or growth [6]. | Tracking disease progression in Alzheimer's or measuring experience-dependent structural changes in experts like taxi drivers [6] [2]. |
The comparative data presented herein underscores that neuroplasticity is not a single, universally conserved process but a multifaceted tool used differently across species, brain regions, and experimental contexts. The stark differences in hippocampal volumetry between software platforms highlight a critical methodological challenge: the lack of a gold standard can impede the translation of research findings into clinical practice [6]. Similarly, the interspecies variations in neurogenesis rates and persistence demand careful consideration when extrapolating mechanistic insights from rodent models to human patients [3] [4].
Promisingly, convergent evidence from molecular, structural, and functional studies is weaving a coherent narrative. The rapid synaptogenesis induced by ketamine in rodent models provides a plausible biological substrate for its clinical effects, bridging molecular plasticity with system-level recovery [1]. Furthermore, the application of accessible technologies like qEEG to objectively measure neuroplasticity in response to rehabilitation dose offers a path toward more personalized and effective therapeutic regimens [7]. Future research must continue to leverage multi-modal approaches and cross-species comparative studies to validate robust biomarkers of neuroplasticity, ultimately accelerating the development of interventions that effectively harness the brain's innate capacity for change.
This guide provides a comparative analysis of three central molecular systems governing neuroplasticity: Brain-Derived Neurotrophic Factor (BDNF), Polysialylated Neural Cell Adhesion Molecule (PSA-NCAM), and Glutamate Receptors. The dynamic interplay between these molecules regulates synaptic strength, structural remodeling, and cognitive functions. Understanding their coordinated actions is crucial for validating neuroplasticity markers across species and developing targeted therapeutic interventions for neurological and psychiatric disorders. The following sections synthesize experimental data, methodologies, and key research tools to objectively compare their functions, interactions, and translational relevance.
Molecular and Functional Profiles
The table below summarizes the core characteristics, primary functions, and experimental readouts for BDNF, PSA-NCAM, and glutamate receptors.
Table 1: Comparative Molecular Profiles of Key Neuroplasticity Players
| Molecular Player | Primary Isoforms/Subtypes | Core Function in Neuroplasticity | Key Experimental Readouts |
|---|---|---|---|
| BDNF | proBDNF, mature BDNF [8] | Enhances excitatory synaptic transmission; promotes dendritic growth & spine formation [8] [9] | Increased mEPSC frequency/amplitude [10]; CREB phosphorylation [9] |
| PSA-NCAM | NCAM-120, NCAM-140, NCAM-180 (all can be polysialylated) [11] | Reduces cell adhesion, facilitates structural plasticity & synaptic remodeling [11] [12] | Expression levels (Western blot); LTP/LTD impairment after enzymatic removal [11] |
| Glutamate Receptors | NMDA, AMPA, Kainate [11] [13] | Mediate fast excitatory transmission; NMDA-R crucial for synaptic calcium signaling & LTP [11] [9] | Receptor phosphorylation [9]; single-channel open probability [9]; synaptic current kinetics [10] |
Quantitative Comparison of Plasticity Effects
Direct experimental data from model systems highlight the quantifiable impact of each molecule on synaptic form and function.
Table 2: Experimental Data on Synaptic and Structural Effects
| Parameter Measured | Experimental System | BDNF Effect | PSA-NCAM Effect | Glutamate Receptor (NMDA) Effect |
|---|---|---|---|---|
| Excitatory Synaptic Current Frequency | Cultured hippocampal neurons (rodent) | Increased from ~0.9 Hz to ~2.2 Hz after long-term BDNF [10] | Modulates signaling; indirect effect on network activity [11] | Not Applicable (Directly mediates currents) |
| Excitatory Synaptic Current Amplitude | Cultured hippocampal neurons (rodent) | Increased from ~74 pA to ~146 pA after long-term BDNF [10] | PSA potentiates AMPA receptor currents [11] | Not Applicable (Directly mediates currents) |
| Impact on LTP/LTD | CA3-CA1 synapses (rodent) | Facilitates LTP induction [8] [14] | Ablation of polysialyltransferases impairs LTP and LTD [11] | Directly required for LTP induction |
| Dendritic Growth/Complexity | Cortical neurons (rodent) | Promotes dendritic arbor development [9] | Promotes axonal branching & outgrowth during development [11] [12] | NMDA-R activation is essential for BDNF-induced growth [9] |
Experimental Protocols for Key Assays
Protocol: Assessing BDNF's Impact on Synaptic Transmission
This electrophysiology protocol is used to quantify BDNF-induced changes in synaptic strength [10].
- Primary Neuron Culture: Prepare dissociated hippocampal cultures from postnatal day 1-2 rodents.
- Treatment: Apply mature BDNF (e.g., 20 nM) to the culture medium for a defined period (24 hours to 4 days for chronic effects). Include control cultures without BDNF.
- Electrophysiological Recording: Use whole-cell patch-clamp recordings at a holding potential of -70 mV. Record spontaneous postsynaptic currents (PSCs).
- Pharmacological Isolation: To isolate specific currents:
- Data Analysis: Analyze recorded traces for frequency (number of events per second) and amplitude (peak current in pA) of PSCs. Compare BDNF-treated and control groups.
Protocol: Localizing Endogenous BDNF at Synapses
This super-resolution microscopy protocol determines the precise synaptic localization of BDNF [14].
- Sample Preparation: Use long-term cultured hippocampal neurons (>21 days in vitro) to ensure mature synapses.
- Fixation and Immunostaining: Fix neurons and perform immunofluorescence using rigorously validated anti-BDNF antibodies. Co-stain for pre- and postsynaptic markers (e.g., Bassoon for presynapse, Homer for postsynapse).
- Super-Resolution Imaging: Perform direct Stochastic Optical Reconstruction Microscopy (dSTORM). Acquire two-color dSTORM images with a spatial resolution of ~20 nm.
- Image Analysis: Quantify the localization of BDNF immuno-signals relative to the synaptic scaffold proteins. BDNF signals appear as ~60 nm granules, with the vast majority found within the presynaptic compartment [14].
Signaling Pathways and Molecular Interactions
The following diagrams illustrate the core interactions and experimental workflows involving BDNF, PSA-NCAM, and glutamate receptors.
Cooperative BDNF-Glutamate Signaling in Dendritic Development
PSA-NCAM Modulation of Synaptic Signaling
Workflow: Integrated Neuroplasticity Marker Validation
The Scientist's Toolkit: Essential Research Reagents
This table catalogs critical reagents for investigating these neuroplasticity markers, with applications spanning molecular, cellular, and functional analyses.
Table 3: Key Research Reagent Solutions for Neuroplasticity Research
| Reagent / Tool | Function / Application | Example Use-Case |
|---|---|---|
| Recombinant Mature BDNF | Activate TrkB signaling; acute or chronic treatment of neuronal cultures [10] | Studying enhancement of excitatory synaptic transmission (mEPSCs) [10] |
| Endoneuraminidase (EndoN) | Enzymatically digest polysialic acid (PSA) from NCAM [11] | Probing functional role of PSA-NCAM in LTP, learning, and memory [11] |
| Phospho-Specific Antibodies | Detect phosphorylation of CREB, NR1, NR2B subunits [9] | Mapping activation of BDNF and glutamate receptor signaling pathways [9] |
| Validated Anti-BDNF Antibodies | Detect endogenous BDNF for imaging (e.g., dSTORM) and Western blot [14] | Precise sub-synaptic localization of native BDNF protein [14] |
| GAP-43 Antibodies / Assays | Monitor neuronal growth and plasticity; readout of BDNF/AMPA-R signaling [13] | Assessing neurotrophic effects and neuronal remodeling [13] |
| Positive AMPA Receptor Modulators | Allosterically potentiate AMPA receptor function [13] | Elevating endogenous BDNF & GAP-43 levels as a neuroprotective strategy [13] |
| Lentiviral Vectors (e.g., Cre, shRNA) | Genetic manipulation (knockdown, overexpression) in primary neurons [14] | Cell-type specific or conditional gene manipulation (e.g., BDNF deletion) [14] |
Cross-Species Validation and Biomarker Potential
Translating findings from model systems to humans requires cross-species validation. Serum biomarkers like GDF-10 and uPAR, which are involved in axonal sprouting and tissue remodeling, show promise for monitoring recovery in stroke patients undergoing rehabilitation [5]. The BRAIN Initiative emphasizes integrating molecular, structural, and functional data across species to establish robust, clinically relevant markers of brain health and disease [15]. The cooperative mechanisms between BDNF, PSA-NCAM, and glutamate receptors are evolutionarily conserved, making them central targets for this validation pipeline and for the development of novel therapeutics for neuropsychiatric and neurodegenerative disorders.
Synaptic plasticity, the ability of synapses to strengthen or weaken over time in response to increases or decreases in their activity, is fundamental to brain function. Long-term potentiation (LTP) and long-term depression (LTD) represent two primary forms of sustained synaptic plasticity that work in concert to refine neural circuits, enabling learning, memory, and cognitive flexibility [16]. These processes operate as complementary forces—the yin and yang of synaptic plasticity—maintaining homeostasis while allowing experience-dependent adaptation. Beyond their physiological roles, understanding the precise molecular mechanisms of LTP and LTD has become crucial for validating neuroplasticity markers across species, particularly in preclinical drug development for neurological and psychiatric disorders. This guide provides a comprehensive comparison of LTP and LTD mechanisms, their molecular correlates, and the experimental approaches used to study them across different model systems.
Core Mechanisms: A Comparative Analysis of LTP and LTD
Induction and Expression Mechanisms
The induction of LTP and LTD hinges on specific patterns of neural activity and subsequent calcium signaling that determine the direction of synaptic change. N-methyl-D-aspartate receptors (NMDARs) serve as the critical coincidence detectors in both processes, with their voltage-dependent magnesium block providing the molecular basis for Hebbian plasticity [17] [18].
Table 1: Comparative Induction Mechanisms of LTP and LTD
| Feature | Long-Term Potentiation (LTP) | Long-Term Depression (LTD) |
|---|---|---|
| Stimulation Pattern | High-frequency stimulation (e.g., 100 Hz) | Low-frequency stimulation (e.g., 1 Hz for 10-15 min) [16] |
| NMDA Receptor Activation | Strong depolarization removes Mg²⁺ block, allowing substantial Ca²⁺ influx [17] | Partial depolarization permits moderate Ca²⁺ influx through NMDA receptors [16] |
| Calcium Dynamics | Large, rapid increase in postsynaptic Ca²⁺ | Modest, sustained increase in postsynaptic Ca²⁺ [16] |
| Downstream Signaling | Activation of calcium/calmodulin-dependent protein kinase II (CaMKII), protein kinases [19] | Activation of protein phosphatases (PP1, PP2A, calcineurin) [16] |
| AMPAR Trafficking | Synaptic insertion of GluA1/GluA2-containing AMPARs [19] | Internalization of GluA2-containing AMPARs from postsynaptic membrane [19] |
Table 2: Expression Profiles of LTP and LTD
| Characteristic | LTP | LTD |
|---|---|---|
| Presynaptic Changes | Increased neurotransmitter release probability; redistribution of synaptophysin [20] | Minimal change in release probability [20] |
| Postsynaptic Changes | Increased AMPAR number and conductance; spine enlargement [16] | Decreased AMPAR number and conductance; spine shrinkage [16] |
| Structural Plasticity | Increased spine head size; stabilization of synapses [16] | Reduced spine size; potential synapse elimination [16] |
| Temporal Duration | Hours to lifetime of organism [16] | Hours to days [16] |
| Computational Role | Information storage; memory formation [16] [19] | Circuit refinement; memory updating; homeostasis [16] |
Molecular Correlates and Signaling Pathways
The distinct calcium dynamics triggered by LTP and LTD induction protocols activate different enzymatic cascades that ultimately determine the direction of synaptic change. LTP-inducing stimuli generate a large, rapid calcium rise that preferentially activates calcium/calmodulin-dependent protein kinase II (CaMKII) and protein kinase C (PKC), leading to phosphorylation of existing AMPARs and promotion of synaptic delivery of new receptors [19]. In contrast, the modest calcium elevation during LTD induction activates calcium-sensitive phosphatases such as calcineurin, which dephosphorylate AMPARs and facilitate their clathrin-mediated endocytosis [16] [19].
The following diagram illustrates the key molecular pathways involved in LTP and LTD:
Molecular Signaling in LTP and LTD
Experimental Methodologies Across Species
Electrophysiological Approaches
Electrophysiological recording techniques remain the gold standard for investigating synaptic plasticity across species. These approaches enable precise quantification of changes in synaptic strength following specific induction protocols.
Table 3: Electrophysiological Protocols for Inducing Plasticity
| Method | Protocol Details | Typical Preparation | Measured Output |
|---|---|---|---|
| High-Frequency Stimulation (LTP) | 100 Hz, 1 sec tetanus; or theta-burst stimulation (5 bursts of 4 pulses at 100 Hz, separated by 200 ms) [16] | Rodent hippocampal slices; anesthetized or freely moving rodents | Sustained increase in field excitatory postsynaptic potential (fEPSP) slope or population spike amplitude |
| Low-Frequency Stimulation (LTD) | 1 Hz stimulation for 10-15 minutes [16] | Rodent hippocampal or cortical slices; anesthetized rodents | Sustained decrease in fEPSP slope or amplitude |
| Spike-timing-dependent plasticity (STDP) | Repeated presynaptic activation followed by postsynaptic spiking within precise time windows (typically ±20 ms) | Cortical or hippocampal cultures or slices | Timing-dependent LTP or LTD |
| Chemically-induced LTP/LTD | Application of NMDA or DHPG (mGluR agonist) to induce chemical LTD [20] | Acute brain slices | Receptor-specific plasticity without electrical stimulation |
Translational Approaches in Humans
Non-invasive electroencephalography (EEG) recordings of visually evoked potentials (VEPs) have emerged as promising translational biomarkers for assessing LTP-like plasticity in humans. Different modulation protocols induce plasticity with distinct temporal profiles, enabling researchers to select paradigms based on experimental objectives [21].
Table 4: VEP-Based Plasticity Protocols in Humans
| Modulation Protocol | Stimulation Parameters | Plasticity Time Course | Best Suited For |
|---|---|---|---|
| Low-Frequency Stimulation | 10 min at 2 reversals per second (rps) [21] | Transient changes peaking at 2 min, dissipating within 12 min [21] | Brief plasticity assessments; drug screening |
| Repeated Low-Frequency | Three 10 min blocks at 2 rps [21] | Sustained changes persisting up to 22 min [21] | Longer-lasting plasticity evaluation |
| High-Frequency Stimulation | 9 Hz tetanic modulation [21] | Sharp but brief increases in plasticity [21] | Acute potentiation studies |
| Theta-Pulse Stimulation | Theta-frequency pattern stimulation [21] | Moderate but prolonged changes lasting up to 28 min [21] | Stable, sustained plasticity measures |
The following diagram illustrates a typical experimental workflow for VEP-based plasticity assessment in humans:
VEP Plasticity Assessment Workflow
Neuroplasticity Markers in Health and Disease
Molecular Markers of Synaptic Plasticity
Specific proteins serve as key markers for tracking synaptic plasticity changes in both experimental models and human studies. These markers can be categorized into presynaptic, postsynaptic, and glial components, each providing different insights into plasticity mechanisms.
Table 5: Key Molecular Markers of Synaptic Plasticity
| Marker Category | Specific Markers | Association with Plasticity | Detection Methods |
|---|---|---|---|
| Presynaptic Markers | Synaptophysin (decreased after LTP) [20] | Vesicle recycling and neurotransmitter release | Immunogold EM, immunohistochemistry, Western blot |
| Postsynaptic Receptors | Phospho-GluA1 (Ser831), GluA2 internalization [19] | AMPAR trafficking during LTP/LTD | Phospho-specific antibodies, surface biotinylation |
| Scaffolding Proteins | PSD-95, Homer, Shank | Postsynaptic density organization | Immunohistochemistry, proteomics |
| Calcium Signaling | CaMKII, calcineurin | Plasticity direction determination | Activity assays, phospho-proteomics |
| Structural Markers | Dendritic spine morphology (head size, neck length) | Structural correlates of functional changes | Two-photon imaging, electron microscopy |
Dysregulated Plasticity in Disease States
Alterations in LTP and LTD mechanisms underlie various neurological and psychiatric disorders, providing valuable targets for therapeutic intervention. Recent research has identified specific plasticity deficits across different conditions.
In Alzheimer's disease (AD), amyloid-β (Aβ) oligomers drive excessive internalization of GluA2-containing AMPARs, leading to synaptic depression and cognitive impairment [19]. Transgenic mouse models expressing familial AD mutations show normal engram formation but failed memory retrieval, with optogenetic reactivation of engram neurons rescuing memory deficits—indicating that storage remains intact while access is impaired [19]. Similarly, major depressive disorder, bipolar disorder, and schizophrenia demonstrate impaired VEP-related plasticity, while antidepressant interventions including selective serotonin reuptake inhibitors and ketamine enhance plasticity measures in these paradigms [21].
The diagram below illustrates how AMPAR trafficking disruptions contribute to synaptic deficits in Alzheimer's disease models:
AMPAR Trafficking in Alzheimer's Models
The Scientist's Toolkit: Essential Research Reagents
Table 6: Key Research Reagents for Synaptic Plasticity Studies
| Reagent/Category | Specific Examples | Research Application | Key Findings Enabled |
|---|---|---|---|
| Transgenic Mouse Models | Drd1a-TdTomato/Drd2-EGFP mice [22]; APP/PS1 mice [19] | Cell-type-specific plasticity; disease modeling | Revealed opposing roles of D1/D2 neurons in reward; identified Aβ-induced AMPAR trafficking defects |
| Viral Vectors | AAV-RAM-d2TTA::TRE-EGFP (engram labeling) [19] | Targeted neuronal population labeling | Enabled identification and manipulation of engram ensembles |
| Activity Reporters | c-Fos, SomaGCaMP7 [19] | Neural activity mapping | Identified reward-responsive neuronal populations |
| Receptor Antagonists | NMDA receptor antagonists (AP5, MK-801) | Pathway blockade | Established NMDAR necessity for LTP induction and memory |
| Kinase/Phosphatase Modulators | CaMKII inhibitors; phosphatase inhibitors | Signaling pathway manipulation | Determined necessity of specific enzymes for plasticity |
| AMPAR Trafficking Tools | GluA2 cytoplasmic tail peptides [19] | Interference with specific AMPAR interactions | Demonstrated role of GluA2 endocytosis in LTD and memory silencing |
Cross-Species Validation of Neuroplasticity Markers
The translation of synaptic plasticity findings across species requires careful validation of conserved mechanisms and markers. Several key approaches have emerged to bridge this translational gap:
Electrophysiological Correlates: The preservation of NMDAR-dependent LTP and LTD mechanisms from rodents to humans provides a fundamental basis for cross-species comparison. While induction protocols may vary, the core molecular machinery involving NMDAR activation, calcium signaling, and AMPAR trafficking remains largely conserved [16] [21].
Imaging Biomarkers: VEP-based plasticity measures in humans share key properties with cellular LTP, including NMDAR dependency, input specificity, and persistence [21]. These non-invasive paradigms enable direct comparison with slice electrophysiology and in vivo animal studies, facilitating biomarker validation for drug development.
Molecular Conservation: Key molecular markers such as phospho-GluA1, synaptophysin, and PSD-95 show conserved roles in synaptic plasticity across species [19] [20]. This molecular conservation enables the use of these markers as translational endpoints in preclinical to clinical research.
Behavioral Correlates: Plasticity measures across species correlate with cognitive functions, particularly memory performance [21] [23]. The inverted U-shape association between second language engagement and hippocampal gray matter volume in bilingual young adults demonstrates experience-dependent structural plasticity that mirrors functional plasticity observed in animal models [23].
The consistent findings across molecular, physiological, and behavioral levels provide a robust framework for validating neuroplasticity markers in cross-species research, particularly for developing therapies targeting cognitive dysfunction in neuropsychiatric disorders.
The brain's remarkable capacity to adapt, often termed neuroplasticity, relies heavily on the structural remodeling of neurons, particularly the formation and reorganization of synapses. This review focuses on two core components of this process: dendritic remodeling, the physical reshaping of a neuron's dendritic arbor, and synaptogenesis, the formation of new synapses. Within the context of modern neuroscience research, a critical challenge is the translation of findings from model organisms to humans. This guide objectively compares key experimental models and their outcomes, framing the data within the broader thesis of validating neuroplasticity markers across species. Understanding the strengths and limitations of each model is essential for researchers and drug development professionals aiming to bridge this translational gap.
Table 1: Quantitative Comparisons of Structural Plasticity Findings Across Models
| Experimental Model | Key Structural Finding | Quantitative Change | Technique Used | Citation |
|---|---|---|---|---|
| Rat Hippocampus (LTP) | Increase in small dendritic spines | >3x increase in density of small spines (PSD <0.05 µm²) | 3DEM | [24] |
| Remodeling of shaft Smooth Endoplasmic Reticulum (SER) | Significant decrease in shaft SER volume | 3DEM | [24] | |
| Mouse Orbitofrontal Cortex (Memory Trace) | Spine maturation on Memory Trace (MT) neurons | Higher proportion of mature spine types vs. non-MT neurons | In vivo imaging, chemogenetics | [25] |
| Drosophila LNv Neurons (Sensory Experience) | Dendritic filopodia dynamics | Significant reduction in dynamic branches from 48-72 h AEL to 96-120 h AEL | Time-lapse 3D imaging | [26] |
| Human Audiovisual Association | Cortical thickness & functional connectivity | Increased functional connectivity & cortical thickness in trained right hemisphere | fMRI, cortical thickness analysis | [27] |
Core Mechanisms: Signaling Pathways in Structural Plasticity
Structural plasticity is governed by complex, activity-dependent signaling pathways that converge on the neuronal cytoskeleton. A primary trigger is calcium influx through the NMDA receptor (NMDAR), which activates enzymes like Calcium/Calmodulin-dependent protein kinase II (CaMKII) [28] [29]. This kinase is a central node, implicated in both strengthening synaptic efficacy and stabilizing dendritic arbors. Downstream, the Rho family of GTPases (e.g., Rho, Rac, Cdc42) acts as a master regulator of the actin cytoskeleton, directly controlling the motility of dendritic filopodia, the growth of spines, and their morphological maturation [29] [30].
Recent research has elucidated a local, Golgi apparatus-independent secretory pathway within dendrites that is crucial for supplying membrane and proteins like glutamate receptors during plasticity. As detailed in [24], this pathway involves the smooth endoplasmic reticulum (SER) and recycling endosomes (REs). During Long-Term Potentiation (LTP), the SER provides local membrane resources, and REs are elevated in small spines, facilitating the insertion of AMPA receptors and spine growth [24] [28].
The following diagram illustrates the core signaling pathways and key cellular organelles involved in activity-dependent structural plasticity.
Experimental Models and Methodologies: A Detailed Comparison
A diverse array of experimental models is employed to study structural plasticity, each offering unique advantages and constraints. The choice of model is critical, as it directly influences the translatability of the findings.
Table 2: Comparison of Key Experimental Protocols in Structural Plasticity Research
| Model / Paradigm | Induction Method | Key Measured Output | Temporal Resolution | Advantages | Limitations |
|---|---|---|---|---|---|
| Rodent Hippocampal LTP (in vitro) | Theta-burst stimulation (TBS) of afferent pathways [24] | Spine density & morphology; SER/endosome volume via 3DEM [24] | Hours post-induction (e.g., 2 hrs) [24] | High cellular resolution; controlled environment | Limited behavioral correlation; acute slice preparation |
| Mouse Motor Skill Learning (in vivo) | Single-pellet reaching task or rotarod training [28] | Spine formation/elimination rate on L5 pyramidal neurons [28] | Days to weeks [28] | Direct link to learning and behavior | Technically challenging; complex data analysis |
| Drosophila LNv Development (ex vivo) | Altered visual sensory experience [26] | Dendritic filopodia dynamics & branch persistence [26] | Minutes to hours (time-lapse) [26] | Powerful genetics; accessible for live imaging | Evolutionary distance from mammals |
| Human Audiovisual Association (in vivo) | Passive exposure to paired auditory/visual stimuli [27] | Resting-state fMRI connectivity & cortical thickness (MRI) [27] | Single session (pre/post) [27] | Direct human data; whole-brain perspective | Indirect measure of synapses; low spatial resolution |
Cross-Species Validation and Technical Challenges
A critical consideration in this field is the significant interspecies variation in plastic processes. For instance, the genesis of new neurons (adult neurogenesis) is widespread and lifelong in fish but quite reduced in both its spatial extent and duration in mammals [3]. Even between mice and humans, there are remarkable differences; neurogenic activity in the lateral ventricle drops sharply by two years of age in humans but persists at high rates in aging mice [3]. This highlights that plasticity is not a uniform brain function but a biological tool that has been adapted for different functions across species.
Technical challenges further complicate cross-species comparisons. A key pitfall is the misinterpretation of cellular markers. For example, the protein doublecortin (DCX) is widely used as a marker for newborn neurons in neurogenic niches. However, DCX-positive neurons in the cerebral cortex layer II are often not newly born but are "dormant" immature neurons that persist post-development [3] [31]. This makes it crucial to pair immaturity markers with cell division markers (e.g., Ki67, BrdU) for conclusive results. Furthermore, the widespread proliferation of oligodendrocyte progenitor cells (OPCs) in the adult brain parenchyma can be a confounding element when quantifying cell proliferation, as OPCs are the major dividing cell population outside of neurogenic zones [3].
The Scientist's Toolkit: Essential Research Reagents & Materials
The following table details key reagents and tools essential for conducting research in dendritic remodeling and synaptogenesis.
Table 3: Research Reagent Solutions for Structural Plasticity Studies
| Reagent / Tool | Function / Application | Example Use Case |
|---|---|---|
| Fos2A-iCreER Mice | Genetic access to neurons active during a specific time window (memory trace ensembles) [25] | Labeling and chemogenetic manipulation of orbitofrontal cortex neurons active during memory encoding [25]. |
| DREADDs (Gi/Gq) | Chemogenetic silencing (Gi) or activation (Gq) of specific neuronal populations [25] | Testing necessity and sufficiency of memory trace neurons for flexible behavior [25]. |
| Serial Section Electron Microscopy (3DEM) | High-resolution 3D reconstruction of subcellular organelles (SER, endosomes, spines) [24] | Quantifying changes in SER volume and spine morphology following LTP induction [24]. |
| Two-Photon Microscopy | In vivo or ex vivo high-resolution time-lapse imaging of dendritic structures [28] [26] | Tracking the formation and elimination of dendritic spines over days during motor learning [28] [26]. |
| DCX, Ki67, BrdU | Immunohistochemical markers for neuronal immaturity (DCX) and cell proliferation (Ki67, BrdU) [3] | Identifying and quantifying adult-born neurons; requires combinatorial use for specificity [3]. |
| snRNA-seq | Single-nucleus RNA sequencing to profile transcriptomes of individual cells from postmortem tissue [31] | Identifying novel gene expression signatures of neuronal senescence (neurescence) in human brain [31]. |
The objective comparison of experimental data reveals both conserved principles and critical differences in structural plasticity across species. Core mechanisms, such as the role of NMDAR-CaMKII signaling and actin cytoskeleton remodeling, appear widely conserved from Drosophila to mammals [29] [26]. However, the rates, spatial extent, and lifelong persistence of plastic processes like synaptogenesis and adult neurogenesis show significant adaptive variation [3]. For drug development professionals, this underscores the importance of a multi-species, comparative approach. Relying solely on rodent models carries the risk of overlooking human-specific plastic capacities or pathologies. Future research must prioritize the standardization of methods across laboratories and species [3], and the development of more specific, histologically viable markers—such as the paired marker CDKN2D/ETS2 for neuronal senescence [31]—to truly validate the translational potential of neuroplasticity markers for human therapeutic applications.
Neurotrophic signaling pathways are fundamental regulators of neuronal survival, plasticity, and function in the nervous system. The tropomyosin receptor kinase B (TrkB) and p75 neurotrophin receptor (p75NTR) serve as primary receptors for brain-derived neurotrophic factor (BDNF) and other neurotrophins, activating divergent downstream signaling cascades that elicit contrasting cellular responses [32] [33]. While these receptors can function independently, emerging evidence indicates they also engage in complex interactions that modulate neuronal fate, synaptic plasticity, and cellular differentiation [34] [35]. Understanding the precise mechanisms of TrkB and p75NTR signaling is crucial for developing targeted therapeutic interventions for neurological disorders, neurodegenerative diseases, and stroke recovery [32] [5] [36].
This review provides a comprehensive comparison of TrkB and p75NTR signaling pathways, focusing on their structural characteristics, downstream effectors, and functional outcomes. We present experimental data from key studies that elucidate the distinct and interactive nature of these receptor systems, with particular emphasis on their roles in cellular survival, apoptosis, and neural circuit modulation. The integration of these findings across multiple experimental models and species provides critical insights for validating neuroplasticity markers and developing novel therapeutic strategies.
Receptor Structures and Ligand Interactions
Structural Characteristics and Binding Properties
TrkB and p75NTR represent distinct classes of neurotrophin receptors with specialized structural features and ligand binding properties. TrkB is a receptor tyrosine kinase that forms dimers upon ligand binding, activating its intracellular kinase domain through autophosphorylation [33]. In contrast, p75NTR belongs to the tumor necrosis factor receptor superfamily and contains a death domain in its cytoplasmic region, enabling it to initiate apoptotic signaling cascades under specific conditions [33].
The ligand affinity and selectivity of these receptors differ significantly. TrkB exhibits high-affinity binding for mature BDNF and NT-4/5, with dissociation constants (Kd) in the nanomolar range [33]. p75NTR serves as a lower-affinity receptor for all neurotrophins, including mature BDNF and its precursor (proBDNF), with binding affinities typically in the nanomolar to micromolar range [37] [33]. This differential binding affinity provides a mechanism for contextual neurotrophin signaling, where the cellular response depends on ligand concentration, receptor expression levels, and the local microenvironment.
Table 1: Structural and Ligand-Binding Properties of TrkB and p75NTR
| Feature | TrkB | p75NTR |
|---|---|---|
| Receptor Type | Tyrosine kinase | TNF receptor superfamily |
| Intracellular Domains | Tyrosine kinase domain | Death domain |
| High-Affinity Ligands | Mature BDNF, NT-4/5 | proBDNF (preferential) |
| Low-Affinity Ligands | NT-3 | All mature neurotrophins |
| Typical Kd Values | ~10⁻¹¹ M (NGF for TrkA) [33] | ~10⁻⁹ M [33] |
| Coreceptor Interactions | p75NTR, Trk isoforms | Trk receptors, sortilin |
Context-Dependent Receptor Interactions
The interaction between TrkB and p75NTR adds considerable complexity to neurotrophin signaling. Research demonstrates that these receptors can form complexes after ligand binding and internalization, particularly in early endosomes of hippocampal neurons [34]. This association occurs following BDNF binding and requires phosphorylation of TrkB, suggesting the complex formation regulates signaling rather than initial ligand binding [34].
The functional outcome of TrkB-p75NTR interactions appears to be context-dependent, influenced by cell type, neurotrophin concentration, and receptor expression ratios. In hippocampal neurons, the association of TrkB with p75NTR is necessary for optimal activation of the PI3K-Akt signaling pathway but not the Erk pathway, indicating selective modulation of downstream signaling branches [34]. This cooperative signaling enhances neuronal survival in trophic deprivation models, highlighting the physiological significance of receptor crosstalk [34].
Downstream Signaling Pathways and Effectors
TrkB-Mediated Survival and Plasticity Pathways
TrkB activation initiates several well-characterized signaling cascades that promote neuronal survival, differentiation, and synaptic plasticity. The primary pathways include:
PI3K-Akt Pathway: BDNF binding to TrkB triggers phosphorylation of specific tyrosine residues in the intracellular domain, creating docking sites for phosphoinositide 3-kinase (PI3K). This leads to Akt activation, which phosphorylates downstream targets including BAD, caspase-9, and transcription factors of the Forkhead family, suppressing apoptotic signals and enhancing cell survival [34] [33].
MAPK/Erk Pathway: TrkB activation also recruits adaptor proteins that activate the Ras-MAPK pathway, culminating in Erk phosphorylation. This pathway regulates gene expression through transcription factors like CREB, influencing neuronal differentiation, synaptic plasticity, and long-term potentiation [34] [37].
PLCγ Pathway: Phospholipase C gamma (PLCγ) binds to phosphorylated TrkB, leading to hydrolysis of phosphatidylinositol 4,5-bisphosphate (PIP2) into inositol trisphosphate (IP3) and diacylglycerol (DAG). This generates calcium release from intracellular stores and protein kinase C (PKC) activation, modulating synaptic transmission and plasticity [32].
Table 2: Major Downstream Signaling Pathways Activated by TrkB and p75NTR
| Signaling Pathway | Primary Receptor | Key Effectors | Biological Outcomes |
|---|---|---|---|
| PI3K-Akt | TrkB | PI3K, Akt, BAD, GSK-3β | Cell survival, growth, metabolism [34] |
| MAPK/Erk | TrkB | Ras, Raf, MEK, Erk, CREB | Differentiation, plasticity, gene expression [34] [37] |
| PLCγ | TrkB | PLCγ, IP3, DAG, PKC | Synaptic plasticity, calcium signaling [32] |
| NF-κB | p75NTR | IκB kinase, NF-κB | Survival, inflammation (context-dependent) [33] |
| RhoA | p75NTR | Rho GTPase, ROCK | Growth cone collapse, neurite retraction [33] |
| JNK | p75NTR | JNK, c-Jun | Apoptosis, stress response [33] |
p75NTR-Mediated Signaling and Functional Outcomes
p75NTR activates several distinct signaling pathways that can promote either survival or apoptosis depending on cellular context and receptor interactions:
NF-κB Pathway: p75NTR engagement can activate the transcription factor NF-κB through interactions with TRAF family proteins, promoting neuronal survival under specific conditions. This pathway requires cell stress for direct p75NTR-mediated activation and involves complex regulation [33].
RhoA Signaling: p75NTR modulates the activity of RhoA GTPase, which regulates actin cytoskeleton dynamics. This pathway mediates growth cone collapse and inhibits neurite outgrowth, particularly in the presence of myelin-derived inhibitors [33].
JNK Pathway: Through interactions with various adaptor proteins, p75NTR can activate c-Jun N-terminal kinase (JNK), leading to phosphorylation of c-Jun and other transcription factors that promote apoptosis, particularly in the absence of Trk signaling [33].
The functional outcomes of p75NTR signaling are highly context-dependent. In the presence of Trk receptors, p75NTR often enhances neurotrophin binding affinity and specificity, promoting survival signals. However, when expressed alone or during neural injury, p75NTR can initiate apoptotic programs through its death domain and JNK activation [33].
Figure 1: Neurotrophin Signaling Pathways Through TrkB and p75NTR. Mature BDNF primarily activates TrkB receptors, promoting survival and plasticity pathways. proBDNF preferentially binds p75NTR, initiating pathways that can lead to growth cone collapse or apoptosis. Under specific conditions, receptor complexes form, enhancing specific downstream signaling.
Experimental Data and Cross-Species Validation
Quantitative Assessment of Signaling Outcomes
Direct comparison of experimental data reveals the contrasting signaling properties of TrkB and p75NTR pathways. Studies using receptor-specific inhibitors and genetic manipulations have quantified the contributions of these receptors to various cellular processes:
In hippocampal neuron cultures, BDNF treatment (25 ng/mL) induces association between TrkB and full-length p75NTR after ligand binding and receptor internalization [34]. When p75NTR is absent, BDNF-mediated activation of the PI3K-Akt pathway is significantly impaired, while Erk signaling remains largely unaffected, demonstrating pathway-specific modulation [34]. This selective signaling impairment translates to functional deficits, as p75NTR knockout neurons show reduced survival rescue by BDNF in trophic deprivation models [34].
Research on long-term synaptic plasticity demonstrates that BDNF-TrkB signaling promotes slowly developing long-lasting synaptic enhancement (RISE) coupled with synaptogenesis, while proBDNF-p75NTR signaling induces long-lasting synaptic suppression (LOSS) accompanied by synapse elimination [37]. Pharmacological masking of TrkB receptors not only inhibits RISE but converts the response to LOSS, indicating that BDNF can activate p75NTR signaling when TrkB is unavailable [37]. Similarly, masking p75NTR during LTD induction converts synaptic suppression to enhancement, revealing the bidirectional plasticity controlled by these receptor systems.
Table 3: Experimental Evidence for Contrasting TrkB and p75NTR Functions
| Experimental Model | TrkB-Mediated Effects | p75NTR-Mediated Effects | Citation |
|---|---|---|---|
| Hippocampal Neurons (Culture) | Promotes survival via PI3K-Akt; BDNF (25 ng/ml) | Necessary for optimal Akt activation; knockout impairs survival | [34] |
| Organotypic Slice Cultures | RISE: synaptic enhancement, synaptogenesis | LOSS: synaptic suppression, elimination | [37] |
| Neural Stem Cells (SVZ) | Low [BDNF] promotes self-renewal via TrkB | High [BDNF] enhances differentiation via p75NTR | [35] |
| Stroke Rehabilitation (Human) | Associated with recovery markers (GDF-10, uPAR) | Potential role in neural repair mechanisms | [5] |
| Inflammation Model (Mice) | BDNF prevents LPS-induced GABAergic marker reduction | Not specifically measured in this study | [38] |
Concentration-Dependent Signaling Effects
The concentration of neurotrophins emerges as a critical factor determining signaling outcomes through TrkB and p75NTR. In adult neural stem cells (NSCs) from the mouse subventricular zone, low BDNF concentrations (primarily activating TrkB) promote self-renewal and proliferation, while higher BDNF concentrations (engaging p75NTR) potentiate TrkB-dependent effects and promote differentiation along the oligodendrocyte lineage [35].
This concentration-dependent effect demonstrates how the same ligand can elicit different cellular responses based on receptor engagement patterns. The use of p75NTR antagonists reduces BDNF-enhanced NSC proliferation and oligodendrocyte commitment, confirming the specific contribution of this receptor to fate determination [35]. These findings have significant implications for therapeutic applications, suggesting that precise control of neurotrophin levels may be necessary to achieve desired outcomes in neural repair strategies.
Methodological Approaches and Research Tools
Key Experimental Protocols
Investigation of TrkB and p75NTR signaling employs specialized methodological approaches that enable precise manipulation and measurement of receptor activities:
Receptor Interaction Studies: The association between TrkB and p75NTR has been demonstrated through immunoprecipitation and FRET analysis in hippocampal neurons [34]. For immunoprecipitation, neurons are treated with BDNF (25 ng/mL) for various durations, lysed with detergent buffers containing protease and phosphatase inhibitors, and subjected to immunoprecipitation with anti-p75NTR antibodies followed by Western blot analysis with TrkB antibodies [34]. Acceptor photobleaching FRET using Alexa 488 (donor) and Alexa 555 (acceptor) fluorophores confirms close proximity between these receptors after BDNF stimulation [34].
Receptor Masking Experiments: Function-blocking antibodies against TrkB and p75NTR have been used to elucidate their respective contributions to synaptic plasticity [37]. In organotypic hippocampal slice cultures, application of TrkB-blocking antibodies after LTP induction converts the expected synaptic enhancement (RISE) to suppression (LOSS), while p75NTR-blocking antibodies during LTD induction convert synaptic suppression to enhancement [37]. These experiments require careful timing of antibody application relative to stimulation protocols to distinguish effects on development versus maintenance of plasticity.
Neural Stem Cell Differentiation Assays: Adult NSCs from mouse SVZ are cultured as neurospheres in DMEM/F12 medium supplemented with B27, glutamax, heparin, EGF (20 ng/mL), and FGF (10 ng/mL) [35]. For differentiation studies, neurospheres are dissociated with accutase and plated at low density (5 cells/μL) in mitogen-completed medium with varying BDNF concentrations. Self-renewal capacity is quantified by counting newly formed neurospheres after 5 days, while differentiation is assessed through immunostaining for lineage-specific markers [35].
The Scientist's Toolkit: Essential Research Reagents
Table 4: Key Research Reagents for Investigating TrkB and p75NTR Signaling
| Reagent/Category | Specific Examples | Research Application | Experimental Function |
|---|---|---|---|
| Receptor Ligands | Recombinant BDNF (25-50 ng/ml) [34] [38] | Survival, plasticity studies | Activates TrkB and p75NTR signaling pathways |
| Function-Blocking Antibodies | Anti-TrkB [37]; Anti-p75NTR (MAB365) [34] [37] | Receptor specificity studies | Blocks specific receptor function to isolate signaling contributions |
| Cell Culture Models | Hippocampal neurons [34]; SVZ NSCs [35]; Organotypic slices [37] | Pathway analysis | Provides physiological context for signaling studies |
| Signaling Inhibitors | PI3K inhibitors (e.g., LY294002); MEK inhibitors (e.g., U0126) | Pathway dissection | Blocks specific downstream signaling branches |
| Detection Methods | Western blot (pAkt, pErk) [34]; FRET [34]; qPCR [38] | Signal measurement | Quantifies pathway activation and receptor interactions |
| Animal Models | p75NTR knockout mice [34]; Conditional TrkB knockouts | In vivo validation | Determines physiological relevance of signaling mechanisms |
Implications for Therapeutic Development
The contrasting signaling properties of TrkB and p75NTR present both challenges and opportunities for therapeutic development. In stroke rehabilitation, biomarkers associated with neurotrophic signaling show promise for monitoring recovery. Serum levels of GDF-10 and uPAR, molecules involved in neuroplasticity, correlate with functional improvements during rehabilitation, suggesting their potential as biomarkers for tracking neurotrophic pathway activation [5]. Specifically, decreased endostatin and increased GDF-10 levels during the first month of rehabilitation associate with greater sensorimotor and functional improvements [5].
For neurodegenerative diseases, the balance between TrkB and p75NTR signaling may influence disease progression. The development of small molecules that selectively activate TrkB while inhibiting p75NTR-mediated apoptotic signaling represents a promising therapeutic strategy [32]. However, delivery challenges remain significant, as neurotrophic factors have limited blood-brain barrier penetration and short half-lives [32]. Innovative approaches including viral vectors, stem cell therapies, and biomaterial-based delivery systems are under investigation to overcome these limitations.
The role of neurotrophic signaling in neuropsychiatric disorders is increasingly recognized. Recent evidence demonstrates that BDNF infusion can prevent LPS-induced reductions in GABAergic interneuron markers (somatostatin, cortistatin, and neuropeptide Y) in mouse hippocampus, suggesting a protective role against inflammation-driven circuitry dysfunction [38]. These findings position BDNF signaling as a potential therapeutic target for conditions involving GABAergic dysfunction, such as schizophrenia and depression.
TrkB and p75NTR receptors mediate contrasting yet complementary signaling pathways that collectively regulate neuronal survival, plasticity, and circuit function. While TrkB primarily activates survival-promoting pathways (PI3K-Akt, MAPK/Erk, PLCγ), p75NTR can initiate both pro-survival and pro-apoptotic signals depending on cellular context and receptor interactions. The formation of TrkB-p75NTR complexes adds regulatory complexity, enabling fine-tuning of downstream signaling responses.
Experimental evidence across multiple models—from cultured neurons to animal studies and human biomarker research—demonstrates the functional significance of these signaling pathways in health and disease. The concentration-dependent effects of neurotrophins, the spatial and temporal regulation of receptor expression, and the balance between mature neurotrophins and their precursors collectively determine cellular outcomes. Future therapeutic strategies targeting neurotrophic signaling must account for this complexity, potentially through receptor-specific approaches or combinatorial treatments that optimize the balance between survival and plasticity signals while minimizing apoptotic activation.
The validation of neurotrophic pathway biomarkers across species strengthens the translational potential of these findings, offering promising avenues for diagnosing neurological conditions, monitoring treatment responses, and developing novel interventions that harness the regenerative capacity of neurotrophic signaling.
Critical Periods and Induced Plasticity (iPlasticity) Across Development
The development of neural circuits is not a static process but is profoundly shaped by experience during specific developmental windows. Critical periods are strictly defined epochs in early postnatal life when the development and maturation of functional properties of the brain are strongly dependent on experience or environmental influences [39]. During these windows, experience instructs neural networks to develop into a specific configuration that cannot be replaced by alternative connectivity patterns, leading to irreversible consequences for brain function [40]. A classic example is the critical period for ocular dominance in the visual system, where monocular deprivation leads to a permanent reduction in cortical responsiveness to the deprived eye if it occurs during this specific window [39]. In contrast, sensitive periods represent broader time windows of gradual plasticity where experience leads to many possible network configurations that can compensate for each other and remain subject to remodeling throughout development and adulthood [40].
The concept of a critical period was first articulated in the 1920s by Charles Stockard, who demonstrated that birth defects in fish embryos resulting from extreme temperatures or toxic chemicals were more likely during periods of rapid cell growth [39]. This concept was later extended to behavioral development through Konrad Lorenz's work on imprinting in ducklings, and ultimately to brain development through the seminal work of David Hubel and Torsten Wiesel on the visual system [39]. Contemporary research has refined our understanding, demonstrating that while these periods represent heightened plasticity, their effects may be more malleable than initially thought, especially through targeted interventions [41].
Understanding the mechanisms governing these plastic epochs is crucial for developing interventions for neurodevelopmental disorders and brain injury. This review synthesizes cross-species evidence on critical period mechanisms and the emerging paradigm of iPlasticity—the induced reinstatement of juvenile-like plasticity in the adult brain [42]. We compare experimental approaches across model organisms and highlight validated neuroplasticity markers with translational potential for therapeutic development.
Molecular and Circuit Mechanisms Governing Critical Period Timing
The opening and closure of critical periods are regulated by a complex interplay of molecular brakes, excitatory-inhibitory balance, and specific signaling pathways. Research across species has identified conserved mechanisms that control these developmental windows, offering potential targets for therapeutic intervention.
Cortical Inhibition and the Parvalbumin Interneuron System
A fundamental mechanism regulating critical period timing involves the maturation of GABAergic inhibition, particularly through parvalbumin-positive (PV+) interneurons [43] [42]. The onset of critical periods coincides with the maturation of these interneurons and the formation of perineuronal nets (PNNs)—specialized extracellular matrix structures that enwrap PV+ interneurons and stabilize synaptic connections [42].
Table 1: Key Molecular Regulators of Critical Period Plasticity
| Molecule/Pathway | Function in Critical Periods | Effect on Plasticity | Experimental Evidence |
|---|---|---|---|
| Parvalbumin (PV+) Interneurons | Establishment of E:I balance; critical period trigger | Delayed maturation extends plasticity; enhanced maturation accelerates closure | Visual cortex OD plasticity; slice electrophysiology [43] [42] |
| Perineuronal Nets (PNNs) | Stabilization of synaptic circuits; structural brake | Enzymatic degradation reopens plasticity in adults | Chondroitinase ABC treatment in visual cortex [42] |
| Lynx1 | Endogenous nicotinic receptor inhibitor | Deletion extends plasticity to adulthood | Visual cortex plasticity in Lynx1 KO mice [43] |
| BDNF/TrkB Signaling | Promotes interneuron maturation; synaptic plasticity | Overexpression accelerates critical period onset | BDNF overexpression studies [44] [42] |
| Oxytocin | GABA polarity switch at birth | Correct timing essential for normal development | Role in ASD models [40] |
| Thalamic Adenosine | Regulates thalamocortical LTD | Increased expression limits TC plasticity in adults | Auditory cortex slice experiments [43] |
The excitation-inhibition (E:I) balance in cortical circuits is crucial for critical period regulation. During development, the maturation of inhibitory circuits initially lags behind excitatory circuitry [39]. The subsequent establishment of appropriate E:I balance marks the onset of the critical period, while its stabilization contributes to closure [43]. In the auditory cortex, for example, E:I balance is established in thalamorecipient layer 4 neurons by postnatal day 12 in rats, coinciding with the critical period for tonal receptive field plasticity [43].
Signaling Pathways and Molecular Brakes
Beyond inhibitory circuitry, several molecular pathways act as "brakes" to limit plasticity after critical period closure. Lynx1, an endogenous inhibitor of nicotinic receptors that exhibits higher expression in adults, constrains plasticity in the visual cortex—its deletion extends plasticity into adulthood [43]. Similarly, the BDNF/tropomyosin kinase receptor B (TrkB) pathway is critical for activity-dependent plasticity processes, including neurogenesis, neuronal differentiation, and synaptic weight regulation [42].
In the auditory system, a thalamic adenosine hypothesis has been proposed, where adenosine accumulation at thalamocortical synapses contributes to the loss of plasticity in adults [43]. These molecular brakes represent potential targets for reopening plasticity in the mature brain.
iPlasticity: Reopening Critical Periods in the Adult Brain
The concept of iPlasticity (induced juvenile-like plasticity) refers to the drug-induced reinstatement of a juvenile-like plastic state in the adult brain [42]. This phenomenon demonstrates that the molecular machinery for heightened plasticity persists in adulthood but is actively suppressed, and can be reactivated through targeted interventions.
Pharmacological Induction of Plasticity
Antidepressants, particularly selective serotonin reuptake inhibitors (SSRIs), have shown remarkable ability to reactivate critical period-like plasticity in adult animals. Chronic fluoxetine treatment, when paired with specific training or experience, reopens plasticity in the adult visual cortex, promotes fear extinction, and facilitates the reversal of maladaptive behaviors [42]. This effect is associated with dematuration of PV+ interneurons—a regression to a more immature state characterized by molecular and physiological changes that reduce their inhibitory efficacy [42].
Table 2: Experimental Models of iPlasticity Induction
| Intervention | Experimental Model | Plasticity Outcome | Mechanistic Insights |
|---|---|---|---|
| Chronic Fluoxetine | Adult rat visual cortex; monocular deprivation | Ocular dominance shift; recovery from amblyopia | Reduced intracortical inhibition; increased BDNF; PV+ interneuron dematuration [42] |
| Environmental Enrichment | Rodent models of early adversity | Normalization of HPA axis; reversal of behavioral deficits | Epigenetic modifications; increased synaptic complexity [41] [45] |
| Chondroitinase ABC | Adult mouse visual cortex | Reopening of OD plasticity | PNN degradation; disrupted circuit stabilization [42] |
| Lynx1 Deletion | Adult mouse visual cortex | Extended plasticity to P60 | Disinhibition of nicotinic receptors [43] |
| Psychedelics (e.g., DOI) | Rat claustrum-ACC pathway | Reversal of LTD to LTP | 5-HT2A receptor activation; metaplasticity [46] |
Recently, psychedelic compounds have emerged as powerful inducers of plasticity. These substances, including DOI and psilocybin, activate serotonin 2A receptors (5-HT2AR) and can reopen juvenile-like critical periods for social reward learning in adult mice [46]. In the claustrum-anterior cingulate cortex pathway, the psychedelic DOI reverses the polarity of synaptic plasticity from long-term depression to long-term potentiation [46]. This represents a form of metaplasticity—where the prior history of synaptic activity modifies future plasticity—and may underlie the lasting therapeutic effects of psychedelics in psychiatric disorders.
Cross-Species Validation of Plasticity Markers
Cross-species approaches have been instrumental in validating biomarkers of neuroplasticity. These studies combine genetic and molecular investigations in animals with neuroimaging in humans, providing complementary insights across different scales of resolution [44]. For example, research on fear extinction has demonstrated parallel behaviors in rodents and humans, with impaired extinction in both species associated with the BDNF Met allele and altered fronto-amygdalar circuitry [44]. Similarly, developmental studies show reduced fear extinction during adolescence in both mice and humans, linked to distinct synaptic plasticity patterns in the ventromedial prefrontal cortex [44].
Diagram 1: Mechanisms of iPlasticity Induction. This flowchart illustrates how various interventions target specific molecular and cellular pathways to reactivate juvenile-like plasticity in adult brains, leading to functional recovery and enhanced learning.
Experimental Models and Methodologies for Plasticity Research
Key Experimental Protocols
Visual Cortex Monocular Deprivation Protocol: The ocular dominance shift paradigm represents the gold standard for studying critical period plasticity [42] [39]. In this protocol, one eyelid is surgically closed for a specific duration during the critical period (typically P20-P45 in mice). Visual evoked potentials (VEPs) are then recorded from the binocular region of the primary visual cortex to quantify neuronal responses to stimulation of each eye. The ocular dominance index is calculated as the ratio of contralateral to ipsilateral VEP responses, with shifts indicating experience-dependent plasticity [42]. In iPlasticity studies, this protocol is combined with interventions like chronic fluoxetine administration (typically 3-5 weeks via drinking water) in adult animals to test the reopening of plasticity [42].
Fear Extinction Training: This behavioral paradigm examines plasticity in emotional circuits and has strong cross-species validity [44]. Animals are first trained to associate a neutral conditioned stimulus (CS, e.g., tone) with an aversive unconditioned stimulus (US, e.g., foot shock). After consolidation of this fear memory, extinction training involves repeated presentations of the CS without the US. The reduction in conditioned fear responses (e.g., freezing in rodents, galvanic skin response in humans) measures extinction learning, which depends on prefrontal-amygdala circuitry [44]. This protocol has been used to demonstrate impaired extinction in BDNF Met allele carriers across species [44].
Thalamocortical Slice Electrophysiology: To investigate monosynaptic mechanisms of plasticity, acute brain slices containing the auditory thalamus and cortex are prepared from mice at different developmental stages [43]. Thalamocortical long-term potentiation and depression are induced using pairing protocols that correlate presynaptic thalamic stimulation with postsynaptic cortical depolarization. This approach revealed that thalamocortical synapses lose their plasticity abruptly after postnatal day 15 in mice, coinciding with critical period closure [43].
The Scientist's Toolkit: Essential Research Reagents
Table 3: Key Research Reagents for Plasticity Studies
| Reagent/Category | Specific Examples | Research Application | Function in Experimental Design |
|---|---|---|---|
| Pharmacological Agents | Fluoxetine, Chondroitinase ABC, DOI | iPlasticity induction; critical period reopening | Target specific molecular pathways (serotonin, extracellular matrix) to remove plasticity brakes [42] [46] |
| Genetic Models | BDNF Met allele mice, Lynx1 KO, PV-Cre lines | Mechanism testing; cross-species validation | Identify causal genes; cell-type specific manipulation; model human genetic variations [43] [44] |
| Viral Vectors | AAV-hSyn-EGFP, DIO-opsins | Circuit mapping; functional manipulation | Label specific projections; optogenetic/chemogenetic control of defined circuits [46] |
| Activity Reporters | c-Fos, Arc, GCaMP | Neural activity mapping | Identify plasticity-related neural ensembles; monitor circuit dynamics in vivo [44] |
| Electrophysiology Systems | Multi-electrode arrays, patch-clamp rigs | Synaptic plasticity quantification | Measure LTP/LTD; characterize E:I balance; single-neuron properties [43] [46] |
Comparative Analysis of Plasticity Across Model Systems
Cross-species approaches provide complementary insights into neuroplasticity mechanisms by leveraging the unique advantages of different model organisms. Rodent models enable precise molecular and cellular manipulation through genetic tools and detailed circuit mapping, while human studies provide essential validation through neuroimaging and behavioral assessment [44]. Non-human primate studies bridge this gap with closer physiological and anatomical similarity to humans.
The BDNF Val66Met polymorphism exemplifies successful cross-species validation. Both humans and mice carrying the Met allele show impaired fear extinction, accompanied by reduced vmPFC activation and elevated amygdala activity [44]. This translational approach confirms the role of BDNF in prefrontal-amygdala circuitry and provides a genetic model for testing novel therapeutics for anxiety disorders.
Similarly, developmental studies reveal conserved patterns of adolescent plasticity across species. Both human and rodent adolescents show reduced fear extinction compared to children and adults, linked to distinct synaptic plasticity patterns in the ventromedial prefrontal cortex [44]. These parallel findings strengthen the translational relevance of developmental plasticity mechanisms.
Diagram 2: Cross-Species Validation Approach. This diagram illustrates how rodent models and human studies provide complementary data that converges to validate neuroplasticity mechanisms and interventions across species.
Implications for Therapeutic Development and Future Directions
The mechanistic understanding of critical periods and iPlasticity opens promising avenues for therapeutic interventions in neurodevelopmental disorders, brain injury, and psychiatric conditions. The recognition that molecular brakes actively suppress plasticity in the adult brain suggests they can be targeted to restore adaptive plasticity when needed.
Combination therapies that pair plasticity-inducing drugs with targeted rehabilitation show particular promise. Clinical studies demonstrate that patients with depression respond better to SSRIs combined with psychotherapy than to either treatment alone [42]. This aligns with the iPlasticity principle: SSRIs may reopen a plastic state, while psychotherapy provides the targeted experience to guide circuit reorganization [42]. Similarly, in animal models, fluoxetine treatment enables recovery from amblyopia in adult rats only when combined with visual training [42].
Future research should focus on several key areas: First, developing cell-type specific interventions that can precisely target plasticity regulators without widespread system effects. Second, establishing biomarkers of plastic states to identify optimal timing for interventions. Third, understanding individual differences in critical period timing and plasticity capacity, potentially informed by genetic variants like BDNF Met. Finally, exploring non-pharmacological approaches to induce iPlasticity, such as exercise or environmental enrichment, which have shown beneficial effects on brain function across species [45].
The continued integration of cross-species approaches will be essential for translating these findings into effective therapies. As we refine our understanding of how to safely harness the brain's plastic potential, we move closer to treatments that can genuinely restore function by remodeling neural circuits, rather than merely managing symptoms.
Measuring Neuroplasticity: From Animal Models to Human Biomarkers
This guide provides an objective comparison of Transcranial Magnetic Stimulation (TMS), Theta-Burst Stimulation (TBS), and Direct Current Stimulation (tDCS) for researchers validating neuroplasticity markers across species. It synthesizes current experimental data, detailed methodologies, and key reagents to inform therapeutic development.
Comparative Performance of Neuromodulation Techniques
The following tables summarize the key electrophysiological effects, therapeutic outcomes, and technical specifications of these neuromodulation techniques, based on recent clinical and pre-clinical findings.
Table 1: Electrophysiological Effects and Neuroplasticity Markers
| Technique | Electrophysiological Readout | Impact on Cortical Excitability | Molecular Markers of Neuroplasticity |
|---|---|---|---|
| TBS (iTBS) | Motor Evoked Potential (MEP) facilitation [47] | Increased excitability (LTP-like) [47] | Increased c-Fos expression (excitatory neurons) [48] |
| TBS (cTBS) | Motor Evoked Potential (MEP) reduction [47] | Decreased excitability (LTD-like) [47] | Increased GAD-65 expression (inhibitory neurons); suppressed c-Fos [48] |
| tDCS (anodal) | Shift in resting membrane potential [48] | Increased excitability [48] | Augmented long-term potentiation (LTP) in animal models [49] |
| tDCS (cathodal) | Shift in resting membrane potential [48] | Decreased excitability [48] | Effects on long-term depression (LTD) [49] |
| rTMS (HF) | MEP amplitude increase [50] | Increased excitability [50] | Modulates beta-band oscillations in PD [51] |
| tBES | MEP changes; LFP voltage dynamics [52] [48] | Polarity- and pattern-dependent plasticity [48] | Induces short-term plasticity in human iEEG [52] |
Table 2: Therapeutic Efficacy and Protocol Parameters
| Technique | Reported Clinical Efficacy | Typical Protocol Parameters | Spatial Resolution |
|---|---|---|---|
| iTBS | Non-inferior to HF-rTMS for depression [47]; Improved working memory response time [49] | 600 pulses; 3-pulse 50 Hz bursts at 5 Hz; 80% AMT [47] [49] | Moderate (focal cortical) |
| cTBS | Induction of inhibitory effects [47] | 300-600 pulses; continuous train [47] | Moderate (focal cortical) |
| tDCS | Small positive effects on working memory [49] | 1-2 mA; 20-30 min; anode/cathode positioning critical [48] [49] | Low (diffuse cortical) |
| Bilateral rTMS (BL-rTMS) | Best for upper limb motor function and ADL in early stroke [50] | Combined high- and low-frequency stimulation [50] | Moderate (focal cortical) |
| LF-rTMS | Best for lower limb motor function in early stroke [50] | ≤1 Hz frequency [50] | Moderate (focal cortical) |
| tBES | Positive neurorehabilitation in stroke [48] | Combined DC (1-2 mA) and TBS patterns [48] | Moderate to High (with HD electrodes) |
Detailed Experimental Protocols
Intracranial Theta-Burst Stimulation in Humans
This protocol investigates TBS-induced network remodeling using intracranial EEG (iEEG), providing high-resolution data on human neuroplasticity [52].
- Subjects: 10 pre-surgical epilepsy patients with implanted depth electrodes (4567 recording channels) [52].
- Stimulation Parameters:
- Pattern: Five 200 Hz bursts (50 ms duration) per train, spaced at theta rhythm (~5 Hz).
- Current: 1 mA and 2 mA biphasic pulses.
- Targets: 29 frontal and temporal sites (ACC, DLPFC, VLPFC, temporal lobe) [52].
- Recording & Analysis: Continuous iEEG recorded. Post-burst TBS response amplitude (peak-to-trough) quantified and compared to pre-train baseline. Channels classified as responsive or non-responsive based on significant activity change [52].
- Key Metrics: TBS response amplitude, spatial spread, and short-term plasticity (dynamic amplitude changes across trains) [52].
Transcranial Burst Electrical Stimulation in Rodents
This rodent model assesses the neuromodulatory effects of tBES, a technique combining tDCS and TBS, on motor cortical excitability and neural biomarkers [48].
- Subjects: 40 adult Sprague-Dawley rats randomly assigned to tBES+, tBES-, tDCS+, tDCS-, or sham groups [48].
- Stimulation Parameters:
- tBES+: Anodal DC combined with intermittent TBS (iTBS).
- tBES-: Cathodal DC combined with continuous TBS (cTBS).
- tDCS+/tDCS-: Conventional anodal/cathodal tDCS.
- Control: Sham stimulation [48].
- Outcome Measures:
- Primary: Motor Evoked Potentials (MEPs) recorded pre- and post-stimulation to assess cortical excitability changes.
- Secondary: Immunohistochemical analysis of brain tissue for c-Fos (excitatory activity), GAD-65 (inhibitory activity), and GFAP (safety/neural injury) [48].
- Key Metrics: MEP amplitude change, c-Fos positive cell count, GAD-65 density, and GFAP expression levels [48].
Non-Invasive Stimulation for Working Memory in Humans
This human study directly compares the cognitive effects of tDCS and iTBS applied to the dorsolateral prefrontal cortex (DLPFC) [49].
- Design: Factorial, double-blinded, within-subjects design where 24 healthy participants underwent four sessions (tDCS-alone, iTBS-alone, combined, placebo) in randomized order [49].
- Stimulation Parameters:
- tDCS: Bilaterally over the DLPFC.
- iTBS: Neuronavigated to the left DLPFC.
- Combined: tDCS applied for ~11 minutes with iTBS concurrently for the final 8 minutes 40 seconds [49].
- Task & Assessment: Following each stimulation session, participants performed a 2-back working memory task. Accuracy and response time were recorded, and an adverse effect scale was administered [49].
- Key Metrics: 2-back task accuracy and response time.
Signaling Pathways and Experimental Workflows
TBS-Induced Neuroplasticity Pathway
Cross-Species Experimental Workflow
The Scientist's Toolkit: Key Research Reagents and Equipment
Table 3: Essential Materials for Electrophysiology Research
| Item | Function/Application | Example Use-Case |
|---|---|---|
| Intracranial EEG (iEEG) | Records voltage dynamics with high spatiotemporal resolution during direct electrical stimulation. | Mapping TBS-evoked network remodeling in humans [52]. |
| Motor Evoked Potential (MEP) | Quantitative measure of motor cortex excitability following TMS or TBS. | Assessing cortical facilitation/inhibition from iTBS/cTBS [47] [48]. |
| Local Field Potential (LFP) | Records extracellular electrical activity from neuronal populations using implanted electrodes. | Measuring oscillatory changes in subcortical structures (e.g., STN in PD) [53] [51]. |
| c-Fos Antibodies | Immunohistochemical marker for recent neuronal excitation and plasticity. | Identifying excitatory neuronal activity post-tBES in rodent models [48]. |
| GAD-65 Antibodies | Immunohistochemical marker for inhibitory interneuron activity. | Visualizing changes in inhibitory circuits following neuromodulation [48]. |
| Neuronavigation System | Precisely targets stimulation to specific cortical regions using individual MRI data. | Ensuring accurate targeting of left DLPFC in tDCS/iTBS studies [49]. |
| Microelectrode Recording (MER) | Records focal electrophysiology to identify and confirm deep brain structures. | Precise localization of STN or GPi for DBS surgery [51]. |
The validation of neuroplasticity markers across species represents a critical frontier in translational neuroscience, enabling the development of novel therapeutics for neurological and psychiatric disorders. Among the most promising non-invasive tools for this endeavor are two distinct neuroimaging biomarkers: Amplitude of Low-Frequency Fluctuation (ALFF) measured via functional magnetic resonance imaging (fMRI) and Diffusion Tensor Imaging (DTI). These biomarkers capture complementary aspects of brain organization—ALFF quantifies spontaneous neural activity through low-frequency oscillations in the blood oxygenation level-dependent (BOLD) signal, while DTI maps white matter microstructure by measuring water diffusion anisotropy. This comparison guide objectively evaluates their performance characteristics, technical requirements, and applications within cross-species neuroplasticity research, providing drug development professionals with essential data for biomarker selection.
Technical Foundations and Methodological Protocols
fMRI ALFF: Capturing Intrinsic Brain Activity
Amplitude of Low-Frequency Fluctuation (ALFF) is a resting-state fMRI metric that quantifies the intensity of spontaneous neural activity by measuring the square root of the power spectrum within the low-frequency range (typically 0.01-0.1 Hz) at each voxel [54]. The closely-related fractional ALFF (fALFF) represents the ratio of low-frequency power to the total power across the entire frequency spectrum, offering improved specificity to gray matter by reducing sensitivity to physiological noise from ventricles and blood vessels [54].
Table 1: ALFF/fALFF Computational Parameters and Specifications
| Parameter | Typical Setting | Biological Interpretation | Technical Considerations |
|---|---|---|---|
| Frequency Range | 0.01-0.1 Hz [54] | Reflects spontaneous neural oscillations | Narrower bands (e.g., 0.01-0.08 Hz) sometimes used [55] |
| Signal Source | BOLD fMRI time series | Indirect measure of neural activity via neurovascular coupling | Sensitive to physiological noise (e.g., cardiac, respiratory) |
| Processing Space | Native or template space [54] | Enables cross-subject comparison | Spatial normalization impacts regional values |
| Normalization | Z-score transformation | Standardizes values for group comparison | Removes absolute power information |
| Reliability | Moderate to high test-retest reliability [56] [54] | Suitable for longitudinal studies | ALFF generally more reliable than fALFF [54] |
Standardized ALFF processing pipelines involve several sequential steps, implemented through platforms like the Configurable Pipeline for the Analysis of Connectomes (CPAC) [54]:
- Data Acquisition: Eyes-closed or eyes-open resting-state fMRI scans (typically 5-8 minutes) using BOLD sequences on 3T scanners [55] [57]
- Preprocessing: Removal of initial time points, slice timing correction, head motion realignment, normalization to standard space, and band-pass filtering (0.01-0.1 Hz) [55] [54]
- Power Spectrum Calculation: Fast Fourier Transform conversion of time series to frequency domain [58]
- ALFF Computation: Sum of amplitudes within the low-frequency range (0.01-0.1 Hz) at each voxel [54]
- fALFF Computation: Ratio of low-frequency power to total power across all frequencies [54]
- Spatial Smoothing: Application of Gaussian kernel (e.g., 8mm FWHM) to reduce noise [58]
- Statistical Analysis: Group comparisons and correlation with clinical measures [55] [57]
Diffusion Tensor Imaging: Mapping White Matter Architecture
Diffusion Tensor Imaging (DTI) is a magnetic resonance technique that measures the directionality and magnitude of water molecule diffusion in tissue, providing insights into white matter microstructure. While specific DTI protocols were not detailed in the search results, its fundamental principles and comparative relationship to ALFF can be established through its applications in neuroplasticity research.
The core DTI processing workflow involves:
- Data Acquisition: Diffusion-weighted images (DWI) collected with multiple diffusion encoding directions
- Preprocessing: Eddy current correction, motion artifact removal, and skull stripping
- Tensor Calculation: Voxelwise fitting of diffusion tensor model to estimate principal diffusion directions
- Metric Derivation: Computation of fractional anisotropy (FA), mean diffusivity (MD), axial diffusivity (AD), and radial diffusivity (RD)
- Tractography: Reconstruction of white matter pathways based on diffusion orientation
- Statistical Analysis: Group comparisons and correlation with behavioral measures
Comparative Performance Analysis
Reliability and Reproducibility Metrics
Table 2: Reliability Comparison Between ALFF and Alternative Modalities
| Metric | Short-Term Reliability (ICC) | Long-Term Reliability (ICC) | Vulnerability to Confounds | Recommended Use Cases |
|---|---|---|---|---|
| BOLD-ALFF | 0.75-0.85 [56] | 0.65-0.75 [56] | Moderate sensitivity to motion and physiological noise [54] | Longitudinal clinical trials, cross-sectional group studies |
| fALFF | 0.65-0.75 [54] | 0.55-0.65 [54] | Reduced vascular contamination compared to ALFF [54] | Studies requiring gray matter specificity |
| CBF-Mean | 0.85-0.95 [56] | 0.80-0.90 [56] | Lower sensitivity to physiological noise | Gold standard for reliability in perfusion studies |
| DTI (FA) | Not available in sources | Not available in sources | Susceptible to eddy currents, motion artifacts | White matter integrity assessment |
Test-retest reliability represents a crucial consideration for biomarker selection in longitudinal neuroplasticity studies. The search results indicate that BOLD-ALFF demonstrates moderate to high reliability (Intraclass Correlation Coefficient approximately 0.75-0.85 for short-term and 0.65-0.75 for long-term intervals) [56], surpassing fALFF in reliability metrics while exhibiting greater sensitivity to physiological noise [54]. This reliability profile makes ALFF suitable for tracking neuroplastic changes over time in clinical trials.
Diagnostic Accuracy and Clinical Applications
Table 3: Clinical Application Performance Across Disorders
| Disorder | ALFF Classification Accuracy | Most Discriminative Regions | Correlation with Clinical Scores | Supporting Studies |
|---|---|---|---|---|
| OCD | 95.37% (ALFF maps) [58] | Prefrontal cortex, ACC, precentral gyrus [58] | Not specified | Drug-naive patients (n=54) [58] |
| GAD | Not quantified | Right postcentral/precentral gyri (lower ALFF) [57] | Negative correlation with HAM-A in postcentral gyrus [57] | First-episode patients (n=30) [57] |
| Schizophrenia | Not specified | Frontal cortex, temporal/insular regions, caudate [59] | Not specified | Multi-site study (n=306) [59] |
| Treatment-Resistant Depression | Not specified | Left middle frontal gyrus, left caudate (age-dependent) [55] | Positive correlation with HAMD in middle frontal gyrus [55] | Age-stratified analysis (n=40) [55] |
ALFF demonstrates exceptional diagnostic classification accuracy in obsessive-compulsive disorder (95.37% using support vector machine classifiers) [58], highlighting its potential as a diagnostic biomarker. In generalized anxiety disorder (GAD), aberrant ALFF in the right postcentral and precentral gyri showed significant correlations with baseline anxiety scores, while increased ALFF in the left hippocampus predicted treatment remission [57]. For treatment-resistant depression, ALFF abnormalities exhibited age-dependent patterns, with younger patients showing increased left middle frontal gyrus activity while older patients displayed alterations in the right middle temporal gyrus [55].
Cross-Species Validation Potential
The translation of neuroimaging biomarkers across species represents a particular challenge in neuroplasticity research. While the search results did not explicitly detail cross-species validation of ALFF or DTI, several relevant insights emerge:
- ALFF measures conserved low-frequency oscillations in resting-state activity, which have been demonstrated in non-human primates and rodents, facilitating direct cross-species comparison of functional brain dynamics
- DTI parameters (fractional anisotropy, mean diffusivity) provide quantitative measures of white matter organization that can be validated against histopathological measures across species
- The test-retest reliability of ALFF supports its use in longitudinal intervention studies tracking neuroplastic changes in animal models of CNS disorders
- Multi-site standardization efforts for ALFF analysis [59] provide frameworks for harmonizing acquisition and processing protocols across research centers, including those conducting parallel animal and human studies
Table 4: Key Reagents and Resources for ALFF and DTI Research
| Resource Category | Specific Examples | Function/Application | Technical Considerations |
|---|---|---|---|
| MRI Scanners | Siemens 3T Skyra [55], GE 3T Signa [57] | Data acquisition for BOLD fMRI and DTI | Field strength, gradient performance, and coil design affect data quality |
| Processing Software | DPARSF [55], C-PAC [54], FSL, Freesurfer | Image preprocessing, ALFF calculation, tensor estimation | Pipeline choices significantly impact results; standardization is critical |
| Analysis Tools | MATLAB, REST Toolkit [58], SPM | Statistical analysis, visualization, and machine learning classification | Scripting capabilities enable batch processing and custom analyses |
| Clinical Assessments | HAMD-17 [55], HAM-A [57], Y-BOCS [58] | Correlation of imaging biomarkers with clinical severity | Standardized ratings essential for valid clinical-imaging correlations |
| Experimental Paradigms | Eyes-open vs. eyes-closed resting state [56] | Controlling for physiological state during scanning | Significantly affects ALFF values, particularly in visual regions |
Integrated Analysis Workflows and Experimental Design
ALFF and DTI offer complementary insights into neuroplasticity mechanisms—ALFF captures dynamic spontaneous neural activity while DTI maps structural connectivity. For drug development professionals, ALFF provides superior classification accuracy for psychiatric disorders and reliable longitudinal tracking, while DTI offers validated microstructural correlates of white matter integrity. The integration of both biomarkers within cross-species research frameworks provides a comprehensive approach to validating neuroplasticity markers, with ALFF particularly suited for assessing functional brain dynamics in therapeutic development.
The quest to validate neuroplasticity markers across species presents a formidable challenge in molecular neuroscience. Brain plasticity, encompassing processes from adult neurogenesis to synaptic remodeling, is not a single, conserved brain function but a biological tool used in remarkably different ways across the evolutionary tree [3]. While cellular and molecular mechanisms show evolutionary conservation between mice and humans, striking differences exist in neuroanatomy, global connectivity, and particularly in neurogenic plasticity rates and spatial distribution [3]. For instance, the genesis of new neurons is abundant and widespread throughout life in fish but quite reduced in both space and time in mammals. Even among mammals, significant variations exist—neurogenic activity in the lateral ventricle subventricular zone persists at high rates in aging mice but drops sharply by two years in humans [3]. These interspecies variations create a critical need for advanced molecular profiling technologies that can accurately map and compare neuroplasticity mechanisms across evolutionary boundaries. This guide objectively compares the performance of current protein-interaction and gene expression profiling technologies that are advancing this frontier, providing experimental data and methodologies to inform researchers' tool selection.
Comparative Analysis of Protein-Interaction Network Methodologies
Performance Comparison of PPI Analysis Techniques
Table 1: Comparison of Protein-Protein Interaction Network Analysis Methods
| Method | Key Principle | Sensitivity & Specificity | Network Dynamics | Best Application Context |
|---|---|---|---|---|
| Triplet Network Score | Exploits clustering tendency using triplets of interactions [60] | Higher sensitivity/specificity vs pairwise approaches [60] | Infers static interactions only | Datasets with high clustering; kingdom-specific prior data [60] |
| DyPPIN Deep Graph Networks | DGN trained on PPINs annotated with dynamics from biochemical pathways [61] | Effectively predicts sensitivity relationships [61] | Directly predicts dynamic properties (sensitivity) | Drug design, repurposing, personalized medicine [61] |
| STRING Database | Compiles associations from experiments, predictions, prior knowledge [62] | Confidence scores 0-1; functional associations | Static snapshot with regulatory directions (v12.5) [62] | Comprehensive functional association mapping across species [62] |
Experimental Protocols for PPI Analysis
Protocol 1: Triplet-Based Protein Interaction Prediction
- Network Construction: Obtain experimental protein interactions from databases like DIP (Database of Interacting Proteins), excluding self-interactions [60].
- Prior Database Selection: Pool interactions from the same kingdom (eukaryotes/prokaryotes) for better accuracy than cross-kingdom priors [60].
- Characteristic Classification: Classify proteins into structural (e.g., SCOP classes via SUPERFAMILY) and functional groups (e.g., Gene Ontology Molecular Function) [60].
- Triplet Formation: Build "characteristic triplets" of vectors according to interacting patterns (triangles and lines of three characteristic vectors) [60].
- Scoring & Validation: Compute triplet-based score and validate against measures like expression profile index (EPR) for biological relevance [60].
Protocol 2: Dynamic PPIN Sensitivity Analysis
- Dataset Extraction: Analyze Biochemical Pathways (BPs) from BioModels database using ODE simulations to compute sensitivity values for input/output molecular species pairs [61].
- Network Annotation: Map BP proteins/complexes to PPIN nodes using public ontologies (BioGRID, UniPROT) to create DyPPIN dataset with sensitivity annotations [61].
- Model Training: Train Deep Graph Network on DyPPIN dataset where examples are labeled PPIN subgraphs induced by input/output proteins [61].
- Inference Phase: Use trained DGN to predict sensitivity directly from PPIN subgraph structure, potentially enhanced with protein sequence embeddings [61].
Comparative Analysis of Gene Expression Profiling Technologies
Performance Comparison of Gene Expression Methods
Table 2: Comparison of Gene Expression Profiling Technologies for Cross-Species Research
| Technology | Principle | Tissue Requirements | Cross-Species Compatibility | Key Limitations |
|---|---|---|---|---|
| SEQUOIA | Linearized transformer predicting expression from histology images [63] | WSIs (routine histology) [63] | Developed on 16 cancer types; requires cancer-type specific training [63] | Performance depends on training set size [63] |
| PrediXcan | Regularized linear regression (elastic net) using eQTLs [64] | Genotype data + eQTL reference [64] | Tissue-specific eQTL models (GTEx, BrainEAC) [64] | BrainEAC underperforms vs GTEx for frontal cortex [64] |
| eGenScore | Polygenic scoring with LD filtering and missing genotype adjustment [64] | Genotype data + eQTL reference [64] | Tissue-specific eQTL models [64] | Underperforms vs PrediXcan regardless of training database [64] |
| RT-qPCR with Validated RGs | Amplification of cDNA with stable reference genes [65] | RNA from specific tissues/conditions [65] | Requires species-specific reference gene validation [65] | Reference gene stability varies by tissue, development, stress [65] |
Experimental Protocols for Gene Expression Analysis
Protocol 1: Digital Gene Expression Profiling from Histology (SEQUOIA)
- Sample Preparation: Collect Whole-Slide Images (WSIs) from tissue samples, typically formalin-fixed paraffin-embedded blocks sectioned and stained with H&E [63].
- Feature Extraction: Process WSIs by cropping into smaller tiles, extracting features using UNI foundation model optimized for histological feature extraction [63].
- Tile Aggregation: Employ linearized attention transformer to model contextual relationships between tiles while reducing parameter burden versus standard transformers [63].
- Model Training: Train model independently for each tissue/cancer type using five-fold cross-validation with 80% patients for training (10% as validation) and 20% for testing [63].
- Validation: Compare predicted versus actual expression values (from RNA-seq) using Pearson correlation and RMSE, with significance testing via Steiger's Z test [63].
Protocol 2: Reference Gene Validation for Cross-Species Neuroplasticity Studies
- Transcriptome Analysis: Retrieve commonly used reference genes from transcriptome datasets of target species, calculate TPM values [65].
- Candidate Selection: Apply coefficient of variation (CV < 0.3) and fold change (|log2FC| < 0.2) thresholds to identify stable genes across conditions [65].
- Experimental Validation: Determine expression of candidate reference genes across relevant conditions (development, stress treatments) using RT-qPCR [65].
- Stability Analysis: Evaluate expression stability using multiple algorithms (ΔCt, geNorm, NormFinder, BestKeeper) to identify optimal reference gene combinations [65].
- Application: Use validated reference genes for normalization in target gene expression studies (e.g., neuroplasticity markers) [65].
The Scientist's Toolkit: Essential Research Reagents and Materials
Table 3: Essential Research Reagents for Cross-Species Molecular Profiling Studies
| Reagent/Resource | Function | Example Uses | Key Considerations |
|---|---|---|---|
| Protein Interaction Databases (STRING, BioGRID, DIP) | Provide curated PPI data for network construction [60] [62] [61] | Prior knowledge for prediction; validation of interactions | Kingdom-specific data improves accuracy [60] |
| Pathway Databases (KEGG, Reactome, BioModels) | Source of biochemical pathways for dynamic annotations [61] | Training DyPPIN models; pathway enrichment analysis | BioModels contains simulation-ready pathways [61] |
| eQTL Reference Datasets (GTEx, BrainEAC) | Provide genotype-expression relationships for prediction models [64] | Training PrediXcan/eGenScore models; frontal cortex expression prediction | GTEx outperforms BrainEAC for frontal cortex despite brain specificity [64] |
| Validated Reference Genes | Stable internal controls for RT-qPCR normalization [65] | Accurate quantification of neuroplasticity marker expression | Must be validated for specific species, tissue, and conditions [65] |
| Annotation Ontologies (Gene Ontology, UniPROT, SCOP) | Standardized protein/function classification [60] [61] | Mapping entities across databases; functional enrichment analysis | Enable cross-species and cross-database integration [60] |
The validation of neuroplasticity markers across species requires careful integration of complementary molecular profiling technologies. Protein-interaction networks reveal the functional context of neuroplasticity proteins, with newer approaches like DyPPIN now enabling dynamic predictions from static networks [61]. Gene expression technologies span from direct molecular measurements (RT-qPCR with validated reference genes) to emerging digital methods that predict expression from histology [63] [65]. Critically, the structural and functional differences in neuroplasticity mechanisms across species necessitate that technologies be selected and validated for each specific comparative context [3]. The most robust cross-species validation strategies will employ orthogonal verification using multiple complementary technologies, appropriate to the evolutionary distance between the model systems being compared.
The pursuit of objective biological indicators for brain disorders represents one of the most significant challenges in modern medicine. The current clinical diagnosis of brain disorders relies primarily on evaluating clinical symptoms, creating a crucial need for objective biological indicators [66]. An emerging field of research centers around brain-derived extracellular vesicles (BDEVs)—nanoscale membrane vesicles that can cross the blood-brain barrier (BBB) and be isolated from peripheral blood [67] [66]. These vesicles provide a unique "window into the brain," offering researchers and clinicians a minimally invasive method to analyze brain-specific molecular alterations.
BDEVs are a specialized class of extracellular vesicles originating from various cells within the nervous system, including neurons, glial cells, and Schwann cells [67]. A significant subset includes neuron-derived EVs (NDEVs), typically isolated using neuronal surface markers such as L1 cell adhesion molecule (L1CAM), which differentiate them from EVs produced by other brain cell types [67] [66]. The significance of BDEVs extends beyond diagnostic applications to include critical roles in disease pathogenesis, particularly in Parkinson's disease (PD), where they contribute to the aggregation and spread of alpha-synuclein (α-syn), autophagy-lysosome dysfunction, neuroinflammation, and oxidative stress [67].
This objective comparison guide explores the current landscape of BDEV biomarkers, their validation across species, and their emerging role in drug development. By providing structured experimental data, methodological protocols, and analytical frameworks, we aim to equip researchers with the tools necessary to advance this promising field.
Biomarker Comparison: Analytical Performance and Clinical Validation
The validation of BDEV biomarkers requires careful assessment of their performance across multiple parameters. The table below summarizes key biomarkers currently under investigation, their analytical characteristics, and their clinical validation status.
Table 1: Performance Comparison of Key Brain-Derived Extracellular Vesicle Biomarkers
| Biomarker | Associated Brain Disorder(s) | Reported Sensitivity/Specificity | BDEV Subtype | Key Findings and Pathological Role |
|---|---|---|---|---|
| Alpha-synuclein (α-syn) | Parkinson's Disease (PD) | High (via SAA) [67] | Neuron-Derived EVs (NDEVs) | Contributes to disease progression via aggregation and spread; seeding activity detected in NDEVs via SAA [67]. |
| Phosphorylated Tau (p-Tau 181, 217, 231) | Alzheimer's Disease (AD) | Data Missing | Neuron-Derived EVs (NDEVs) | Elevated levels in blood associated with AD pathology and disease progression; offers insights for differential diagnosis [68]. |
| Amyloid-beta (Aβ) | Alzheimer's Disease (AD) | Data Missing | Neuron-Derived EVs (NDEVs) | Reproducible findings in EV cargo analysis; implicated in amyloidosis pathology [66]. |
| DJ-1 | Parkinson's Disease (PD) | Data Missing | Brain-Derived EVs (BDEVs) | Identified as a key biomarker carried by BDEVs in peripheral blood for PD diagnosis [67]. |
| circRNAs | Alzheimer's Disease (AD), Parkinson's Disease (PD) | "Best-in-class" for AD biology [69] | Data Missing | Highly stable, brain-enriched non-coding RNAs; modulate critical AD biologic pathways (e.g., neuroinflammation, synaptic dysfunction) [69]. |
The biomarkers listed above demonstrate the potential of BDEVs to reflect diverse pathological processes. For Parkinson's disease, the seeding activity of α-syn within NDEVs, detectable using seed amplification assays (SAAs), highlights a particularly advanced application [67]. In Alzheimer's disease, phosphorylated Tau proteins in BDEVs show remarkable potential for differential diagnosis and monitoring disease progression [68]. Emerging biomarkers like circular RNAs (circRNAs) represent a transformative new class, notable for their high stability and ability to provide comprehensive insights into multiple disrupted disease pathways [69].
Table 2: Cross-Species Validation of Evidence Accumulation in Perceptual Decision-Making
| Species | Primary Behavioral Strategy | Key Model Parameter (Decision Threshold) | Priority in Speed-Accuracy Trade-off | Implications for BDEV Biomarker Translation |
|---|---|---|---|---|
| Humans | Evidence Accumulation | High decision threshold [70] | Accuracy over speed [70] | Gold standard for validating cognitive biomarkers; high threshold suggests need for high-specificity biomarkers. |
| Rats | Evidence Accumulation | Intermediate decision threshold [70] | Reward rate optimization [70] | Strong face validity for modeling human cognitive processes and testing BDEV-based therapeutic interventions. |
| Mice | Mixed (Evidence Accumulation & other strategies) | Low decision threshold, high trial-to-trial variability [70] | Speed over accuracy [70] | High variability necessitates careful experimental design; useful for initial, high-throughput screening. |
Cross-species behavioral frameworks, such as synchronized evidence accumulation tasks, are vital for establishing the face validity of animal models in neuropsychiatric research [70]. Quantitative comparisons reveal that while rats, mice, and humans employ qualitatively similar evidence accumulation strategies, they differ in key parameters like decision thresholds and priorities in speed-accuracy trade-offs [70]. These differences must be accounted for when designing experiments to validate BDEV biomarkers across species.
Experimental Protocols: From Isolation to Cargo Analysis
Isolation and Purification of Brain-Derived Extracellular Vesicles
The accurate analysis of BDEVs depends on robust and reproducible isolation methods. The following workflow details the primary protocol used in current research.
Diagram 1: BDEV Isolation Workflow
The core methodology for isolating specific BDEV subtypes from peripheral blood relies on immunoaffinity capture [66]. The foundational steps are:
- Generic EV Isolation: Extracellular vesicles are first isolated from plasma using standard methods such as ultracentrifugation or precipitation kits [66].
- Immunoaffinity Capture: The general EV pellet is then incubated with antibodies against central nervous system (CNS)-specific surface markers.
- BDEV Subtype Separation: The key markers used for capturing different BDEV subtypes are:
- Neuron-Derived EVs (NDEVs): L1 Cell Adhesion Molecule (L1CAM) is the most widely used marker [67] [66].
- Astrocyte-Derived EVs (ADEs): Glutamate Aspartate Transporter (GLAST) antibodies are employed [66].
- Oligodendrocyte-Derived EVs (ODEs): Myelin-associated proteins, such as proteolipid protein (PLP), are used as targets [66].
This protocol enables the specific capture of brain-derived vesicles from peripheral blood, allowing for subsequent analysis of their cargo. Further clarification of methods for identifying and extracting BDEVs, along with large-scale cohort studies, are needed to fully validate the accuracy and specificity of these approaches [67].
Analysis of Pathological Protein Cargo
Once isolated, the cargo of BDEVs can be analyzed to identify and quantify disease-relevant biomarkers. The following pathway illustrates the analysis of a key pathological protein in Parkinson's disease.
Diagram 2: Analyzing Pathological Alpha-Synuclein in NDEVs
The analysis of pathological proteins within BDEVs leverages highly sensitive technologies:
- Cargo Extraction: Proteins and nucleic acids are extracted from the isolated BDEV subtypes (e.g., NDEVs) for downstream analysis [67].
- Detection of Pathological Proteins: For proteins like α-synuclein, which is implicated in Parkinson's disease, the seed amplification assay (SAA) is a particularly advanced method. This assay is designed based on the observation that pathological α-syn triggers the misfolding and aggregation of normal α-syn, enabling the specific diagnosis of PD [67]. A recent study demonstrated the seeding activity of α-syn within NDEVs using a standardized SAA, highlighting their potential as valuable biomarkers [67].
- Alternative Methods: Other studies utilize more traditional methods like immunoassays (e.g., Simoa technology [68]) or mass spectrometry for the quantification of protein levels, such as phosphorylated Tau species in Alzheimer's disease [68] [66].
The Scientist's Toolkit: Essential Research Reagents and Platforms
Successful research and development in the BDEV field require a suite of specialized reagents and analytical platforms. The following table details key solutions and their applications.
Table 3: Essential Research Reagent Solutions for BDEV Biomarker Discovery
| Research Tool / Platform | Primary Function | Key Application in BDEV Research | Examples / Specifications |
|---|---|---|---|
| Immunoaffinity Kits | Specific capture of BDEV subtypes from complex biofluids. | Isolation of NDEVs, ADEs, and ODEs from plasma/serum. | Anti-L1CAM for NDEVs; Anti-GLAST for ADEs [66]. |
| Seed Amplification Assays (SAA) | Detect pathological, self-propagating protein aggregates. | Identify misfolded proteins (e.g., α-syn) within BDEVs with high specificity. | Used to demonstrate α-syn seeding activity in NDEVs for PD [67]. |
| Single Molecule Array (Simoa) | Ultra-sensitive digital immunoassay technology. | Measure low-abundance CNS-derived proteins in blood-based BDEVs (e.g., p-Tau) [68]. | Quanterix instruments for p-Tau 181, p-Tau 217, p-Tau 231 [68]. |
| Multi-omics Profiling | Comprehensive analysis of molecular cargo. | Genome-wide discovery of proteins, miRNAs, and circRNAs in BDEV cargo. | Integrated genomic, epigenomic, and proteomic data [71]. |
| AI-Powered Analytics | Identify subtle biomarker patterns in high-dimensional data. | Discover novel BDEV biomarkers from complex multi-omic and imaging datasets. | Crown Bioscience AI tools; pattern recognition in clinical data [71]. |
| Advanced Model Systems | Functional biomarker screening and target validation. | Recapitulate human tissue architecture and tumor-immune interactions for validating BDEV findings. | Organoids and humanized mouse models [71]. |
The selection of appropriate tools is critical and depends on the research objective, disease context, and stage of development [71]. For instance, research teams in early discovery phases may benefit from AI-powered high-throughput approaches, while teams validating findings might require spatial biology technologies or organoid models to confirm functional relationships between biomarkers and therapeutics [71].
Brain-derived extracellular vesicles represent a transformative avenue in the landscape of neurological biomarker research. The ability to isolate these vesicles from peripheral blood and analyze their brain-specific cargo provides an unprecedented, minimally invasive window into brain pathology for conditions like Alzheimer's and Parkinson's disease [67] [66]. The convergence of synchronized cross-species behavioral frameworks [70], advanced isolation protocols [66], and ultrasensitive detection technologies [67] [68] creates a powerful pipeline for biomarker discovery and validation.
The future of this field will be shaped by several key developments. First, there is a need to standardize and refine BDEV isolation methods to improve reproducibility across laboratories [67]. Second, large-scale cohort studies are essential to validate the accuracy, specificity, and clinical utility of these biomarkers [67]. Finally, the integration of multi-omics approaches and artificial intelligence will be crucial for moving from single-analyte measurements to comprehensive biological signatures that capture the full complexity of brain disorders [71] [72]. As these technologies mature, blood-based biomarkers from BDEVs are poised to fundamentally reshape the diagnostic and therapeutic pathways for neurological diseases, shifting the paradigm from late-stage reactive assessment to early-stage proactive identification of disease biology [69] [73].
A central challenge in modern neuroscience lies in establishing robust, translational bridges between molecular or electrophysiological markers of neuroplasticity and measurable behavioral or functional outcomes. The validation of neuroplasticity markers across species—from in vitro models and rodents to humans—is critical for understanding the pathophysiology of psychiatric and neurological disorders and for developing effective therapeutics. This guide objectively compares the performance of key experimental paradigms used to link plasticity biomarkers with functional outcomes, synthesizing data on their efficacy, temporal dynamics, and translational applicability. We focus on three primary approaches: Visually Evoked Potentials (VEPs) for assessing long-term potentiation (LTP)-like plasticity in humans, blood-based biomarkers for monitoring rehabilitation outcomes post-stroke, and molecular/cellular assays for high-throughput drug discovery. The following sections provide a detailed comparison of these paradigms, their experimental protocols, associated behavioral correlates, and the essential toolkit for their implementation in a research setting.
Comparative Analysis of Key Neuroplasticity Paradigms
The table below summarizes the core characteristics, functional correlates, and key performance metrics of three major approaches for assessing neuroplasticity.
Table 1: Comparison of Neuroplasticity Assessment Paradigms
| Paradigm | Core Measurement | Linked Functional/Behavioral Outcome | Key Quantitative Findings | Temporal Dynamics of Plasticity Change | Species Bridging |
|---|---|---|---|---|---|
| VEP Modulation [74] | EEG-recorded amplitude changes in visual evoked potentials following sensory stimulation. | Human memory performance; putative marker for cognitive deficits in psychiatric disorders (e.g., MDD, schizophrenia) [74]. | - Low-freq (2Hz): Transient increase, peaks at 2 min, dissipates by 12 min.- Theta-pulse: Moderate increase, lasts up to 28 min.- High-freq (9Hz): Sharp, brief increase [74]. | Minutes to tens of minutes. | Human (directly applicable); correlates with LTP mechanisms from rodent brain slice studies [74]. |
| Blood Biomarkers in Stroke Rehabilitation [5] | Serum levels of molecules involved in neuroplasticity and repair (e.g., GDF-10, endostatin, uPAR). | Sensorimotor and functional recovery measured by Fugl-Meyer Assessment (FMA), Barthel Index (BI), walking speed [5]. | - High baseline GDF-10/uPAR: Linked to unfavorable outcomes (e.g., FMA, MRC).- Decreased endostatin at 1 month: Correlated with greater functional improvements (FMA, MRC) [5]. | Days to months (assessed over 6-month rehab). | Human (directly measurable); inferred from known mechanistic roles in animal models of axonal sprouting and neurogenesis [5]. |
| In Vitro Neuritogenesis/Synaptogenesis Assays [75] | High-content imaging of neurite outgrowth, branch points, and pre-/post-synaptic protein colocalization. | Proxy for structural plasticity underlying learning and memory; used for screening pro-plasticity compounds for neuropsychiatric diseases [75]. | Quantifiable changes in complex parameters like neurite number, branch points, and synapse density in response to pharmacological manipulation [75]. | Hours to days. | Rodent primary neurons (in vitro); predictive validity for human therapeutic effects. |
Detailed Experimental Protocols and Methodologies
VEP Modulation Protocol for Assessing Cortical Plasticity
This non-invasive EEG protocol is designed to induce and measure LTP-like plasticity in the human visual cortex [74].
- Subjects: Healthy human volunteers with no history of neurological, psychiatric, or ocular disorders. A typical cohort size for sufficient power is ~30-70 participants [74].
- Stimulus and Setup: Participants are seated before a high-refresh-rate screen (e.g., 120 Hz). A checkerboard reversal stimulus (0.5° visual angle per check) is used to evoke VEPs. To maintain attention, participants fixate on a central cross and read out randomly appearing numbers [74].
- Baseline Recording: Baseline VEPs are recorded by presenting the checkerboard reversal stimulus for 20 seconds at a frequency of 2 reversals per second (rps), resulting in 40 sweeps [74].
- Modulation Phase (Plasticity Induction): This phase varies by protocol and is key to the plasticity outcome [74]:
- Low-Frequency (2 Hz): A single 10-minute block at 2 rps (1200 stimuli).
- Repeated Low-Frequency: Multiple blocks of low-frequency stimulation.
- High-Frequency (9 Hz): A short, high-frequency tetanic stimulation.
- Theta-Pulse Stimulation: Pulsed application mimicking theta rhythms.
- Post-Modulation Recording: VEPs are recorded again using the same parameters as the baseline, across multiple blocks at 2, 8, 12, 18, 22, and 28 minutes post-modulation [74].
- Primary Outcome Measure: The change in VEP amplitude from baseline at each post-modulation time point, serving as an index of visual cortical plasticity [74].
Blood Biomarker Assessment in Post-Stroke Recovery
This protocol outlines the longitudinal monitoring of blood biomarkers in patients undergoing rehabilitation after a stroke [5].
- Study Cohort: First-ever stroke patients (ischemic or hemorrhagic) with moderate to severe disability (modified Rankin Scale score 3-5 post-stroke). A control cohort of healthy subjects is included for comparison [5].
- Study Protocol and Rehabilitation: A prospective, observational study with a 6-month protocol. Blood sampling and a battery of sensorimotor/functional tests are conducted at baseline (pre-rehabilitation) and at 1, 3, and 6 months after rehabilitation begins. Patients receive individualized, multidisciplinary rehabilitation (physiotherapy, occupational therapy), which can be intensive (≥15 h/week) or conventional [5].
- Functional Outcome Measures: A comprehensive battery is used [5]:
- Modified Rankin Scale (mRS): Global disability.
- Barthel Index (BI): Activities of daily living.
- Fugl-Meyer Assessment (FMA) - Upper Extremity: Sensorimotor impairment.
- Functional Ambulation Categories (FAC): Walking ability.
- 10-meter walk test: Walking speed.
- Medical Research Council (MRC) scale: Muscle strength.
- Blood Sampling and Biomarker Analysis: Blood is drawn at each visit. Serum levels of endostatin, GDF-10, uPA, and uPAR are determined using Enzyme-Linked Immunosorbent Assay (ELISA) kits [5].
- Data Analysis: Statistical mixed linear models are built to investigate the relationship between biomarker levels (baseline values and changes over time) and functional outcome scores throughout the 6-month follow-up [5].
Signaling Pathways and Experimental Workflows
Simplified Neuroplasticity Signaling Pathway
The following diagram illustrates a condensed pathway integrating key signaling cascades involved in activity-dependent neuroplasticity, highlighting targets of pharmacological agents like ketamine.
Diagram 1: Neuroplasticity Signaling Pathway
VEP Plasticity Assessment Workflow
This workflow diagrams the procedural sequence for conducting a visually evoked potential (VEP) modulation experiment to assess cortical plasticity in human subjects.
Diagram 2: VEP Assessment Workflow
The Scientist's Toolkit: Essential Research Reagents and Materials
Table 2: Key Reagent Solutions for Neuroplasticity Research
| Research Tool | Function/Application in Neuroplasticity Research | Example Use-Case |
|---|---|---|
| ELISA Kits | Quantifying serum/plasma levels of plasticity-related biomarkers (e.g., BDNF, GDF-10, Endostatin, uPAR) [5]. | Monitoring biomarker changes in stroke patients during rehabilitation to correlate with functional recovery [5]. |
| High-Content Imaging Assays | High-throughput, quantitative analysis of structural plasticity parameters (neurite outgrowth, branch points, synaptogenesis) in vitro [75]. | Screening novel compounds (e.g., psychedelics, antidepressants) for their ability to promote neuritogenesis and synaptogenesis in rodent cortical cultures [75]. |
| Checkerboard Stimulus & EEG System | Non-invasive induction and recording of LTP-like plasticity in the human visual cortex via Visually Evoked Potentials (VEPs) [74]. | Comparing the efficacy of different stimulation protocols (e.g., low-frequency vs. theta-pulse) to induce sustained plasticity in healthy controls or patient groups [74]. |
| Optical Electrophysiology | Functional assessment of synaptic activity and network-level changes in neuronal cultures using calcium imaging or other fluorescence-based reporters [75]. | Profiling compound effects on neuronal excitability and synaptic signaling in a moderate-throughput format for target-based or phenotypic screening [75]. |
The validation of neuroplasticity induction across species represents a central challenge in modern neuroscience research. Pharmacological probes—selective CNS-active compounds—have emerged as indispensable tools for establishing causal links between molecular targets and functional plasticity outcomes. These chemically-defined agents allow researchers to perturb specific signaling pathways with a precision that complements genetic approaches, providing critical insights into the mechanisms underlying neuroplastic changes from cellular to behavioral levels. The strategic use of these probes follows the "pharmaco-TMS" approach, which combines CNS-active drugs with non-invasive brain stimulation (NIBS) techniques to investigate the pharmacological regulation of plasticity in the human motor cortex and other brain regions [76]. This methodology enables researchers to explore the physiological basis of plasticity and its relevance for both normal brain function and pathological conditions.
For neuropsychiatric diseases where alterations of plasticity are causally involved, exploring the impact of CNS-active drugs on neuroplasticity represents a highly attractive intermediate step in drug development [76]. The modifying effects of drugs on abnormal plasticity may constitute novel biomarkers for monitoring or predicting treatment efficacy, addressing the high rate of marketing failure in CNS drug development due to unsuccessful large-scale clinical trials. This review comprehensively compares pharmacological probes used to validate neuroplasticity induction, providing experimental data and methodological frameworks to guide researchers in selecting appropriate tools for cross-species plasticity marker validation.
Fundamental Mechanisms of Neuroplasticity Induction
Neuroplasticity encompasses structural and functional modifications of neuronal connectivity, including the weakening and strengthening of pre-existing synaptic connections, pruning of pre-existing synapses, and formation of new synapses [76]. These processes form the physiological basis of cognitive functions such as learning and memory formation, and are implicated in various neuropsychiatric diseases including dystonia, epilepsy, migraine, Alzheimer's disease, fronto-temporal degeneration, schizophrenia, and post-stroke recovery [76].
Key Experimental Paradigms for Inducing Plasticity
Several well-established protocols exist for inducing neuroplasticity in experimental settings:
Long-term potentiation (LTP) and long-term depression (LTD): These rate-based plasticity protocols involve repetitive electrical stimulation of nerve fibers. High-frequency stimulation (≥10 Hz) typically induces LTP, while low-frequency stimulation (∼1 Hz) generally induces LTD [76].
Theta-burst stimulation (TBS): This protocol delivers several bursts of 3-5 stimuli at 100 Hz at short (<1 s) inter-burst intervals, effectively inducing plasticity [76].
Spike-timing dependent plasticity (STDP): This timing-based protocol emphasizes the temporal order instead of frequency of spike trains. Both LTP and LTD can be induced at low frequency depending on precise timing relationships between pre- and postsynaptic firing [76].
Direct current stimulation (DCS): Unlike activity-dependent protocols, DCS modulates resting neuronal membrane potentials polarity-dependently. Anodal DCS typically enhances spontaneous neuronal activity and increases evoked potential size, while cathodal DCS has opposite effects [76].
The induction of DCS after-effects requires coupling between membrane polarity alterations and presynaptic neuronal activity. These effects depend on protein synthesis, alter brain-derived neurotrophic factor (BDNF) and tyrosine kinase B activation, and are accompanied by enhanced expression of immediate early genes [76].
Figure 1: Neuroplasticity Induction Pathways and Mechanisms. This diagram illustrates the major experimental protocols for inducing neuroplasticity, their corresponding induction pathways, molecular mechanisms, and functional outcomes. Different stimulation protocols engage distinct molecular pathways that converge on functional changes in synaptic strength, circuit organization, and behavior [76] [77].
Pharmacological Probes for Targeting Neuroplasticity Pathways
The strategic application of pharmacological probes allows researchers to dissect the molecular mechanisms underlying neuroplasticity and validate induction protocols across species. High-quality chemical probes must satisfy minimal fundamental criteria, known as fitness factors: potency (typically in vitro IC50 < 100 nM), selectivity (at least 30-fold against sequence-related proteins), and cellular activity at concentrations ideally below 1 μM [78] [79].
Probes Targeting Glutamatergic Signaling
Glutamatergic signaling, particularly through AMPA and NMDA receptors, plays a fundamental role in activity-dependent synaptic plasticity. The table below summarizes key pharmacological probes used to manipulate glutamatergic signaling in neuroplasticity research.
Table 1: Pharmacological Probes Targeting Glutamatergic Signaling Pathways
| Pharmacological Probe | Molecular Target | Mechanism of Action | Typical Working Concentration | Key Experimental Applications |
|---|---|---|---|---|
| Ketanserin | 5-HT2A receptor | Selective receptor antagonist | Varies by model | Blocks psychedelic-induced neuroplasticity; higher doses completely block plasticity [77] |
| AMPA Receptor Modulators | AMPA receptor | Potentiate glutamate receptor function | ~1-10 μM | Enhances dendritic growth following psychedelic stimulation; necessary for sustained mTOR activation [77] |
| NMDA Receptor Antagonists | NMDA receptor (e.g., AP5) | Block glutamate receptor function | ~50-100 μM | Prevents LTP induction; probes calcium-dependent plasticity mechanisms [76] |
Probes Targeting Neurotrophic Signaling
Brain-derived neurotrophic factor (BDNF) and its receptor TrkB represent critical signaling pathways for neuroplasticity. Several pharmacological probes target this system:
Table 2: Pharmacological Probes Targeting Neurotrophic and Developmental Signaling Pathways
| Pharmacological Probe | Molecular Target | Mechanism of Action | Typical Working Concentration | Key Experimental Applications |
|---|---|---|---|---|
| BDNF | TrkB receptor | Activates tropomyosin receptor kinase B | Varies by preparation | Enhances neuronal growth and synaptic plasticity; crucial for LTP maintenance [77] |
| K252a | TrkB receptor | Inhibits BDNF signaling | ~100-200 nM | Blocks TrkB receptor activation; tests BDNF-dependence of plasticity [77] |
| BMP Pathway Modulators | BMP receptors | Modulate bone morphogenetic protein signaling | Varies by compound | Studies of neural development, neurogenesis, and structural plasticity [78] |
| LDN-193189 | BMP type I receptors | Kinase inhibitor (ALK2, ALK3) | <5-100 nM (cellular assays) | Inhibits BMP-SMAD signaling; probes developmental plasticity [78] |
| Dorsomorphin | BMPR and AMPK | Kinase inhibitor | ~100 nM-1 μM (cellular) | Early BMP pathway inhibitor; less selective than newer probes [78] |
Probes for Monoaminergic Systems
Classic psychedelics and other monoaminergic modulators have recently emerged as powerful probes for studying neuroplasticity:
Table 3: Pharmacological Probes Targeting Monoaminergic Systems
| Pharmacological Probe | Molecular Target | Mechanism of Action | Typical Working Concentration | Key Experimental Applications |
|---|---|---|---|---|
| Psilocybin/Psilocin | 5-HT2A receptor | Serotonin receptor agonist | Varies by model | Promotes dendritogenesis, synaptogenesis, and expression of plasticity-related genes [77] |
| LSD | 5-HT2A receptor | Serotonin receptor agonist | Varies by model | Enhances expression of genes related to synaptic plasticity including BDNF [77] |
| DOI | 5-HT2A receptor | Serotonin receptor agonist | Varies by model | Promotes dendritic growth and spinogenesis in cortical neurons [77] |
| 5-MeO-DMT | 5-HT1A/5-HT2A receptors | Serotonin receptor agonist | Varies by model | Stimulates neurogenesis; potentially via 5-HT1A receptor activation [77] |
Experimental Methodologies for Probe Validation
In Vitro Electrophysiological Protocols
The fundamental protocols for inducing neuroplasticity in vitro include:
LTP Induction Protocol:
- Apply high-frequency stimulation (100 Hz for 1s) or theta-burst stimulation (4 pulses at 100 Hz, repeated at 5 Hz) to afferent pathways
- Record field excitatory postsynaptic potentials (fEPSPs) before and after induction
- Include pharmacological probe in perfusion medium during induction and/or maintenance phases
- Compare magnitude and duration of potentiation with and without probe application [76]
LTD Induction Protocol:
- Apply low-frequency stimulation (1 Hz for 15 minutes) to afferent pathways
- Record fEPSPs before and after induction
- Include pharmacological probe to test necessity of specific signaling pathways
- Monitor depression for at least 30-60 minutes post-induction [76]
Non-Invasive Brain Stimulation Combined with Pharmacology
The "pharmaco-TMS" approach represents a powerful methodology for studying human neuroplasticity:
Paired Associative Stimulation (PAS) Protocol:
- Apply peripheral nerve stimulation followed by TMS pulse at specific interstimulus intervals
- ISI of ~25 ms typically produces LTP-like effects, while ~10 ms produces LTD-like effects
- Administer pharmacological probe or placebo before PAS in randomized, cross-over design
- Measure motor evoked potential (MEP) amplitudes before and after PAS
- Compare plasticity induction with and without pharmacological manipulation [76]
Transcranial Direct Current Stimulation (tDCS) Protocol:
- Apply anodal or cathodal tDCS (typically 1-2 mA) for 10-20 minutes
- Administer pharmacological probe targeting specific neurotransmitter systems
- Measure neurophysiological (MEPs) or behavioral outcomes pre- and post-stimulation
- Anodal tDCS typically enhances cortical excitability, while cathodal reduces it [76]
Structural Plasticity Assessment
Dendritic Spine Imaging Protocol:
- Transfert neurons with fluorescent protein markers (e.g., GFP, tdTomato)
- Treat with pharmacological probe for specified duration (hours to days)
- Image dendritic segments using confocal or two-photon microscopy
- Quantify spine density, morphology, and type (thin, stubby, mushroom)
- Perform repeated imaging for longitudinal tracking of structural changes [77]
Signaling Pathways in Pharmacologically-Induced Neuroplasticity
Understanding the molecular pathways engaged by pharmacological probes is essential for interpreting their effects on neuroplasticity. The following diagram illustrates key signaling pathways targeted by various pharmacological probes in neuroplasticity research.
Figure 2: Signaling Pathways in Pharmacologically-Induced Neuroplasticity. This diagram illustrates the molecular pathways engaged by various pharmacological probes used in neuroplasticity research. Psychedelics primarily act through 5-HT2A receptors, engaging both PLC/PKC and mTOR pathways. BDNF/TrkB modulators and glutamatergic agents converge on mTOR signaling and gene expression changes. BMP pathway modulators primarily influence neurogenesis. These pathways ultimately lead to structural and functional plasticity outcomes that manifest as circuit reorganization and behavioral adaptation [76] [78] [77].
The Scientist's Toolkit: Essential Research Reagents
Table 4: Essential Research Reagents for Neuroplasticity Studies
| Research Reagent | Function/Application | Key Considerations |
|---|---|---|
| Chemical Probes | Selective modulation of specific molecular targets | Verify selectivity, potency, and cellular activity; use at recommended concentrations [78] [79] |
| Matched Target-Inactive Control Compounds | Control for off-target effects | Structurally similar but pharmacologically inactive analogs [79] |
| Orthogonal Chemical Probes | Target validation through independent mechanisms | Different chemical scaffolds targeting same protein [79] |
| Non-Invasive Brain Stimulation (NIBS) | Induce and measure plasticity in humans | TMS, tDCS, tACS protocols combined with pharmacology [76] |
| Plasticity Biomarkers | Assess neuroplasticity outcomes | BDNF, GDF-10, endostatin, uPAR measurements in blood or tissue [5] [77] |
| Synaptic Density Markers | Quantify structural plasticity | PET ligands (e.g., SV2A), immunohistochemistry for synaptic proteins [77] |
Best Practices and Methodological Considerations
The "Rule of Two" for Chemical Probe Applications
A systematic review of 662 publications employing chemical probes revealed concerning methodological limitations. Only 4% of analyzed publications used chemical probes within the recommended concentration range and included both inactive controls and orthogonal probes [79]. To address this, researchers should implement "the rule of two":
- Employ at least two chemical probes (either orthogonal target-engaging probes with different chemical scaffolds, and/or a pair of a chemical probe and matched target-inactive compound)
- Use all probes at recommended concentrations in every study [79]
Cross-Species Validation Strategies
Successful validation of neuroplasticity markers across species requires:
Parallel Studies in Animal Models and Humans:
- Develop analogous plasticity induction protocols across species (e.g., TBS in rodents and humans)
- Measure conserved molecular markers (BDNF, IEG expression) alongside functional outcomes
- Account for species-specific differences in receptor expression and circuit organization [76] [15]
Multimodal Assessment:
- Combine molecular, electrophysiological, structural, and behavioral measures
- Utilize cross-species imaging protocols (fMRI, PET) where possible
- Implement similar pharmacological challenges across species [76] [15]
Biomarker Development for Plasticity Assessment
Blood-based biomarkers provide valuable translational tools for monitoring neuroplasticity:
GDF-10 (Growth Differentiation Factor 10):
- Higher baseline levels associated with unfavorable sensorimotor outcomes after stroke
- Decreased levels during rehabilitation correlate with better recovery [5]
Endostatin:
- Significantly increased at baseline after stroke
- Decreased levels during first month of rehabilitation associated with greater sensorimotor improvements [5]
uPAR (Urokinase-type plasminogen activator receptor):
- Higher baseline values related to unfavorable Fugl-Meyer Assessment and Medical Research Council scores [5]
Pharmacological probes provide powerful tools for validating neuroplasticity induction across species, offering temporal precision and dose control that complements genetic approaches. The strategic application of these probes following best practices—including the "rule of two," appropriate dosing, and use of control compounds—enables robust conclusions about molecular mechanisms underlying neuroplasticity. As research progresses, the integration of pharmacological probes with emerging technologies such as non-invasive brain stimulation, advanced imaging, and biomarker assessment will further enhance our understanding of neuroplasticity across species and accelerate the development of novel therapeutics for neuropsychiatric disorders.
Overcoming Translational Challenges in Cross-Species Research
Species-Specific Variations in Neuroanatomy and Receptor Distribution
The pursuit of effective therapeutic strategies for neurological and psychiatric disorders relies heavily on translational research using animal models. A core challenge in this endeavor is ensuring that the neurobiological mechanisms identified in model organisms accurately reflect human brain function. Species-specific variations in neuroanatomy and receptor distribution present a significant hurdle, as differences can profoundly impact the predictive validity of preclinical findings and the eventual success of clinical trials [80]. This guide objectively compares key neuroanatomical and neurochemical features across species—including humans, rodents, and voles—by synthesizing quantitative experimental data. Framed within the broader thesis of validating neuroplasticity markers across species, this comparison provides researchers and drug development professionals with a critical resource for interpreting preclinical data and designing more translatable experiments.
Comparative Data on Neuroanatomy and Receptor Distribution
This section synthesizes empirical findings from recent studies, highlighting significant interspecies differences and similarities in brain structure and receptor expression.
Serotonin Receptor Distribution in the Emotion Regulation Network
A comparative autoradiography study directly quantified 5-HT1A and 5-HT2 receptor densities in components of the emotion regulation network in humans and rats [80]. The results reveal both conserved patterns and critical species differences, as summarized in Table 1.
Table 1: Comparative 5-HT1A and 5-HT2 Receptor Densities in the Emotion Regulation Network
| Brain Area | Species | 5-HT1A Density (fmol/mg TE) | 5-HT2 Density (fmol/mg TE) | Key Laminar Differences |
|---|---|---|---|---|
| Anterior Cingulate (Area 25/IL) | Human | Highest (e.g., ~300-400*) | Lower than 5-HT1A (e.g., ~100-200*) | Human: Highest in layers I-III; lowest in V [80] |
| Rat | Highest (Homolog: Infralimbic Cortex) | Lower than 5-HT1A | Rat: Lowest in layers I-II; highest in V-VI [80] | |
| Hippocampus (CA) | Human | High (e.g., ~250-350*); Significantly higher than DG [80] | Low | Laminar patterns show distinct species-specific profiles [80] |
| Rat | High (Homolog: CA); Significantly lower than DG [80] | Low | Laminar patterns show distinct species-specific profiles [80] | |
| Hippocampus (DG) | Human | Moderate; Lower than CA [80] | Low | Laminar patterns show distinct species-specific profiles [80] |
| Rat | High; Higher than CA [80] | Low | Laminar patterns show distinct species-specific profiles [80] | |
| Nucleus Accumbens | Human | Lowest in network (e.g., <50*) | Low | Not applicable |
| Rat | Lowest in network (Homolog: Acb) | Low | Not applicable |
Note: fmol/mg TE = femtomoles per milligram of tissue equivalent. The values in this table are estimated from graphical data and trends described in the source publication [80]. IL: Infralimbic Cortex; CA: Cornu Ammonis; DG: Dentate Gyrus.
Cellular Co-expression of Oxytocin and Dopamine Receptors in Voles
Research in monogamous prairie voles and promiscuous meadow voles has provided a canonical example of how receptor expression drives species-typical behavior. A multiplex fluorescent in situ hybridization (FISH) study mapped the cellular co-expression of Oxtr, Drd1, and Drd2 mRNA in the nucleus accumbens (NAc), with key findings summarized in Table 2 [81].
Table 2: Cellular Distribution of Oxtr, Drd1, and Drd2 in the Vole Nucleus Accumbens
| Metric | Prairie Vole | Meadow Vole | Statistical Significance & Notes |
|---|---|---|---|
| Oxtr+ Cell Count | Higher [81] | Lower [81] | Significant in NAc core, medial, and lateral shell (p < 0.0001) [81] |
| Drd1+ Cell Count | No significant species difference [81] | No significant species difference [81] | Suggests prior Drd1 expression differences may be due to upregulation in existing cells [81] |
| Drd2+ Cell Count | Lower [81] | Higher [81] | Significant in all NAc subregions (p < 0.0001) [81] |
| Key Co-expression | Oxtr enriched in Drd1+/Drd2+ cells [81] | Not reported | Suggests a cellular substrate for OXTR-DRD2 interaction critical for pair bonding [81] |
| Impact of Mating | No significant pairing-induced changes in cell counts [81] | No significant pairing-induced changes in cell counts [81] | Sociosexual experience did not alter the cellular distribution of transcripts [81] |
Hippocampal Structure and Calcium-Binding Protein Patterns in Bats
A comparative neuroanatomical study of small echolocating bats (Phyllostomidae and Vespertilionidae) revealed unique hippocampal specializations. The analysis of calcium-binding protein (CaBP) expression and neuron numbers showed species- and family-specific patterns not commonly observed in standard model organisms [82].
Table 3: Hippocampal Specializations in Echolocating Bats
| Feature | Phyllostomid Bats | Vespertilionid Bats | Comparative Significance |
|---|---|---|---|
| Calretinin (CR) in CA3 | Unique CR-positive, calbindin-negative zone at CA3 superficial boundary [82] | Standard pattern | Creates a gap between pyramidal cells and zinc-positive mossy fibers; function unknown [82] |
| Interneuron Staining | Very rare for Calbindin (CB) and CR [82] | Present | Indicates a major species difference in interneuron subpopulations [82] |
| Parvalbumin (PV) | Consistent across species [82] | Consistent across species [82] | Suggests PV function is conserved and critical for core hippocampal circuitry [82] |
| Neuron Population Emphasis | Output-dominant (well-developed SUB) [82] | Input-dominant (well-developed GC) [82] | Suggests differential information processing strategies related to ecology [82] |
| Relation to Diet | Segregated into hilus-dominant (omnivorous/frugivorous) and subiculum-dominant (vampire/nectivorous) groups [82] | Not reported | Links cellular composition of the hippocampus to foraging ecology and diet [82] |
Note: CB: Calbindin; CR: Calretinin; PV: Parvalbumin; GC: Granule Cells; SUB: Subicular Neurons.
Experimental Protocols for Key Methodologies
To support the replication and critical evaluation of the comparative data presented, this section outlines the detailed experimental protocols for the key methodologies cited.
Protocol: Multiplex Fluorescent In Situ Hybridization (FISH)
Application: Used for mapping the cellular co-expression of Oxtr, Drd1, and Drd2 mRNA in vole brain tissue [81].
- Tissue Preparation: Fresh-frozen brain tissue is cryosectioned at a thickness of 10-20 μm. Sections are mounted on slides and stored at -80°C until use.
- Probe Hybridization: Tissue sections are fixed in 4% paraformaldehyde (PFA), dehydrated through an ethanol series, and then incubated with a mix of fluorescently labeled DNA or RNA probes targeting the mRNAs of interest (e.g., Oxtr, Drd1, Drd2). Hybridization occurs overnight in a humidified chamber at a specific temperature (e.g., 55°C).
- Stringency Washes: Unbound and non-specifically bound probes are removed through a series of high-stringency saline-sodium citrate (SSC) buffer washes.
- Signal Amplification (if required): For low-abundance transcripts, a tyramide signal amplification (TSA) step may be employed to enhance the fluorescent signal.
- Nuclear Staining and Imaging: Sections are counterstained with a nuclear dye (e.g., DAPI), coverslipped, and imaged using a high-resolution, confocal, or epifluorescence microscope equipped with appropriate filter sets.
- Cell Typing and Quantification: Individual cell nuclei are outlined, and the presence or absence of each transcript is determined using automated or semi-automated image analysis software. Statistical models (e.g., binomial generalized linear mixed models) are used to analyze cell count data.
Protocol: Quantitative In Vitro Receptor Autoradiography
Application: Used for characterizing the regional and laminar distribution of 5-HT1A and 5-HT2 receptors in human and rat brain sections [80].
- Tissue Sectioning: Human post-mortem and rat brain tissue are sectioned into thin coronal slices (5-20 μm) using a cryostat. Sections are thaw-mounted onto gelatin-coated glass slides.
- Pre-incubation: Sections are pre-incubated in an appropriate buffer to remove endogenous ligands and preserve receptor integrity.
- Receptor Labeling: Sections are incubated with a radiolabeled, receptor-specific ligand (e.g., [³H]8-OH-DPAT for 5-HT1A receptors; [³H]Ketanserin for 5-HT2 receptors). To determine non-specific binding, adjacent sections are co-incubated with the radioligand and an excess of an unlabeled competitor.
- Washing and Drying: Following incubation, sections undergo a series of rapid, cold buffer washes to remove unbound radioligand. They are then dried under a stream of cold air.
- Image Acquisition and Analysis: Dried sections are exposed to a radiation-sensitive film or phosphor imaging plate alongside calibrated radioactive standards for several weeks. The resulting autoradiograms are digitized. Receptor densities are quantified by converting optical densities in defined brain regions to femtomoles per milligram of tissue equivalent (fmol/mg TE) using a standard curve generated from the co-exposed standards.
Visualizing Signaling Pathways and Experimental Workflows
The following diagrams, generated using Graphviz DOT language, illustrate the key experimental workflow for cross-species comparison and the canonical receptor interaction critical for social bonding.
Cross-Species Neuroanatomy Research Workflow
This diagram outlines the standardized pipeline for conducting comparative studies of neuroanatomy and receptor distribution.
Diagram Title: Cross-Species Neuroanatomy Research Workflow
Oxytocin-Dopamine Receptor Interaction in Social Behavior
This diagram depicts the cellular-level interaction between oxytocin and dopamine receptors in the nucleus accumbens, a key mechanism for social bonding in voles.
Diagram Title: Oxytocin-Dopamine Interaction in Social Behavior
The Scientist's Toolkit: Essential Research Reagents and Materials
This section details key reagents and tools essential for conducting research in comparative neuroanatomy and receptor distribution, providing a practical resource for experimental design.
Table 4: Essential Research Reagents and Materials
| Reagent/Material | Function/Application | Example Use Case |
|---|---|---|
| Cre-dependent AAV vectors | Deliver genes (e.g., fluorescent reporters) to specific cell populations in transgenic animals. | Targeted neural tracing in TH-Cre mice to map ARC-TH neuron projections [83]. |
| Multiplex FISH Assays | Enable simultaneous detection of multiple mRNA transcripts at cellular resolution. | Mapping co-expression of Oxtr, Drd1, and Drd2 in vole nucleus accumbens [81]. |
| Radiolabeled Ligands (e.g., [³H]8-OH-DPAT) | Selective binding and quantification of specific receptor populations. | Quantifying 5-HT1A receptor density via in vitro autoradiography [80]. |
| Calcium-Binding Protein Antibodies | Mark subpopulations of interneurons and principal neurons. | Defining hippocampal subfields and cell types in bats via IHC [82]. |
| Specific ELISA Kits | Quantify protein levels of potential biomarkers in biological fluids. | Measuring serum endostatin and GDF-10 in stroke patients [5]. |
| Low-Field MRI Scanners (<0.1 T) | Provide a cost-effective and portable alternative for neuroimaging in low-resource settings. | Acquiring structural brain data in LMIC pediatric cohorts [84]. |
| Image Analysis Software (e.g., FreeSurfer, FastSurfer) | Process structural MRI data for cortical reconstruction and analysis. | Extracting vertex-level measures of cortical volume and thickness [84]. |
The validation of biomarkers across species represents a fundamental challenge in neuroscience research, particularly in the development of novel therapeutic strategies. Methodological disparities in measurement techniques between animal models and human subjects can significantly impact the translational value of preclinical findings. This guide objectively compares experimental protocols and outcomes for key neuroplasticity markers, focusing on two specific electrophysiological measurements: the Nasal Potential Difference (nPD) test in cystic fibrosis research and Visually Evoked Potential (VEP) plasticity paradigms in neuropsychiatry. Understanding these technical variations is crucial for researchers aiming to bridge animal and human measurement techniques in the validation of neuroplasticity markers.
Case Study 1: Nasal Potential Difference (nPD) Testing
The nPD test is an electrophysiological measurement that assesses the function of the CFTR channel in cystic fibrosis (CF) research, serving as a benchmark for evaluating cross-species methodological consistency [85].
Experimental Protocols and Methodological Variations
nPD measurements are performed in both humans and animal models using similar fundamental principles but with notable procedural variations that affect outcomes. The core methodology involves placing a exploring electrode on the nasal epithelium and a reference electrode on the skin or subcutaneous tissue to measure the transepithelial voltage [85].
Human nPD Protocol: Human studies typically employ standardized operating procedures with perfusion systems that flow different buffers over the epithelium to assess CFTR function. Key measurements include baseline nPD, response to amiloride (an epithelial sodium channel blocker), and response to a low-chloride solution with isoproterenol (to stimulate CFTR function) [85].
Animal nPD Protocol: Animal studies use similar measurement principles but face unique challenges related to anatomical scale, anesthesia requirements, and electrode placement. Reporting of experimental details in animal studies is often poor, making reproducibility difficult within and between species [85].
A systematic review revealed substantial variation in experimental design across laboratories, including differences in: perfusion rates and durations, specific buffers and pharmacological agents used, electrode types and placement techniques, and anesthesia protocols for animal studies [85].
Quantitative Data Comparison: nPD Values Across Species
Table 1: Comparison of Baseline nPD Measurements Between CF and Control Subjects
| Subject Group | Species | Baseline nPD (mV) | Low Chloride nPD (mV) | Data Source |
|---|---|---|---|---|
| CF Patients | Human | Higher absolute values | Significantly altered | [85] |
| Control Subjects | Human | Lower absolute values | Normal response | [85] |
| CF Models | Animal | Lower average values | Significantly altered | [85] |
| Control Animals | Animal | Lower average values | Normal response | [85] |
The systematic review confirmed a clear difference in baseline nPD values between CF and control subjects in both animals and humans. However, baseline nPD values were, on average, lower in animal studies than in human studies, highlighting a fundamental methodological disparity [85].
Case Study 2: Visually Evoked Potential (VEP) Plasticity Paradigms
VEP-based biomarkers are promising non-invasive tools for assessing neuroplasticity in the human visual cortex, with translational potential for psychiatric and neurological disorders [74].
Experimental Protocols for VEP Plasticity Induction
EEG recordings of VEPs provide a non-invasive method for assessing stimulus-selective response plasticity (SRP) in the human visual cortex, resembling canonical long-term potentiation (LTP) protocols from brain slice experiments [74].
General Experimental Setup: Participants are seated at a fixed distance from a visual display. Checkerboard reversal stimuli are used to evoke VEPs, with individual checkers subtending a visual angle of 0.5°. Baseline VEPs are recorded, followed by a modulation phase of intense visual stimulation, after which changes from baseline are quantified to measure plastic effects over time [74].
Modulation Protocol Variations: Research systematically compared four distinct VEP modulation protocols in human subjects [74]:
- Low-frequency stimulation (LFS): Single 10-minute block at 2 reversals per second (rps)
- Repeated low-frequency stimulation (repeated LFS): Multiple sessions of LFS
- High-frequency stimulation (HFS): Short, high-frequency tetanic stimulation (~9 Hz)
- Theta-pulse stimulation (TPS): Pulsed application at theta frequency
Quantitative Data Comparison: VEP Plasticity Duration and Magnitude
Table 2: VEP Plasticity Parameters Across Stimulation Protocols in Humans
| Stimulation Protocol | Plasticity Time Course | Peak Effect | Duration of Effect | Key Characteristics |
|---|---|---|---|---|
| Low-frequency (LFS) | Transient | 2 minutes | <12 minutes | Rapid onset, brief |
| Repeated LFS | Sustained | Gradual | Up to 22 minutes | More persistent effects |
| High-frequency (HFS) | Sharp, brief | Immediate | Short-lived | Strong but transient |
| Theta-pulse (TPS) | Moderate, prolonged | Gradual | Up to 28 minutes | Long-lasting plasticity |
The frequency and pattern of stimulation critically determine the direction, magnitude, and duration of plastic responses, with theta-pulse stimulation showing the most prolonged effects lasting up to 28 minutes post-modulation [74].
Visualization of Experimental Workflows
nPD Testing Methodology
Cross-Species nPD Testing - This diagram illustrates the standardized workflow for nasal potential difference testing, highlighting procedural steps common to both human and animal studies while acknowledging species-specific methodological adaptations.
VEP Plasticity Assessment
VEP Plasticity Protocol - This workflow details the standardized assessment of visual cortical plasticity through evoked potentials, showing the progression from baseline recording through modulation to post-stimulation measurement.
The Scientist's Toolkit: Essential Research Reagents and Materials
Table 3: Key Research Reagents and Materials for Cross-Species Electrophysiological Measurements
| Item | Function/Application | Species Utility | Technical Notes |
|---|---|---|---|
| Electroencephalography (EEG) System | Records visually evoked potentials from visual cortex | Human & Animal | High temporal resolution required for VEP measurements [74] |
| Nasal Potential Difference Electrodes | Measures transepithelial voltage in nasal epithelium | Human & Animal | Exploring and reference electrodes required; placement varies by species [85] |
| Checkerboard Stimulus System | Generates visual stimuli for VEP induction | Human & Animal | Specific parameters: 0.5° visual angle, 2 reversals per second [74] |
| Perfusion System for nPD | Administers buffers and pharmacological agents | Human & Animal | Flow rates and durations vary significantly between laboratories [85] |
| Amiloride | Epithelial sodium channel blocker for nPD | Human & Animal | Standard concentration: 100μM; part of diagnostic protocol [85] |
| Low-chloride Solution | Activates chloride transport in nPD testing | Human & Animal | Used with isoproterenol/forskolin to assess CFTR function [85] |
| Pharmacological Agents (Isoproterenol/Forskolin) | Stimulates CFTR channel opening in nPD | Human & Animal | Final step in nPD protocol to evaluate residual CFTR function [85] |
Analysis of Methodological Disparities and Translational Gaps
The comparison of these two established measurement techniques reveals several consistent themes in cross-species methodological disparities. In both nPD and VEP paradigms, procedural variations significantly impact outcomes and interpretation. For nPD, differences in baseline values between species highlight fundamental physiological or technical disparities that must be accounted for in translational research [85]. For VEP plasticity, the duration and magnitude of effects are highly protocol-dependent, with different stimulation patterns producing markedly different plasticity time courses [74].
A critical finding across both measurement techniques is the poor reporting of experimental details in both animal and human studies, which substantially hampers reproducibility and cross-species comparison [85]. Standardization of protocols and comprehensive reporting of methodological parameters are essential for improving the translational value of preclinical research.
These methodological disparities have direct implications for drug development, particularly in the validation of neuroplasticity markers and CFTR modulators. Understanding protocol-specific effects allows researchers to select optimal induction paradigms for assessing therapeutic interventions—for example, choosing longer-lasting VEP protocols when targeting sustained plasticity outcomes [74].
Distinguishing Adaptive from Maladaptive Plasticity in Disease States
Neuroplasticity, the nervous system's capacity to adapt its functional and structural organization in response to experience, represents a fundamental property with profound implications for health and disease [86]. While this plasticity has evolved to facilitate adaptation, the very same mechanisms can, under certain conditions, produce maladaptive changes that disrupt normal function and contribute to pathology [86]. Understanding the precise distinction between adaptive and maladaptive plasticity is particularly crucial in translational neuroscience, where cross-species validation of neuroplasticity markers enables researchers to bridge molecular mechanisms with systems-level cognitive and behavioral outcomes [44]. This guide provides a comparative framework for distinguishing these plasticity states across disease contexts, with emphasis on experimental approaches, biomarker validation, and therapeutic implications for researchers and drug development professionals.
Conceptual Framework and Key Distinctions
The dichotomy between adaptive and maladaptive plasticity hinges on functional outcome rather than underlying mechanism. Adaptive plasticity denotes beneficial reorganization that supports recovery, learning, or compensation after injury or environmental challenge. In contrast, maladaptive plasticity refers to reorganization that produces pathological outcomes, functional impairments, or sustains disease states [86]. This distinction is observable across multiple neurological and psychiatric conditions, where similar initial mechanisms diverge in their long-term consequences.
The transition from adaptive to maladaptive plasticity often involves a critical shift in timing, intensity, or context of the plastic response. For instance, immediate synaptic strengthening following injury may initially facilitate compensation, but when sustained indefinitely, can lead to network dysfunction and chronic pain [87]. Similarly, structural changes that enhance learning and memory in healthy states may contribute to pathological fear conditioning when improperly regulated [44].
Comparative Analysis Across Disease States
Table 1: Characteristics of Adaptive vs. Maladaptive Plasticity Across Conditions
| Disease Context | Adaptive Plasticity Manifestations | Maladaptive Plasticity Manifestations | Key Distinguishing Features |
|---|---|---|---|
| Chronic Stress & Depression | Enhanced prefrontal regulation of emotional circuits; appropriate coping strategies | Prefrontal dendritic retraction [88]; spine loss [88]; impaired LTP [88]; excessive glutamate signaling [88] | Executive function preservation vs. impairment; synaptic strengthening vs. weakening in PFC |
| Neuropathic Pain | Appropriate nociceptive sensitivity during healing; protective avoidance | Central sensitization [87]; allodynia [89] [87]; hyperalgesia [89] [87]; cortical reorganization [87] | Protective vs. persistent pain; normal vs. expanded receptive fields |
| Psychostimulant Addiction | Normal reward learning; appropriate motivation for natural rewards | Structural changes in mesolimbic circuits [90]; hypofrontality [90]; sensitization [90] | Controlled vs. compulsive drug-seeking; balanced vs. impaired behavioral control |
| Fear & Anxiety Disorders | Appropriate fear extinction; adaptive threat response | Impaired fear extinction [44]; altered fronto-amygdalar circuitry [44]; sustained hypervigilance | Flexible vs. rigid fear responses; appropriate vs. generalized threat detection |
Cross-Species Validation Approaches
Cross-species research provides a powerful framework for validating neuroplasticity markers by combining complementary methodologies across experimental animals and humans [44]. This integrated approach bridges scales of analysis, from molecular mechanisms to systems-level network dynamics, while establishing translatability of findings.
Experimental Protocols for Cross-Species Investigation
Fear Extinction Paradigm (Rodent-Human Translation)
- Purpose: Assess fear learning and extinction across species to investigate genetic and developmental influences on emotional memory [44].
- Rodent Protocol: Subjects undergo fear conditioning where a neutral cue is paired with a mild footshock. Extinction training involves repeated presentations of the cue without shock. Freezing behavior is quantified as fear index. Electrophysiological recordings from ventromedial prefrontal cortex (vmPFC) slices measure excitatory postsynaptic currents (EPSCs), AMPA/NMDA receptor ratios, and cFos immunohistochemistry [44].
- Human Protocol: Conditioning with neutral cue paired with mild wrist shock. Extinction training with cue presentations without shock. Galvanic skin conductance response (SCR) measured as fear index. Functional MRI assesses vmPFC and amygdala activation during extinction recall [44].
- Cross-Species Validation: Parallel behavioral phenotypes (impaired extinction in adolescents and BDNF Met allele carriers) with convergent neurophysiological evidence of altered fronto-amygdalar circuitry [44].
Chronic Stress Model (Structural Plasticity Assessment)
- Purpose: Investigate stress-induced prefrontal cortical changes relevant to depression [88].
- Rodent Protocol: Chronic unpredictable stress or restraint stress over 2-6 weeks. Brain tissue analyzed for dendritic arborization (Golgi staining), spine density (electron microscopy), and synaptic protein expression (western blot) [88].
- Human Correlation: Post-mortem prefrontal cortex analysis from depressed patients; MRI cortical thickness and connectivity studies in living subjects with stress-related disorders [88].
- Molecular Analysis: Multi-scale assessment of functional reorganization, intrinsic neuronal excitability, and structural/synaptic plasticity with emphasis on glutamatergic pyramidal neurons [88].
Signaling Pathways and Molecular Mechanisms
Table 2: Key Molecular Mediators of Plasticity States
| Molecular Mediator | Role in Adaptive Plasticity | Role in Maladaptive Plasticity | Therapeutic Targeting Potential |
|---|---|---|---|
| BDNF | Supports synaptic strengthening [44]; promotes learning and memory [44] | Met allele associated with impaired fear extinction [44]; altered fronto-amygdalar circuitry [44] | High (e.g., enhancing BDNF signaling for cognitive improvement) |
| Glutamate NMDA Receptors | Enables LTP [90]; supports learning [90] | Mediates excitotoxicity [88]; central sensitization in pain [87] | Medium (NMDA antagonists for pain, but narrow therapeutic window) |
| DeltaFosB | Regulates natural reward responses | Accumulates with chronic drug exposure [90]; promotes persistent synaptic changes [90] | Medium (gene therapy approaches in development) |
| Pro-inflammatory Cytokines | Supports tissue repair; acute immune signaling | Sustained neuroinflammation [90]; impaired neurogenesis [91] | High (anti-inflammatory approaches for multiple disorders) |
The following diagram illustrates key signaling pathways involved in maladaptive plasticity, particularly in stress-related disorders and chronic pain:
The Scientist's Toolkit: Research Reagent Solutions
Table 3: Essential Research Tools for Neuroplasticity Investigation
| Research Tool | Specific Application | Function in Plasticity Research | Example Use Cases |
|---|---|---|---|
| IHC Validated Antibodies (Apaf-1, DGK-ζ, Bcl-2, Aβ, NF200) [92] | Cetacean and cross-species CNS pathology | Marker validation for apoptotic, neuroinflammatory and structural aberrations [92] | Systematic validation approach for comparative neuropathology [92] |
| Lentiviral CB1R siRNA | Gene silencing in reward pathways [90] | Investigate endocannabinoid role in psychostimulant sensitization [90] | Motor activation studies in addiction models [90] |
| D-serine & Glycine Site Modulators | NMDA receptor regulation [90] | Probe co-agonist role in initiation of locomotor sensitization [90] | Ventral tegmental area microinjection studies [90] |
| CaMKII Inhibitors | Intracellular signaling manipulation [90] | Assess calcium/calmodulin role in synaptic plasticity [90] | Behavioral sensitization studies [90] |
| Bioluminescent Optogenetics | Neural circuit manipulation [91] | Precisely modulate activity-dependent plasticity [91] | Circuit-specific therapeutic interventions [91] |
| High-Content Screening Models | Drug discovery for neuroplasticity [93] | Quantify structural and functional changes at scale [93] | Prioritizing molecules in drug discovery [93] |
Methodological Workflow for Plasticity Assessment
The following diagram outlines an integrated experimental approach for distinguishing adaptive versus maladaptive plasticity in cross-species research:
Diagnostic and Therapeutic Implications
The strategic distinction between adaptive and maladaptive plasticity directly informs diagnostic biomarker development and therapeutic targeting. Maladaptive plasticity often manifests as self-sustaining pathological states that persist beyond the initial insult, creating opportunities for interventions that specifically target the maladaptive processes without disrupting adaptive plasticity [89] [87].
Non-invasive brain stimulation (NIBS) techniques exemplify this therapeutic approach by attempting to revert maladaptive plasticity in conditions such as neuropathic pain [87]. The mechanistic rationale involves NIBS-induced modulation of synaptic plasticity through changes in glutamate receptor thresholds, kinetics, and trafficking, ultimately normalizing the excitability of nociceptive neurons [87]. Similar approaches show promise for redirecting maladaptive plasticity in addiction, where interventions targeting the paradoxical findings of pyramidal neuron excitability—ranging from hyper- to hypoactivity—might rebalance prefrontal control over reward circuits [88] [90].
Emerging biomarker approaches focus on structural hippocampal indicators that demonstrate criterion, construct, and content validity as indicators of cumulative affective experience in mammals [94]. Such biomarkers provide objective measures of lifetime experience quality, enabling researchers to track plasticity trajectories across the adaptive-maladaptive spectrum and assess therapeutic efficacy at the neural systems level.
Distinguishing adaptive from maladaptive plasticity requires integrated multi-scale assessment across molecular, cellular, systems, and behavioral levels. The cross-species validation framework provides a powerful approach for establishing translatable biomarkers and mechanistic insights. As research progresses, the strategic targeting of maladaptive plasticity processes while preserving adaptive capacity represents a promising therapeutic frontier for numerous neurological and psychiatric conditions. The experimental tools and comparative approaches outlined in this guide provide a foundation for advancing this crucial distinction in both basic research and drug development contexts.
Accounting for Age, Sex, and Environmental Influences on Plasticity
The validation of neuroplasticity markers across species represents a critical frontier in translational neuroscience, directly impacting the development of novel therapeutic strategies for neurological and psychiatric disorders. Neuroplasticity—the brain's dynamic capacity to reorganize its structure and function in response to experience—varies significantly based on age, sex, and environmental factors [44]. Understanding how these factors influence plasticity mechanisms across different species is essential for bridging the gap between animal models and human clinical applications. Cross-species research integrates complementary methodologies, from genetic and molecular analyses in animals to non-invasive neuroimaging in humans, to establish robust biomarkers that account for these influential variables [44] [95]. This comparative approach enables researchers to distinguish conserved mechanisms from species-specific adaptations, ultimately strengthening the predictive validity of preclinical models and accelerating the development of targeted interventions for conditions ranging from stroke to anxiety disorders.
Comparative Analysis of Key Influential Factors on Neuroplasticity
The following tables synthesize experimental data and quantitative findings from cross-species research, highlighting how age, sex, and environmental factors distinctly influence neuroplasticity markers.
Table 1: Influence of Age and Sex on Neuroplasticity Markers and Outcomes
| Factor | Species | Key Findings/Mechanisms | Measured Outcome | Experimental Evidence |
|---|---|---|---|---|
| Age: Development (Adolescence) | Mice & Humans | Attenuated fear extinction; reduced vmPFC synaptic plasticity & glutamatergic transmission [44] | Freezing behavior (mice); SCR (humans); vmPFC EPSCs, AMPA/NMDA ratios [44] | Electrophysiology (mice slices); fear conditioning paradigm [44] |
| Age: Lifespan & Neurogenesis | Multiple Mammals | Remarkable interspecies variation in neurogenic plasticity; rates drop early in large-brained mammals vs. mice [3] | Quantity & distribution of immature neurons (e.g., doublecortin+) [3] | Comparative immunocytochemistry across species [3] |
| Sex: Genetic/Epigenetic | Humans | Sex-specific heritability of DNA methylation at thousands of sites; hormonal and epigenetic interactions [96] [97] | DNA methylation levels at CpG sites; heritability estimates (h²) [96] | Twin studies & genome-wide methylation arrays [96] |
| Sex: Environmental Toxins | Mice & Humans | Age-dependent sex differences in PM2.5-induced cognitive impairment; epigenetic regulation proposed mechanism [97] | Learning, memory, social interaction behaviors; histone modifications, miRNA [97] | Air pollution exposure models; cognitive testing; epigenetic analyses [97] |
Table 2: Environmental Influences and Intervention-Induced Plasticity
| Factor | Species | Key Findings/Mechanisms | Measured Outcome | Experimental Evidence |
|---|---|---|---|---|
| Environment: Socioeconomic Status (SES) | Humans | Lower childhood SES → accelerated brain maturation; higher SES → protracted development & more efficient cortical networks [98] | Cortical thickness; functional network segregation; prefrontal-amygdala connectivity [98] | Structural & functional MRI; longitudinal developmental studies [98] |
| Environment: Chronic Stress | Humans | Hypothesized to accelerate brain maturation, contrasting with novel positive experiences [98] | Pace of brain development; neural circuit refinement [98] | Neuroimaging data integrated with theoretical models [98] |
| Intervention: VR & BCI | Humans (Clinical) | VR provides controlled, immersive stimuli; BCI allows real-time neural feedback, promoting targeted plasticity [99] | Motor recovery post-stroke; reduced anxiety/phobia symptoms; improved attention & memory [99] | Clinical trials using VR/BCI-integrated rehabilitation & therapy [99] |
| Intervention: Herbal Medicine (MDP) | Rats (CCH Model) | Upregulated GAP-43 mRNA, VEGF mRNA, SYP, PSD-95; improved neurogenesis, synaptogenesis, angiogenesis [100] | MWM performance; synapse ultrastructure; protein/gene expression [100] | BCCAO model; MWM test; RT-PCR; immunohistochemistry [100] |
Detailed Experimental Protocols for Key Studies
Cross-Species Fear Extinction and BDNF Met Allele
- Objective: To investigate the role of the BDNF Met allele in impairing fear extinction across species and link behavior to fronto-amygdalar circuitry [44].
- Subjects: Genetically modified mice (BDNF Met allele carriers) and human volunteers (BDNF Met allele carriers) [44].
- Fear Conditioning Paradigm:
- Acquisition: A neutral conditioned stimulus (CS - tone or light) is paired with an aversive unconditioned stimulus (US - mild footshock for mice, mild wrist shock for humans).
- Extinction: The CS is repeatedly presented without the US.
- Behavioral Measures:
- Mice: Percentage of time spent freezing during CS presentation.
- Humans: Galvanic skin conductance response (SCR) to CS.
- Neural Circuitry Analysis:
- Humans: fMRI to measure activation in the ventromedial prefrontal cortex (vmPFC) and amygdala during extinction.
- Mice (Follow-up): In vitro electrophysiology on brain slices to record excitatory postsynaptic currents (EPSCs) and AMPA/NMDA receptor ratios in vmPFC pyramidal neurons. Immunohistochemistry for cFos as a neural activity marker [44].
- Key Variables: Genotype (BDNF Val/Val vs. Met carriers); species; extinction trial phase (early vs. late).
Chronic Cerebral Hypoperfusion (CCH) and Herbal Intervention
- Objective: To explore the effects of Modified Dioscorea Pills (MDP) on neuroplasticity (neurogenesis, angiogenesis, synaptogenesis) in a rat CCH model [100].
- Animals: Male Sprague-Dawley rats.
- CCH Model Induction: Two-step bilateral common carotid arteries occlusion (BCCAO) performed one week apart [100].
- Experimental Groups:
- Sham-operated group (surgery without occlusion).
- Model group (BCCAO + saline gavage).
- MDP group (BCCAO + MDP condensed decoction gavage at 10g·kg⁻¹·d⁻¹ for 45 days).
- Assessment Methods:
- Behavior: Morris Water Maze (MWM) test for spatial learning and memory.
- Morphology: Pathological observation of hippocampus CA1 zone; ultrastructural study of synapses via electron microscopy.
- Molecular Biology:
- RT-PCR for GAP-43 mRNA and VEGF mRNA expression.
- Immunohistochemistry for synaptic proteins (SYP, PSD-95, MAP-2) and Micro Vessel Density (MVD) count [100].
DNA Methylation and Twin Heritability Study
- Objective: To estimate the heritability of DNA methylation levels and quantify the impact of genetic vs. environmental influences, including interactions with sex and age [96].
- Cohort: 2,603 individuals from twin families (monozygotic and dizygotic twins, parents, siblings).
- Data Collection:
- DNA Methylation: Genome-wide analysis using Illumina 450k array on whole blood samples.
- Genotyping: SNP data for all participants.
- Statistical Modeling:
- Normalization and adjustment of methylation data for covariates (sex, age, white blood cell counts, genotype PCs, technical batch effects).
- Classical ACE/ADE Twin Modeling: Variance components analysis to partition influences into Additive genetics (A), Common environment (C), Unique environment (E), and Non-additive genetics (D).
- Interaction Models: Testing for sex-specific heritability and age-related changes in environmental variance [96].
Signaling Pathways and Experimental Workflows
Integrative Cross-Species Research Framework
BDNF-Mediated Fear Extinction Pathway
The Scientist's Toolkit: Research Reagent Solutions
Table 3: Essential Reagents and Tools for Cross-Species Neuroplasticity Research
| Item | Function/Application | Example Use Case in Context |
|---|---|---|
| BDNF Genotyping Assays | Identify carriers of BDNF Val66Met and other plasticity-relevant polymorphisms [44]. | Stratifying human subjects or generating animal models for fear extinction studies [44]. |
| Antibodies for Synaptic Proteins | Label and quantify key structural elements of neuroplasticity (e.g., SYP, PSD-95, MAP-2) [100]. | Immunohistochemistry in rat brain tissue to measure synaptogenesis after MDP treatment in CCH [100]. |
| DNA Methylation Arrays | Profile genome-wide epigenetic marks (e.g., Illumina EPIC/450k) to assess environmental and genetic influences [96]. | Twin studies to dissect heritable vs. environmental variance in methylation [96]. |
| ELISA Kits for Serum Biomarkers | Quantify circulating proteins related to plasticity and repair (e.g., GDF-10, Endostatin, suPAR) [101]. | Monitoring patient recovery and response to rehabilitation post-stroke [101]. |
| Morris Water Maze Apparatus | Standardized test for assessing spatial learning and memory in rodent models [100]. | Evaluating cognitive deficits in CCH model rats and efficacy of MDP intervention [100]. |
| Virtual Reality (VR) & BCI Platforms | Create immersive environments for training/rehabilitation and provide real-time neural feedback [99]. | Post-stroke motor rehabilitation; exposure therapy for anxiety disorders [99]. |
| Oligodendrocyte Progenitor Cell (OPC) Markers | Identify dividing glial populations (e.g., Olig2, PDGFαR, NG2) to avoid confounding in neurogenesis studies [3]. | Accurately quantifying cell proliferation in adult brain parenchyma across species [3]. |
Standardization and Reproducibility in Multi-Species Studies
The credibility of preclinical research faces a significant challenge, with surveys indicating that over 90% of researchers believe science currently faces a 'reproducibility crisis' [102]. This crisis is particularly pronounced in animal research, where despite rigorous standardization of genetic and environmental conditions, results frequently fail to replicate across laboratories [103]. This article examines the critical limitations of highly standardized single-laboratory studies and explores innovative experimental designs that enhance reproducibility through systematic heterogenization. Within the specific context of validating neuroplasticity markers across species, we compare conventional and novel approaches, providing quantitative data, detailed methodologies, and practical toolkits to guide researchers in designing more reliable multi-species investigations.
The Problem: Excessive Standardization Undermines Reproducibility
The Paradox of Standardization
In preclinical research, single-laboratory studies conducted under highly standardized conditions are traditionally considered the gold standard for minimizing variability [103]. Genetic standardization of animals and environmental standardization of housing and husbandry are explicitly recommended by laboratory animal science textbooks to guarantee both precision and reproducibility [103]. However, accumulating evidence demonstrates that this rigorous standardization may generate spurious results that are idiosyncratic to the specific conditions under which they were obtained.
The fundamental problem lies in the biological reality of phenotypic plasticity. An animal's response to an experimental treatment depends on its phenotypic state, which is a product of genotype-by-environment (G × E) interactions [103]. While laboratory animal scientists consider natural biological variation a nuisance to eliminate through standardization, this variation represents the true biological reality. When laboratories differ in environmental factors that affect animal phenotype (e.g., noise, odors, microbiota, or personnel), animals will always differ between laboratories due to G × E interactions [103]. The variation of phenotypes between laboratories is generally much larger than the variation within laboratories, meaning that replication studies inevitably test distinct samples of phenotypes.
Empirical Evidence of the Standardization Problem
A landmark study by Crabbe et al. first brought this problem to scientific attention, investigating confounding effects of laboratory environment and G × E interactions on behavioral strain differences in mice [103]. Despite rigorous standardization across three laboratories, systematic differences were found between laboratories, as well as significant interactions between genotype and laboratory.
Simulation studies based on 440 preclinical studies across 13 different interventions in animal models of stroke, myocardial infarction, and breast cancer have quantified this problem [103]. When simulating single-laboratory studies with typical sample sizes (12 animals per treatment group, N=24), the confidence interval captured the true effect size in only 47.9% of cases (coverage probability = 0.48) [103]. Furthermore, inferential tests failed to find a significant effect in 17.6% of cases (false negative rate = 0.18), despite sufficient statistical power (>0.8) to detect treatment effects.
Solution Approaches: Enhancing Reproducibility Through Heterogenization
Multi-Laboratory Designs
The most direct approach to account for between-laboratory variation is implementing multi-laboratory study designs, which are common in clinical Phase III trials but rare in preclinical animal research [103]. Simulations demonstrate that including just 2-4 laboratories in study designs substantially improves reproducibility without increasing total sample size [103].
Table 1: Comparison of Single vs. Multi-Laboratory Study Performance
| Number of Laboratories | Coverage Probability (pc) | False Negative Rate (FNR) | Sample Size (N) |
|---|---|---|---|
| 1 | 0.48 | 0.18 | 24 |
| 2 | 0.73 | 0.14 | 24 |
| 3 | 0.83 | 0.13 | 24 |
| 4 | 0.87 | 0.13 | 24 |
As shown in Table 1, multi-laboratory designs dramatically increase coverage probability—the likelihood that a study's confidence interval contains the true effect size—by up to 42 percentage points [103]. This improvement results from increased accuracy and reduced variation between effect size estimates, enhancing both internal and external validity.
Mini-Experiment Designs: Heterogenization Within a Single Laboratory
While multi-laboratory studies improve reproducibility, they present logistical challenges that limit widespread adoption. To address this limitation, researchers have developed "mini-experiment" designs that transfer the logic of multi-laboratory approaches into single-laboratory settings [102].
This systematic heterogenization strategy involves splitting a study population into several 'mini-experiments' spread over different time points throughout the year [102]. Rather than testing all animals simultaneously under identical conditions, researchers distribute data collection across multiple batches, allowing natural environmental variations (e.g., temperature, personnel, noise levels) to introduce controlled heterogeneity.
Experimental validation demonstrates that this mini-experiment design improves reproducibility of strain differences in behavioral and physiological measures in approximately half of all investigated comparisons [102]. The design maintains the same total sample size as conventional approaches but systematically varies testing times to enhance representativeness.
Figure 1: Mini-Experiment vs. Conventional Study Design Approach
Case Study: Validation of Neuroplasticity Markers Across Species
Biomarkers of Angiogenesis and Neuroplasticity
In stroke research, biomarkers of angiogenesis and neuroplasticity provide a compelling case for examining cross-species validation challenges. Key biomarkers include:
VEGF-A (Vascular Endothelial Growth Factor A): A protein that regulates and induces angiogenesis in various pathological conditions [104]. In ischemic stroke, VEGF-A gene expression is upregulated due to hypoxia, and synthesized protein binds to VEGFR-2, a major mediator of angiogenesis, mitogenesis, and enhanced permeability [104].
GDF-10 (Growth and Differentiation Factor 10): A secreted growth factor that promotes axonal outgrowth through TGFβ receptor signaling [5]. It is upregulated in the brain after ischemia and enhances axonal sprouting in the peri-infarct cortex, improving motor recovery after stroke [5].
Endostatin: A proteolytic fragment of Collagen XVIII that initially was described as an angiogenesis inhibitor but also affects matrix remodeling and neurogenesis mechanisms crucial during brain repair [5]. Increased plasma levels in the acute phase of ischemic stroke are associated with an increased risk of death or severe disability [5].
uPA/uPAR (urokinase-type plasminogen activator and receptor): A system that promotes neurological recovery related to reorganization of the actin cytoskeleton and neurite remodeling in the peri-infarct region [5]. Neurons release uPA, and astrocytes recruit uPAR during recovery from hypoxic injury, promoting astrocytic activation and synaptic recovery [5].
Experimental Protocol for Biomarker Validation
A recent multicenter study provides a robust protocol for validating neuroplasticity biomarkers during stroke rehabilitation [5]:
Study Design: Observational, prospective, multicenter study with 62 stroke patients and 43 control subjects.
Inclusion Criteria: Age ≤75 years, stable medical condition, first-ever ischemic or hemorrhagic stroke, modified Rankin scale (mRS) score ≤2 before stroke, and post-stroke mRS score ranging from 3-5.
Assessment Timeline: Baseline (pre-rehabilitation), 1 month, 3 months, and 6 months after rehabilitation initiation.
Functional Assessment Scales:
- Modified Rankin Scale (mRS)
- Barthel Index (BI)
- Fugl-Meyer Assessment for upper extremity (FMA)
- Functional Ambulation Categories (FAC)
- Chedoke Arm and Hand Activity Inventory (CAHAI)
- 10-meter walk test
- Medical Research Council scale (MRC)
Blood Sampling and Analysis: Serum levels determined by Enzyme-Linked Immunosorbent Assay (ELISA) at each assessment point.
Statistical Analysis: Mixed linear models to investigate prognostic value, accounting for repeated measures and multiple testing.
Table 2: Key Neuroplasticity Biomarkers and Their Functional Roles
| Biomarker | Full Name | Primary Function | Association with Recovery |
|---|---|---|---|
| VEGF-A | Vascular Endothelial Growth Factor A | Angiogenesis regulation, endothelial cell proliferation | Elevated in ischemia; stimulates angiogenesis and vascular permeability |
| GDF-10 | Growth and Differentiation Factor 10 | Axonal outgrowth promotion via TGFβ signaling | Higher baseline values relate to unfavorable outcomes; changes during rehabilitation correlate with improvement |
| Endostatin | Proteolytic fragment of Collagen XVIII | Inhibition of angiogenesis, matrix remodeling, neurogenesis | Increased in acute phase predicts poor outcome; decrease during rehabilitation correlates with improvement |
| uPA/uPAR | Urokinase-type plasminogen activator/receptor | Extracellular matrix proteolysis, neurite remodeling | Promotes neurological recovery; highest baseline uPAR relates to unfavorable scores |
Cross-Species Validation Workflow
The translation of biomarkers from animal models to human applications requires systematic validation across species. The following workflow outlines key steps in this process:
Figure 2: Cross-Species Biomarker Validation Workflow
The Scientist's Toolkit: Research Reagent Solutions
Table 3: Essential Research Reagents for Neuroplasticity Biomarker Studies
| Reagent/Resource | Function/Specificity | Example Application |
|---|---|---|
| VEGF-A ELISA Kit | Quantifies VEGF-A protein concentration in serum/plasma | Measuring angiogenic response in stroke models |
| GDF-10 Antibodies | Detects GDF-10 expression in tissue sections or Western blots | Assessing axonal outgrowth promotion in peri-infarct cortex |
| Endostatin ELISA | Measures endostatin levels in biological samples | Evaluating matrix remodeling and neurogenesis inhibition |
| uPAR Immunoassay | Quantifies soluble uPAR in serum | Monitoring proteolytic system activation during recovery |
| Multiplex Assay Panels | Simultaneously measures multiple neuroplasticity biomarkers | Comprehensive biomarker profiling in limited sample volumes |
| Primary Neuronal Cultures | In vitro system for mechanistic studies | Testing direct effects of biomarkers on neurite outgrowth |
| Animal Stroke Models | Preclinical testing platform (e.g., MCAO model) | Evaluating biomarker dynamics in controlled settings |
The reproducibility crisis in preclinical research necessitates fundamental methodological changes. While conventional highly standardized approaches remain common, evidence demonstrates that systematic heterogenization through multi-laboratory or mini-experiment designs significantly enhances reproducibility without increasing sample sizes. In the validation of neuroplasticity markers across species, incorporating biological variation through controlled heterogenization provides more generalizable and clinically relevant results. By adopting these innovative experimental designs and implementing rigorous cross-species validation workflows, researchers can substantially improve the translational potential of preclinical findings in neurology and drug development.
Integrating Multi-Omics Data for Comprehensive Biomarker Validation
The integration of multi-omics data has revolutionized biomarker discovery by enabling a comprehensive analysis of complex biological systems across multiple molecular layers. This approach leverages high-throughput technologies to measure diverse omics features within their biological context, creating heterogeneous datasets that provide unprecedented insights into disease mechanisms [105] [106]. The strategic power of multi-omics integration lies in its ability to systematically combine genomic, transcriptomic, proteomic, epigenomic, and metabolomic data to construct a clinically relevant understanding of disease biology, particularly for complex conditions such as neurodegenerative disorders and cancer [107] [108].
For researchers focused on validating neuroplasticity markers across species, multi-omics integration offers a powerful framework for identifying robust, translatable biomarkers. This approach helps overcome the limitations of single-omics studies, which often fail to capture the full spectrum of biological processes underlying complex neurological functions and disease states [109] [107]. The integrated analysis of multiple molecular layers enables the characterization of molecular signatures that drive fundamental biological processes, including neuroplasticity, and supports the development of precision medicine strategies tailored to individual patient profiles [105] [110].
Recent technological advances have further enhanced the resolution of multi-omics investigations through single-cell and spatial multi-omics technologies. These approaches provide unprecedented resolution in characterizing cellular states and activities, allowing researchers to profile multilayered molecular programs at a global scale in individual cells [111]. For neuroplasticity research, this means potentially identifying cell-type-specific markers and understanding how different neuronal populations contribute to plasticity mechanisms across species.
Comparative Analysis of Multi-Omics Integration Methods
Performance Benchmarking of Integration Approaches
Table 1: Benchmarking of Multi-Omics Integration Methods for Biomarker Discovery
| Method Category | Representative Methods | Key Strengths | Optimal Applications | Limitations |
|---|---|---|---|---|
| Vertical Integration | Seurat WNN, Multigrate, Matilda, MOFA+ | Effective dimension reduction; Strong clustering performance; Feature selection capabilities | Paired multi-modal data (RNA+ADT, RNA+ATAC); Cell type identification | Performance varies by data modality; Dataset-dependent results |
| Diagonal Integration | UnitedNet, scMM | Handles partially paired datasets; Flexible architecture | Large-scale cohort studies; Cross-species alignment | Complex implementation; Computational intensity |
| Mosaic Integration | NEMO, PINS, LRAcluster | High clinical significance; Robust to noise; Survival correlation | Cancer subtyping; Clinical biomarker identification | Requires careful parameter tuning |
| Cross Integration | iClusterBayes, Subtype-GAN, SNF | Strong clustering accuracy (silhouette scores: 0.86-0.89); Computational efficiency | Pan-cancer analysis; Therapeutic target discovery | Performance affected by data redundancy |
The benchmarking of multi-omics integration methods reveals significant performance variations across different data types and analytical tasks. A comprehensive evaluation of 40 integration methods across 64 real datasets and 22 simulated datasets demonstrated that method performance is both dataset-dependent and modality-dependent [111]. For instance, in vertical integration tasks involving paired RNA and ADT data, Seurat WNN, sciPENN, and Multigrate demonstrated generally better performance in preserving biological variation of cell types [111].
In cancer subtyping applications, iClusterBayes achieved an impressive silhouette score of 0.89 at its optimal k, followed closely by Subtype-GAN (0.87) and SNF (0.86), indicating their strong clustering capabilities [112]. Notably, NEMO and PINS demonstrated the highest clinical significance, with log-rank p-values of 0.78 and 0.79, respectively, effectively identifying meaningful cancer subtypes [112]. For robustness testing, LRAcluster emerged as the most resilient method, maintaining an average normalized mutual information (NMI) score of 0.89 even as noise levels increased, a crucial feature for real-world data applications [112].
Machine Learning Frameworks for Predictive Biomarker Discovery
Machine learning approaches have shown particular promise in predictive biomarker discovery from multi-omics data. The MILTON framework demonstrates how ensemble machine learning utilizing diverse biomarkers can predict disease states with high accuracy, largely outperforming available polygenic risk scores for many conditions [110]. When trained on 67 quantitative traits including blood biochemistry, proteomics, and clinical measures, MILTON achieved AUC ≥ 0.7 for 1,091 ICD10 codes, AUC ≥ 0.8 for 384 ICD10 codes, and AUC ≥ 0.9 for 121 ICD10 codes across all time-models and ancestries [110].
Interestingly, benchmarking studies have revealed that more data does not always equate to better outcomes. Using combinations of two or three omics types frequently outperformed configurations that included four or more types due to the introduction of increased noise and redundancy [112]. This finding has significant implications for designing efficient multi-omics studies for neuroplasticity biomarker validation, suggesting that strategic selection of complementary omics layers may be more important than comprehensive coverage of all possible molecular dimensions.
Experimental Design and Methodological Considerations
Multi-Omics Study Design Guidelines
Table 2: Evidence-Based Guidelines for Multi-Omics Study Design
| Factor Category | Specific Factor | Recommendation | Impact on Results |
|---|---|---|---|
| Computational Factors | Sample Size | Minimum 26 samples per class | Ensures statistical power and reliability |
| Feature Selection | Select <10% of omics features | Improves clustering performance by 34% | |
| Noise Characterization | Maintain noise level below 30% | Preserves biological signal integrity | |
| Class Balance | Maintain sample balance under 3:1 ratio | Prevents algorithmic bias | |
| Biological Factors | Omics Combinations | 2-3 complementary omics types | Optimizes signal-to-noise ratio |
| Clinical Feature Correlation | Incorporate molecular subtypes, stage, age | Enhances clinical relevance and translation |
Well-designed multi-omics studies require careful consideration of both computational and biological factors to ensure robust and reproducible results. Based on comprehensive benchmarking across multiple TCGA datasets, researchers have identified nine critical factors that fundamentally influence multi-omics integration outcomes [106]. These include computational aspects such as sample size, feature selection, preprocessing strategy, noise characterization, class balance, and number of classes, as well as biological factors including cancer subtype combinations, omics combinations, and clinical feature correlation [106].
Feature selection emerges as particularly crucial, with studies demonstrating that selecting less than 10% of omics features can improve clustering performance by 34% [106]. Sample size requirements indicate that a minimum of 26 samples per class is necessary to ensure statistical power, while maintaining a sample balance under a 3:1 ratio helps prevent algorithmic bias [106]. Additionally, controlling noise levels below 30% is essential for preserving biological signal integrity in multi-omics datasets.
Experimental Protocols for Multi-Omics Biomarker Validation
Comprehensive biomarker validation requires rigorous experimental protocols that bridge computational predictions with biological validation. A representative workflow from an Alzheimer's disease study demonstrates this integrated approach [109]:
Transcriptomic Analysis Protocol: Hippocampal tissue RNA is isolated using TRIzol Reagent following quality control with Agilent 5300 Bioanalyzer and NanoDrop ND-2000. Libraries are prepared from 1 µg of total RNA using the Illumina Stranded mRNA Prep, Ligation Kit. Polyadenylated mRNA is enriched using oligo(dT)-coupled magnetic beads, followed by fragmentation and first-strand cDNA synthesis with random hexamers via the SuperScript kit. After double-stranded cDNA generation, end repair, 5'-phosphorylation, and adapter ligation are performed according to manufacturer's instructions. Size selection (300 bp) is conducted on a 2% Low Range Ultra Agarose gel, and the library is amplified for 15 PCR cycles using Phusion DNA polymerase. High-throughput sequencing is performed on the NovaSeq X Plus system (PE150) with NovaSeq reagents [109].
Proteomic Analysis Protocol: Frozen samples are transferred to MP disruption tubes, lysed with protein lysis buffer, and shaken using a high-throughput tissue grinder. After centrifugation at 12,000 × g for 30 min (4°C), the clarified supernatant is collected for total protein concentration determination using a bicinchoninic acid (BCA) assay. For proteomic analysis, aliquots containing 100 µg of protein are solubilized in 100 mM triethylammonium bicarbonate (TEAB) buffer. Proteins are treated with 10 mM TCEP at 37°C for 1 h, then alkylated using 40 mM IAA in darkness at ambient temperature for 40 min. After acetone precipitation, proteins are digested with trypsin (1:50 enzyme-to-protein ratio) overnight at 37°C. Digested peptides are desalted with an HLB column, and peptide separation is performed using a Vanquish Neo chromatograph with a uPAC High Throughput column [109].
Integration and Validation: Following omics data generation, integrative analysis incorporates pathological data and protein-protein interaction networks. Differential expression results are validated through qPCR using the 2−△△Ct methodology with GAPDH as reference gene. Western blot analysis provides protein-level validation using RIPA lysis buffer for protein extraction, SDS-PAGE for separation, and PVDF membrane transfer with ECL chemiluminescence detection. α-Tubulin serves as the loading control, and band quantification is conducted using ImageJ software [109].
Multi-Omics Biomarker Validation Workflow
Essential Research Tools and Reagent Solutions
Table 3: Essential Research Reagents and Platforms for Multi-Omics Biomarker Validation
| Category | Specific Tool/Platform | Application in Biomarker Validation | Key Features |
|---|---|---|---|
| Sequencing Technologies | Illumina NovaSeq X Plus | High-throughput transcriptomics | PE150 sequencing, Stranded mRNA prep |
| Proteomic Platforms | Liquid chromatography-mass spectrometry (LC-MS) | Proteomic quantification | DIA proteomics, High-resolution separation |
| Spatial Technologies | CITE-seq, SHARE-seq, TEA-seq | Single-cell multimodal profiling | Simultaneous RNA+protein, RNA+ATAC measurement |
| Bioinformatic Tools | STRING Database, Cytoscape | PPI network analysis | Interaction confidence scoring, Network visualization |
| Cell Culture Systems | A2780, OVCAR3, Primary neuronal cultures | Functional validation | Disease-relevant models, Species comparison |
| Analytical Reagents | TRIzol Reagent, BCA assay, RIPA buffer | Sample processing and protein analysis | RNA/protein isolation, Quantification, Extraction |
The selection of appropriate research tools and platforms is critical for successful multi-omics biomarker validation. For transcriptomic analyses, the Illumina NovaSeq X Plus system with NovaSeq reagents provides high-throughput sequencing capabilities, while library preparation benefits from specialized kits such as the Illumina Stranded mRNA Prep, Ligation Kit [109]. Proteomic workflows rely on liquid chromatography-mass spectrometry (LC-MS) platforms for precise protein quantification, with sample preparation utilizing triethylammonium bicarbonate (TEAB) buffers, tris(2-carboxyethyl)phosphine (TCEP) for reduction, and iodoacetamide (IAA) for alkylation [109].
For single-cell multimodal profiling, technologies such as CITE-seq, SHARE-seq, and TEA-seq enable simultaneous measurement of multiple molecular layers from individual cells, providing unprecedented resolution for cellular heterogeneity studies [111]. These platforms are particularly valuable for neuroplasticity research, where understanding cell-type-specific responses is essential for biomarker validation across species.
Bioinformatic analysis leverages specialized tools and databases for network analysis and visualization. The STRING database facilitates protein-protein interaction analysis with minimum interaction confidence scoring, while Cytoscape enables network visualization and topological analysis to identify highly connected genes [113]. For functional validation, disease-relevant cell culture systems such as A2780 and OVCAR3 (for cancer studies) or primary neuronal cultures (for neuroplasticity research) provide essential models for testing biomarker function across different species and experimental conditions.
The integration of multi-omics data represents a transformative approach for comprehensive biomarker validation, particularly for complex research areas such as neuroplasticity markers across species. The comparative analysis presented in this guide demonstrates that method selection should be guided by specific research questions, data modalities, and validation requirements rather than seeking a universal solution. As the field continues to evolve, several emerging trends promise to further enhance multi-omics biomarker discovery.
Future developments in single-cell and spatial multi-omics technologies will provide unprecedented resolution in characterizing cellular states and activities within tissue architecture, offering new opportunities to validate neuroplasticity markers with cell-type-specific resolution [111] [107]. Similarly, advances in artificial intelligence and machine learning are poised to revolutionize how we integrate and interpret complex multi-omics datasets, enabling the identification of subtle patterns that may elude traditional analytical approaches [110] [108].
For researchers focused on neuroplasticity biomarkers across species, the strategic integration of complementary omics layers—selected based on biological relevance rather than comprehensive coverage—will likely yield the most robust and translatable validation outcomes. By adhering to evidence-based study design guidelines and implementing rigorous experimental protocols, the scientific community can accelerate the discovery and validation of biomarkers that truly capture the complexity of neuroplastic processes across model systems and human patients.
Validation Frameworks and Comparative Analysis Across Species
The pursuit of reliable biomarkers for neuroplasticity represents a critical frontier in neuroscience, with profound implications for diagnosing neurological disorders, monitoring rehabilitation progress, and developing novel therapeutics. Neuroplasticity—the nervous system's capacity to adapt its structure and function in response to experience—varies significantly across individuals and species, presenting substantial challenges for translational research. Establishing robust validation criteria for these biomarkers requires rigorous assessment of their specificity for plastic changes, reliability across measurements, and predictive value for functional outcomes. Current research leverages diverse methodological approaches, from molecular assays to neuroimaging and neurophysiological techniques, each with distinct strengths and limitations for cross-species validation. This guide provides an objective comparison of leading biomarker modalities, their experimental validation, and practical implementation for researchers and drug development professionals.
Comparative Analysis of Neuroplasticity Biomarker Modalities
The table below summarizes the key performance metrics of major neuroplasticity biomarker categories based on current validation studies.
Table 1: Comparative Performance of Neuroplasticity Biomarker Modalities
| Biomarker Category | Specific Examples | Specificity for Plasticity | Reliability Metrics | Predictive Value for Outcomes | Key Supporting Evidence |
|---|---|---|---|---|---|
| Molecular Blood Biomarkers | Endostatin, GDF-10, uPAR [5] | High for specific pathways (e.g., axonal outgrowth, vascular remodeling) | ELISA quantification; p<0.05 for association with scores [5] | Baseline GDF-10/uPAR linked to unfavorable 6-month sensorimotor scores (p<0.05) [5] | Observational, prospective multicenter study (n=62 stroke patients) [5] |
| Neurophysiological (VEP) | Theta-pulse stimulation, High-frequency stimulation [74] | High for LTP-like plasticity in visual cortex; shows input specificity & NMDAR-dependency [74] | Sustained plasticity induction for up to 28 minutes; effect sizes measurable across subjects [74] | Correlated with memory performance; impaired in psychiatric disorders [74] | 152 EEG recordings; systematic protocol comparison in healthy controls [74] |
| Resting-state fMRI | ALFF (Amplitude of Low-Frequency Fluctuation) [114] | High for classifying hand motor outcome post-stroke [114] | Classification accuracy of 0.88 for paretic hand outcomes [114] | Top contributing regions (e.g., precentral gyrus) predict hand function [114] | Multivariate pattern analysis in 65 chronic stroke patients [114] |
| Multimodal Neurophysiology | TMS-EEG-fNIRS combination [115] | Proposed as "transdiagnostic" marker of cortical inhibition/excitation balance [115] | Cohort designed to test reliability across disorders (stroke, SCI, amputation) [115] | Level of intracortical inhibition hypothesized to relate to functional deficits [115] | DEFINE study protocol (n=500 target), longitudinal design [115] |
Detailed Experimental Protocols and Methodologies
Molecular Biomarker Quantification in Stroke Rehabilitation
The protocol for identifying blood biomarkers associated with post-stroke recovery illustrates a rigorous longitudinal design [5].
- Study Population: 62 first-ever stroke patients (ischemic or hemorrhagic) with mRS 3-5 post-stroke, compared to 43 healthy controls. Key exclusion criteria included previous stroke, malignant infarct, or inflammatory disease [5].
- Sample Collection & Processing: Blood sampling was performed at baseline (pre-rehabilitation) and at 1, 3, and 6 months after rehabilitation initiation. Serum levels of endostatin, GDF-10, uPA, and uPAR were quantified using Enzyme-Linked Immunosorbent Assay (ELISA) [5].
- Functional Correlates: Biomarker levels were statistically correlated with a comprehensive battery of sensorimotor and functional tests: Fugl-Meyer Assessment (FMA), Barthel Index (BI), Chedoke Arm and Hand Activity Inventory (CAHAI), 10-m walk test, and Medical Research Council (MRC) scale [5].
- Data Analysis: Statistical mixed linear models were built to investigate prognostic value, with significance set at p<0.05. The results revealed that decreased endostatin or increased GDF-10 biomarker changes at the first month of rehabilitation were related to greater sensorimotor and functional improvements during follow-up [5].
VEP-Based Plasticity Induction and Measurement
The visually evoked potential (VEP) paradigm provides a non-invasive method for assessing LTP-like plasticity in the human visual cortex [74].
- Participant Preparation: Healthy volunteers with normal or corrected-to-normal vision, no neurological/psychiatric history, and free from psychoactive medications are seated at a fixed distance from a high-refresh-rate display (120 Hz). Participants fixate on a central cross and perform an attention-maintaining task (e.g., reading numbers aloud) [74].
- Baseline VEP Recording: Checkerboard reversal stimuli (0.5° visual angle) are presented at 2 reversals per second (rps) for 20 seconds, generating 40 sweeps to establish baseline VEP amplitudes [74].
- Modulation Protocols: Different stimulation protocols are applied to induce plasticity:
- Low-frequency: Single 10-minute block at 2 rps (1200 stimuli)
- Repeated low-frequency: Three 5-minute blocks at 2 rps (1800 total stimuli)
- High-frequency: 9 Hz flash stimulation for 2 minutes (1080 stimuli)
- Theta-pulse: Brief 9 Hz trains (6 pulses) repeated at theta frequency (5 Hz) for 10 minutes [74]
- Post-Modulation Assessment: VEPs are recorded again at 2, 8, 12, 18, 22, and 28 minutes post-modulation. The change in VEP amplitude from baseline serves as the index of plasticity [74].
rs-fMRI Biomarker Identification for Motor Outcomes
Resting-state fMRI biomarkers can classify paretic hand outcomes after stroke through standardized acquisition and analysis [114].
- Image Acquisition: Using a 3T MRI scanner, T1-weighted structural images and resting-state fMRI data (EPI sequence: TR/TE=2000/30 ms, 4 mm slice thickness, 240 volumes) are collected while patients rest with eyes closed [114].
- Data Preprocessing: Processing using DPABI software includes removal of initial time points, slice timing correction, head motion correction, spatial normalization, and smoothing [114].
- Metric Calculation: Multiple rs-fMRI metrics are computed:
- ALFF: Amplitude of Low-Frequency Fluctuation measures spontaneous brain activity strength within the low-frequency range (0.01-0.08 Hz)
- ReHo: Regional Homogeneity assesses synchrony of neural activity among neighboring voxels
- DC: Degree Centrality evaluates node importance within brain networks
- VMHC: Voxel-Mirrored Homotopic Connectivity measures coordination between bilateral brain regions [114]
- Multivariate Pattern Analysis: Machine learning (e.g., Support Vector Machine) classifies patients into different outcome groups (e.g., partially vs. completely paretic hand) based on rs-fMRI metrics [114].
Signaling Pathways and Workflow Integration
The following diagram illustrates the multi-level validation approach for neuroplasticity biomarkers, integrating molecular, systems-level, and behavioral data:
Diagram 1: Multi-level validation workflow for neuroplasticity biomarkers, showing integration from molecular discovery to clinical application.
The Scientist's Toolkit: Essential Research Reagents and Materials
Table 2: Key Research Reagent Solutions for Neuroplasticity Biomarker Investigation
| Reagent/Material | Specific Function | Example Application Context |
|---|---|---|
| ELISA Kits | Quantifies protein concentration in serum/plasma (e.g., Endostatin, GDF-10, uPAR) [5] | Measuring molecular biomarker levels in longitudinal stroke recovery studies [5] |
| High-Density EEG Systems | Records electrical brain activity with high temporal resolution; essential for VEP paradigms [74] | Assessing LTP-like visual cortical plasticity before/after modulation protocols [74] |
| 3T MRI Scanner with EPI Capability | Acquires functional MRI data for resting-state metrics (ALFF, ReHo, DC, VMHC) [114] | Classifying paretic hand outcomes in stroke patients via multivariate pattern analysis [114] |
| TMS Stimulator with Figure-8 Coil | Non-invasively measures and modulates cortical excitability and inhibition [115] | Assessing intracortical inhibition as a transdiagnostic biomarker in neurorehabilitation [115] |
| fNIRS Systems | Measures cortical hemodynamic responses using near-infrared light [115] | Monitoring prefrontal activity during cognitive tasks in longitudinal cohort studies [115] |
| Cellular Assays (qPCR, Western Blot) | Validates gene and protein expression of identified biomarkers [116] | Confirming bioinformatics-identified hub genes (e.g., RPL36AL, NDUFA1) in AD models [116] |
The establishment of rigorous validation criteria for neuroplasticity biomarkers requires convergent evidence across molecular, systems-level, and behavioral domains. Current research indicates that multi-modal approaches—combining blood biomarkers with neurophysiological and neuroimaging measures—offer the most promising path toward biomarkers with high specificity, reliability, and predictive value. The translation of these biomarkers across species remains a significant challenge, though conserved pathways like GDF-10/TGFβ signaling and LTP-like mechanisms provide strategic opportunities. For drug development professionals, these validated biomarkers create unprecedented opportunities for target engagement assessment, patient stratification, and treatment response monitoring in clinical trials for neurological and psychiatric disorders. Future work should prioritize standardized protocols, open data sharing, and prospective validation in diverse patient populations to advance these tools from research laboratories to clinical practice.
Cross-species validation represents a cornerstone of modern translational neuroscience, providing critical bridges between fundamental discoveries in model organisms and their clinical application in human disorders. This approach is particularly vital for complex conditions like depression and ischemic stroke, where heterogeneous presentation and limited treatment efficacy demand a deeper understanding of underlying pathophysiology. The validation of findings across species strengthens the biological evidence for identified mechanisms and provides greater confidence for investing in subsequent drug development efforts. This guide examines pioneering case studies that successfully implemented cross-species validation strategies, with a specific focus on neuroplasticity markers—the brain's capacity to reorganize structure, function, and connections in response to experience and injury.
The fundamental premise of cross-species research rests on identifying conserved biological pathways across evolutionary lineages. When molecular pathways, cellular responses, and systems-level adaptations demonstrate consistency between rodent models and human patients, they transition from correlative observations to validated therapeutic targets. The following case studies from depression and stroke research illustrate how this approach identifies core pathophysiological mechanisms while controlling for species-specific differences through rigorous experimental design and advanced bioinformatics.
Cross-Species Validation in Depression Research
Hippocampal Transcriptional Signatures in Major Depressive Disorder
Experimental Protocol: Researchers implemented a sophisticated computational approach to identify conserved transcriptional networks across species. The methodology encompassed parallel analysis of rodent models and human post-mortem tissue through these key stages:
Animal Models: Multiple established depression models were utilized, including:
- Flinders Sensitive Line (FSL) rats: A genetic model exhibiting inherent depression-like phenotypes
- Learned Helplessness (LH) rats: An environmental stress model where animals exposed to inescapable stress develop helplessness behavior
- Social Defeat (SD) rats: An ethologically valid model of chronic social stress
Human Tissue Analysis: Post-mortem hippocampal tissue from 19 MDD patients and 19 matched controls was obtained from the Gene Expression Omnibus (accession GSE53987)
Bioinformatics Pipeline: A rank-based classification algorithm with genetic algorithm optimization was employed to identify transcriptional signatures that could discriminate between disease and control states in both species. Signature genes were then used to construct protein-protein interaction networks for functional annotation [117].
Key Findings and Cross-Species Validation: The research identified a 70-probeset transcriptional signature that robustly discriminated depression models from controls in both FSL and LH animals, with a remarkable 99.64% accuracy in validation sets. In human tissue, a 171-probeset signature distinguished depressed from healthy subjects. Most importantly, cross-species analysis revealed significant overlap in affected biological pathways despite minimal direct gene overlap [117].
Table 1: Cross-Species Transcriptional Signatures in Depression
| Parameter | Rat Models | Human MDD | Cross-Species Overlap |
|---|---|---|---|
| Signature Size | 70 probesets | 171 probesets | - |
| Prediction Accuracy | 99.64% (validation set) | Significant discrimination | - |
| Shared Genes | - | - | SCARA5 gene |
| Network Overlap | - | - | 25 interacting genes |
| Shared Pathways | Growth factor signaling, immune responses, metabolic pathways | Growth factor signaling, immune responses, metabolic pathways | 67 terms (p=3.85×10⁻⁶) |
| Primary Tissue | Hippocampus | Hippocampus | Hippocampus |
The pathway analysis revealed highly significant overlap (p-value: 3.85 × 10⁻⁶) with 67 shared biological terms including ErbB, neurotrophin, FGF, IGF, and VEGF signaling pathways, alongside immune responses and insulin/leptin signaling. These findings point consistently toward "a loss of hippocampal neural plasticity mediated by altered levels of growth factors and increased inflammatory responses causing metabolic impairments" as crucial factors in MDD pathophysiology [117].
Mitochondrial Stress Response as a Conserved Mechanism
Experimental Protocol: A separate cross-species investigation focused specifically on the role of early life stress (ELS) in depression pathogenesis:
Animal Model: Mouse maternal separation paradigm was used to model early life stress, followed by RNA sequencing analysis of adult hippocampal tissue
Human Data Integration: Results were compared with publicly available RNAseq data from hippocampal tissue of depressive patients
Pathway Analysis: Bioinformatic analyses focused on identifying persistently altered transcriptional pathways across species [118]
Key Findings and Cross-Species Validation: This approach identified persistent transcriptional changes linked to mitochondrial stress response pathways in both mouse ELS models and human depression. Specifically, oxidative phosphorylation and mitochondrial protein folding emerged as the main mechanisms affected by maternal separation in mice and consistently altered in human depressive patients. This cross-species conservation of mitochondria-related gene expression changes suggests that mitochondrial stress may play a pivotal role in depression development, highlighting a potential novel target for therapeutic intervention [118].
Conserved Mitochondrial Stress Pathway in Depression
Cross-Species Validation in Stroke Research
RABEP2 Gene Validation in Ischemic Stroke
Experimental Protocol: This study established an innovative in vivo evaluation platform to validate the role of RABEP2 in ischemic stroke outcomes:
Animal Models: Rabep2 knockout mice were generated using CRISPR-Cas9 technology to remove sequence from exon 3, creating a frameshift mutation
Cross-Species Complementation: Rabep2 KO mice were administered adeno-associated virus (AAV) vectors containing:
- Mouse Rabep2 (species control)
- Human wild-type RABEP2
- Human RABEP2 with four coding variants predicted to be damaging
Phenotypic Assessment: Cerebral infarct volume was measured after permanent distal middle cerebral artery occlusion (pMCAO), and collateral vessel density was quantified through perfused vessel casting at postnatal day 21 and 10 weeks [119]
Key Findings and Cross-Species Validation: The research demonstrated that both mouse Rabep2 and human RABEP2 completely rescued the increased infarct volume and reduced collateral vessel phenotypes in Rabep2 KO mice. This established that human RABEP2 can functionally substitute for mouse Rabep2 in vivo. Most importantly, all four human coding variants (p.Arg508Ser, p.Ser204Leu, p.Arg490Trp, p.Arg543His) led to decreased collateral vessel connections and increased infarct volume, confirming they are naturally occurring loss-of-function alleles with direct relevance to human stroke pathophysiology [119].
Table 2: Cross-Species Functional Validation of RABEP2 in Stroke
| Experimental Condition | Collateral Vessel Density | Infarct Volume | Functional Outcome |
|---|---|---|---|
| Wild-type mice | Normal | Normal | Normal |
| Rabep2 KO mice | Decreased | Increased | Impaired |
| KO + mouse Rabep2 | Rescued to normal | Rescued to normal | Normalized |
| KO + human RABEP2 | Rescued to normal | Rescued to normal | Normalized |
| KO + human RABEP2 variants | Decreased | Increased | Impaired |
Biomarker Discovery Through Network Analysis
Experimental Protocol: A novel computational approach addressed the challenge of translating biomarker findings from animal models to human applications:
Training Data: Parallel miRNA-mRNA expression profiles from rat brain tissue after permanent middle cerebral artery occlusion (GSE25676)
Network Construction: Negatively correlated miRNA-mRNA interaction networks were built based on the principle that miRNAs typically negatively regulate target mRNAs
Biomarker Selection: PageRank algorithm identified hub genes in the network based on their connectivity and importance
Cross-Species Validation: Identified biomarkers were tested on two independent human blood mRNA expression datasets (GSE16561: 39 stroke patients, 24 controls; GSE22255: 20 stroke patients, 20 controls) [120]
Key Findings and Cross-Species Validation: This network-based approach successfully identified biomarkers from rat brain samples that clearly separated blood gene expression of stroke patients from healthy people in human validation datasets. The method outperformed traditional differential expression analysis by focusing on hub genes in regulatory networks rather than individual differentially expressed genes. This demonstrates that network importance provides more stable cross-species biomarkers than expression magnitude alone, enabling more effective utilization of animal model data for human disease biomarker development [120].
Cross-Species Biomarker Validation Workflow
BDNF Polymorphism and Neuroplasticity in Aphasia Recovery
Experimental Protocol: This study examined how genetic biomarkers of neuroplasticity interact with neurophysiological indicators to predict post-stroke aphasia severity:
Participant Cohort: 19 subjects with single left-hemisphere ischemic stroke >6 months post-stroke
Genetic Analysis: BDNF Val66Met polymorphism genotyping (a common SNP affecting activity-dependent BDNF release)
Neurophysiological Assessment: Motor-evoked potentials (MEPs) measured before and after continuous theta burst stimulation (cTBS) to index cortical excitability and stimulation-induced neuroplasticity
Language Assessment: Western Aphasia Battery Aphasia Quotient (WAB-AQ) quantified aphasia severity
Statistical Analysis: Evaluated whether BDNF polymorphism and neurophysiological measures improved aphasia severity predictions beyond established predictors (lesion volume, time post-stroke) [121]
Key Findings and Cross-Species Relevance: Val66Val carriers showed significantly less aphasia severity than Val66Met carriers after controlling for lesion volume and time post-stroke. Importantly, BDNF polymorphism interacted with cortical excitability and stimulation-induced neuroplasticity to improve aphasia severity predictions. While this study was conducted in humans, the BDNF Val66Met polymorphism has well-characterized effects on synaptic plasticity in animal models, creating a bridge for cross-species interpretation. The findings demonstrate that genetic biomarkers of neuroplasticity can improve prognostic predictions after neurological injury [121].
The Scientist's Toolkit: Essential Research Reagents and Platforms
Table 3: Essential Research Reagents and Platforms for Cross-Species Validation
| Reagent/Platform | Function | Application Examples |
|---|---|---|
| AAV Gene Delivery Vectors | In vivo gene replacement or knockdown in specific tissues | Cross-species complementation tests (human gene in KO mice) [119] |
| CRISPR-Cas9 Gene Editing | Generation of knockout animal models for functional validation | Rabep2 KO mice for stroke studies [119] |
| Parallel miRNA-mRNA Profiling | Comprehensive view of regulatory networks across species | Network-based biomarker discovery [120] |
| PageRank Algorithm | Identification of hub genes in biological networks | Prioritizing biologically relevant cross-species biomarkers [120] |
| cTBS/TMS Neurostimulation | Non-invasive induction and measurement of neuroplasticity | Assessing cortical excitability and plasticity capacity [121] |
| Polymer Perfusion Casting | Visualization and quantification of vascular networks | Collateral vessel density measurement [119] |
These case studies demonstrate that successful cross-species validation requires more than simply identifying orthologous genes expressed in both species. The most compelling validations emerge when:
Conserved Pathways Trump Conserved Genes: As demonstrated in the depression transcriptomics study, strongly conserved pathway-level signatures with minimal gene-level overlap can still provide robust validation of disease mechanisms [117]
Functional Complementation Provides Strong Evidence: The ability of human RABEP2 to rescue phenotypes in mouse knockout models provides particularly compelling evidence for conserved biological function [119]
Network-Based Approaches Enhance Stability: Analyzing gene interaction networks rather than individual genes produces more stable biomarkers that translate better across species [120]
Multi-Level Data Integration Strengthens Conclusions: Combining genetic, neurophysiological, and behavioral measures provides more comprehensive validation across biological scales [121]
The consistent emergence of neuroplasticity-related pathways—including growth factor signaling, mitochondrial function, and vascular remodeling—across both depression and stroke studies highlights these processes as fundamental to brain recovery mechanisms. Future research integrating single-cell sequencing, advanced circuit manipulation tools, and human stem cell models will further enhance our ability to validate mechanisms across species, ultimately accelerating the development of novel therapeutics for neurological and psychiatric disorders.
The brain's remarkable capacity to reorganize its structure, function, and connections in response to experience—a phenomenon known as neuroplasticity—persists throughout the lifespan and offers a framework for understanding both normal and pathological psychological function [122]. While traditionally attributed to external stimuli, learning, and experience, emerging research highlights that endogenous signals from the body's periphery, including the gut microbiota, significantly influence neuroplastic processes [123]. For neuroscience researchers and drug development professionals, identifying conserved pathways and universal markers of neuroplasticity across diverse species represents a critical step toward developing effective, translatable therapeutic interventions for neurological and psychiatric disorders.
The challenge in neuroplasticity research lies in the translation of findings from animal models to human applications. As noted in commentary on research models, an overreliance on selectively bred rodents housed in artificial environments may limit the translational impact of neuroscience findings [124]. For instance, laboratory rats fail to reliably generalize to wild rats of the same species, much less to humans [124]. This review addresses these challenges by systematically comparing established and emerging markers of neuroplasticity across species and research paradigms, providing a structured analysis of conserved pathways with significant implications for therapeutic development.
Comparative Analysis of Universal Neuroplasticity Markers
Neuroplasticity manifests at multiple biological levels, from molecular changes to systemic network reorganization. The markers summarized in the table below represent conserved indicators of neuroplasticity with demonstrated relevance across species and experimental paradigms.
Table 1: Conserved Markers of Neuroplasticity Across Biological Levels
| Marker Category | Specific Marker | Detection Methods | Species Observed | Functional Significance |
|---|---|---|---|---|
| Molecular Factors | Brain-Derived Neurotrophic Factor (BDNF) | Immunohistochemistry, ELISA | Humans, Rodents, Raccoons [122] [124] | Enhances neurogenesis, synaptic growth [123] |
| Molecular Factors | Short-Chain Fatty Acids (SCFAs) | Mass Spectrometry, Chromatography | Humans, Rodents [123] | Cross blood-brain barrier; enhance synaptic plasticity [123] |
| Structural Changes | Gray Matter Density (Anterior Cingulate Cortex) | Structural MRI (sMRI) | Humans [125] | Increases with error-reframing training [125] |
| Structural Changes | Neuronal Density/Dendritic Branching | Histological Analysis, Microscopy | Rodents, Raccoons, Shrews [124] | Indicator of experience-dependent change [124] |
| Functional Network Changes | Default Mode Network (DMN) Connectivity | Functional MRI (fMRI) | Humans [122] | Modulated by physical exercise [122] |
| Functional Network Changes | Sensorimotor Network Connectivity | Functional MRI (fMRI) | Humans [122] | Modulated by physical exercise [122] |
| Functional Network Changes | Error-Related Negativity (ERN) | Electroencephalography (EEG) | Humans [125] | Neural marker of adaptive learning [125] |
| Behavioral Manifestations | Cognitive Flexibility & Problem-Solving | Behavioral Tasks, Cognitive Testing | Humans, Corvids, Octopuses [124] | Indicator of adaptive neural reorganization [124] |
The conservation of these markers across diverse species underscores their fundamental role in neuroplastic processes. From BDNF signaling in rodents and humans to the remarkable neural regeneration observed in common shrews—which digest and regrow significant brain tissue seasonally—these shared mechanisms highlight evolutionarily ancient pathways for neural adaptation [124]. The identification of such conserved markers provides a robust foundation for developing cross-species validation frameworks in neuroplasticity research.
Experimental Protocols for Assessing Neuroplasticity Markers
Physical Exercise Interventions and Neuroimaging
Objective: To evaluate the impact of different exercise modalities (cardiovascular, strength, mixed) on functional and structural brain networks in healthy adults (18-80 years) [122].
Methodology Details:
- Participant Screening: Healthy adults with no mental, psychological, physical, or motor disorders are recruited. The age range is typically stratified to examine lifespan effects (e.g., young adults <35 years vs. older adults ≥60 years) [122].
- Exercise Protocols: Interventions are categorized by:
- Type: Cardiovascular (e.g., walking, running, high-intensity interval training), Strength (resistance training with major muscle groups), or Mixed (integrating balance, coordination, e.g., Tai Chi) [122].
- Intensity: Objectively measured using heart rate maximum (HRmax: Light-to-Moderate = 57-76%; Vigorous = 76-96%) or percentage of one-repetition maximum (1 RM: Light-to-Moderate = 30-70%; Vigorous = 70-85%) [122].
- Duration: Classified as Short-Term (<1 year) or Long-Term (≥1 year) interventions [122].
- Neuroplasticity Assessment: Employ functional and structural Magnetic Resonance Imaging (fMRI/sMRI) to measure changes in major Brain Networks (Default Mode, Salience, Sensorimotor Networks). Transcranial Magnetic Stimulation (TMS) may be used to assess cortical excitability and plasticity [122].
- Data Analysis: Compare pre- and post-intervention network connectivity and brain structure, correlating changes with exercise parameters (type, intensity, duration) [122].
Gut-Brain Axis Modulation via Microbiome Manipulation
Objective: To investigate the impact of gut microbiota on neuroplasticity through the gut-brain axis using microbiota-targeted interventions [123].
Methodology Details:
- Animal Models: Typically use germ-free mice, specific pathogen-free rodents, or animals treated with antibiotics to manipulate microbial status. Probiotic (e.g., Lactobacillus, Bifidobacterium) and prebiotic interventions are administered [123].
- Microbial Analysis: Collect fecal samples for 16S rRNA sequencing to assess microbial community composition and diversity. Metagenomic sequencing may be used to analyze functional potential [123].
- Neuroplasticity Assessment:
- Molecular: Measure brain-derived neurotrophic factor (BDNF) levels via ELISA or immunohistochemistry. Quantify microbial metabolites (e.g., SCFAs: butyrate, propionate, acetate) in blood and brain tissue using mass spectrometry [123].
- Structural & Functional: Utilize histological techniques to assess neurogenesis (e.g., BrdU labeling) and dendritic complexity. Employ behavioral tests (e.g., forced swim test, maze learning) to assess cognitive and affective outcomes [123].
- Mechanistic Probes: Use vagotomy to assess the role of the vagus nerve. Administer receptor blockers to investigate specific pathways (e.g., SCFA receptors) [123].
Cognitive Training and Neuroplasticity Assessment
Objective: To examine the impact of growth mindset and cognitive training interventions on neuroplasticity in educational contexts [125].
Methodology Details:
- Intervention Design: Implement structured training sessions that reframe challenges and errors as opportunities for growth. Mathematical mindset interventions emphasize viewing mathematics as a creative, exploratory subject [125].
- Neuroimaging: Use fMRI to monitor activation changes in key brain regions associated with error processing (Anterior Cingulate Cortex - ACC), cognitive control (dorsolateral Prefrontal Cortex - DLPFC), and visuospatial processing (Intraparietal Sulcus - IPS) during cognitive tasks [125].
- Electrophysiological Measures: Record EEG to capture Error-Related Negativity (ERN), a neural marker of error monitoring and adaptive learning [125].
- Psychological Assessment: Administer validated questionnaires to measure Growth Mindset, Mathematical Mindset, and Self-Efficacy before and after the intervention [125].
- Data Correlation: Analyze relationships between neural changes (e.g., increased ACC-DLPFC connectivity, larger ERN), behavioral performance (e.g., mathematical problem-solving accuracy), and psychological shifts (e.g., increased self-efficacy) [125].
Signaling Pathways and Neuroplasticity Mechanisms
The following diagrams, created using Graphviz DOT language, visualize key conserved signaling pathways in neuroplasticity. The color palette adheres to the specified guidelines, ensuring sufficient contrast for readability.
BDNF Signaling in Synaptic Plasticity
Figure 1: BDNF Signaling Pathway: This diagram illustrates the conserved Brain-Derived Neurotrophic Factor (BDNF) signaling cascade, from receptor binding (TrkB) to downstream effects on synaptic growth and neurogenesis, highlighting key modulators like exercise, microbial metabolites, and cognitive enrichment [122] [123] [125].
Gut-Brain Axis Communication
Figure 2: Gut-Brain Axis Communication: This diagram outlines the multi-pathway communication between gut microbiota and the brain, showing how microbial metabolites (SCFAs), immune modulation, and neural pathways (vagus nerve) converge to influence neuroplasticity [123].
The Scientist's Toolkit: Research Reagent Solutions
Table 2: Essential Research Reagents for Neuroplasticity Investigations
| Reagent/Category | Specific Examples | Research Function | Example Application |
|---|---|---|---|
| BDNF Assays | ELISA Kits, Anti-BDNF Antibodies | Quantify BDNF protein levels in serum, plasma, and brain tissue | Measure exercise-induced neurotrophic effects [122] |
| SCFA Analysis | Mass Spectrometry Kits, Gas Chromatography Columns | Detect and quantify short-chain fatty acids (butyrate, propionate) | Analyze microbial metabolite changes after pre/probiotic intervention [123] |
| Neural Tracers | Biocytin, Fluorescent Dextrans, PRV | Map neuronal connectivity and circuit reorganization | Trace neural pathways modified by learning [124] |
| Cell Proliferation Markers | Bromodeoxyuridine (BrdU), Ki-67 Antibodies | Label and quantify newly generated cells | Assess adult hippocampal neurogenesis [123] |
| Synaptic Markers | Anti-PSD-95, Anti-Synapsin I Antibodies | Visualize and quantify synaptic density | Evaluate structural plasticity in sensorimotor cortex [122] |
| Microbial Probes | 16S rRNA Sequencing Kits, Pre/Probiotics | Characterize and manipulate gut microbiota composition | Investigate gut microbiome role in neurodevelopment [123] |
| fMRI Analysis Software | FSL, SPM, CONN | Process and analyze functional connectivity data | Identify changes in Default Mode Network connectivity [122] |
Discussion: Integration and Translation of Conserved Markers
The identification of conserved neuroplasticity markers across species strengthens the theoretical foundation for translational neuroscience while providing practical tools for drug development. The convergence of evidence from diverse research models—from traditional laboratory rodents to non-traditional models like raccoons, shrews, and corvids—reveals that while specific manifestations of neuroplasticity may differ, core molecular and systems-level mechanisms remain remarkably conserved [124]. This conservation provides enhanced predictive validity for therapeutic development, suggesting that interventions effective across multiple species are more likely to succeed in human clinical trials.
However, important considerations remain. The influence of environmental enrichment and ecological validity on neuroplastic outcomes cannot be overstated [124]. Research comparing wild and laboratory rats of the same species reveals dramatic differences in stress response and behavior, highlighting how traditional laboratory environments may fail to capture the full spectrum of neuroplastic potential [124]. Similarly, the emerging understanding of the gut-brain axis introduces a complex, modifiable system that significantly influences neuroplasticity through microbial metabolites, immune modulation, and vagal nerve signaling [123]. Future research must continue to expand beyond "the lamp post" of conventional models and methodologies to fully capture the complexity of neuroplasticity across species and contexts [124].
For drug development professionals, this integrated view of neuroplasticity markers suggests promising therapeutic avenues. Interventions that simultaneously target multiple conserved pathways—such as combining physical exercise with microbiome optimization or cognitive training with pharmacological BDNF enhancement—may produce synergistic effects superior to single-modality approaches. The markers and methodologies reviewed here provide a framework for evaluating such combinatorial approaches across the translational pipeline, from animal models to human clinical trials, ultimately accelerating the development of effective interventions for enhancing brain health and treating neurological disorders.
The study of phenotypic plasticity—the ability of a single genotype to produce different phenotypes in response to environmental changes—reveals fundamental mechanisms of adaptation, learning, and evolution. However, plasticity manifests through remarkably species-specific mechanisms that vary across taxonomic groups, creating significant challenges for translational research. Understanding these divergent mechanisms is particularly crucial in neuroscience and drug development, where findings from model organisms must be reliably translated to human applications. Recent research demonstrates that plasticity is not a unified brain function but rather a biological tool that can be used to perform remarkably different functions across species [3]. This comparative guide examines the key differences in plasticity responses across species, synthesizing experimental data and methodologies to inform research and therapeutic development.
Comparative Tables of Plasticity Mechanisms Across Species
Structural and Neurogenic Plasticity Variations
Table 1: Interspecies Differences in Key Neuroplasticity Mechanisms
| Species | Adult Neurogenesis | Cortical Immature Neurons (cINs) | Developmental Plasticity Windows | Primary Plasticity Functions |
|---|---|---|---|---|
| Zebrafish | Abundant, widespread, lifelong [3] | Limited data | Extended developmental periods | Brain repair, regeneration [3] |
| Rodents (Mice) | Reduced in space/time vs. fish; high SVZ rates in aging [3] | Faster age-related drop [3] | Juvenile-stage drop in neurogenic plasticity [3] | Circuit refinement during development [3] |
| Gyrencephalic Mammals | Substantially reduced vs. rodents [3] | More abundant, extended neocortex distribution [3] | Earlier drop in specific plastic processes [3] | Complex circuit adaptation |
| Humans | Limited, regionally restricted; SVZ neurogenesis drops by ~2 years [3] | Maintained at advanced ages vs. rodents [3] | Heterochronic shifts in developmental timing [3] | Learning, memory, circuit optimization |
Table 2: Molecular and Behavioral Plasticity Markers Across Species
| Plasticity Marker | Rodent Findings | Human Findings | Translational Concordance |
|---|---|---|---|
| BDNF Val66Met | Impaired fear extinction in Met carriers [44] | Parallel impairment in fear extinction; altered vmPFC-amygdala circuitry [44] | High behavioral and circuit-level concordance [44] |
| Doublecortin (DCX) | Reliable marker for newborn neurons in neurogenic zones [3] | Non-specific to neurogenesis in cortical layer II [3] | Low: context-dependent interpretation required [3] |
| Fear Extinction | Developmental attenuation during adolescence [44] | Parallel behavioral patterns across development [44] | High behavioral concordance [44] |
| Structural Plasticity | Increased dendritic spines after psychostimulants [90] | Limited direct evidence; inferred from imaging [95] | Moderate (inferred from comparable circuits) |
Quantitative Software Variation in Volumetric Measurements
Table 3: Methodological Variations in Hippocampal Volumetry Across Software Platforms
| Software Application | Left Hippocampus Mean Difference (mm³) | Right Hippocampus Mean Difference (mm³) | Intraclass Correlation (ICC) | Reliability Assessment |
|---|---|---|---|---|
| FreeSurfer | -209 | -232 | 0.88 (LH), 0.86 (RH) | High consistency [6] |
| SPM-Neuromorphometrics | -820 | -745 | Moderate | Moderate reliability [6] |
| SPM-Hammers | -1474 | -1547 | Moderate | Moderate reliability [6] |
| Quantib | -680 | -723 | 0.36 (RH) | Low to moderate reliability [6] |
| GIF | 891 | 982 | Moderate | Moderate reliability [6] |
| STEPS | 2218 | 2188 | 0.42 (LH) | Low reliability [6] |
Experimental Protocols for Cross-Species Plasticity Research
Fear Extinction Paradigm (Rodent-Human Translation)
The fear extinction protocol has emerged as a robust cross-species model for studying plasticity mechanisms in emotional learning [44].
Rodent Protocol:
- Fear Conditioning: Animals receive pairings of a neutral conditioned stimulus (CS; e.g., tone) with an aversive unconditioned stimulus (US; e.g., mild footshock) in a dedicated conditioning chamber.
- Extinction Training: 24 hours later, in a modified context, animals receive repeated presentations of the CS without the US.
- Neural Activation Analysis: Brains are processed for c-Fos immunohistochemistry or electrophysiological recordings in ventromedial prefrontal cortex (vmPFC) and amygdala regions.
- Slice Electrophysiology: Brain slices containing vmPFC are prepared for patch-clamp recordings of pyramidal neurons, measuring excitatory postsynaptic currents (EPSCs) and AMPA/NMDA receptor ratios [44].
Human Parallel Protocol:
- Fear Acquisition: Participants receive pairings of a neutral visual stimulus (CS) with a mild electric shock or aversive sound (US) while measuring galvanic skin response (GSR).
- Extinction Training: In the same session or subsequent day, participants receive CS presentations without US while GSR is continuously monitored.
- fMRI Acquisition: During extinction, blood-oxygen-level-dependent (BOLD) signals are recorded from vmPFC and amygdala using 3T fMRI.
- Genetic Analysis: BDNF Val66Met genotyping is performed via PCR from saliva or blood samples [44].
Comparative Neuroanatomy of Plasticity Markers
This protocol standardizes the detection of plasticity markers across multiple species for valid comparisons [3].
Tissue Processing:
- Perfusion and Fixation: Animals are transcardially perfused with 4% paraformaldehyde in parallel with postmortem human tissue collection (PMI <12 hours).
- Sectioning: Brains are sectioned coronally at 40μm thickness using a vibrating microtome.
- Antigen Retrieval: Sections undergo citrate buffer antigen retrieval for consistent epitope exposure across species.
Immunohistochemistry:
- Primary Antibodies: Simultaneous incubation with antibodies against doublecortin (immature neurons), Ki67 (cell proliferation), and NeuN (mature neurons).
- Species-Specific Validation: Antibody validation for each species using pre-absorption tests and western blotting.
- Quantification: Stereological cell counts performed using unbiased stereology (optical fractionator) across comparable brain regions.
Confocal Imaging:
- Multi-label Imaging: Confocal z-stacks acquired with consistent settings across species.
- Colocalization Analysis: Assessment of doublecortin/Ki67 double-labeling to distinguish neurogenesis from immature neuronal persistence [3].
Signaling Pathways and Experimental Workflows
Diagram 1: Cross-species BDNF-mediated fear extinction pathway. Note the complementary methodologies for investigating parallel neural circuits in rodents (electrophysiology) and humans (fMRI).
Diagram 2: Experimental workflow for cross-species plasticity research, highlighting the importance of standardized protocols across diverse methodological approaches.
The Scientist's Toolkit: Essential Research Reagents and Solutions
Table 4: Key Reagents for Cross-Species Plasticity Research
| Reagent/Resource | Function in Plasticity Research | Species Applications | Technical Considerations |
|---|---|---|---|
| Doublecortin (DCX) Antibodies | Marks immature neurons; assesses neurogenesis and neuronal immaturity | Multiple species; interpretation varies by brain region [3] | Not specific to neurogenesis in cortical regions; requires validation for each species [3] |
| BrdU (5-bromo-2'-deoxyuridine) | Thymidine analog labeling newborn cells through DNA incorporation | Rodents, non-human primates; limited human use | Potential false positives from DNA repair; requires co-labeling with neuronal markers [3] |
| Ki67 Antibodies | Nuclear protein expressed during active cell division (G1, S, G2, M phases) | All species with validated antibodies | Short half-life; only labels currently dividing cells [3] |
| BDNF Genotyping Assays | Identifies Val66Met polymorphism affecting synaptic plasticity | Mice and humans with parallel paradigms [44] | Shows conserved behavioral and neural effects across species [44] |
| c-Fos Antibodies | Marks recently activated neurons; maps functional neural circuits | Broad cross-species application | Time-sensitive after behavioral manipulation; varies by cell type [44] |
| Olig2 Antibodies | Identifies oligodendrocyte precursor cells (OPCs) | Rodents and humans | Major dividing cell population in adult brain; potential confound for neurogenesis studies [3] |
Discussion and Research Implications
The comparative analysis of plasticity mechanisms across species reveals both conserved principles and critical differences that inform translational research. The high concordance in behavioral paradigms like fear extinction across rodents and humans provides valuable models for studying emotional learning plasticity [44]. However, significant species-specific variations in structural plasticity mechanisms, particularly in adult neurogenesis and marker interpretation, necessitate cautious translation from model organisms to humans [3].
These findings have profound implications for drug development targeting neuroplasticity. First, therapeutic strategies enhancing BDNF signaling must account for genetic variations (Val66Met) that similarly affect plasticity across species [44]. Second, interventions promoting structural plasticity may have different regenerative potential across species, given the striking differences in adult neurogenesis rates and patterns [3]. Finally, non-pharmacological interventions for human depression successfully target neuroplasticity mechanisms [126], suggesting conserved plasticity pathways can be therapeutically engaged despite species differences.
Future research should prioritize multispecies comparative studies that directly parallel experimental conditions across rodents, non-human primates, and humans [95]. Standardization of tissue processing, marker validation, and analytical methods across species will enhance translational predictivity. Additionally, computational models linking molecular events to macroscopic imaging findings will bridge the gap between animal and human plasticity research [95]. By acknowledging both the conserved principles and divergent mechanisms of plasticity across species, researchers can develop more effective, translationally valid interventions for neuropsychiatric disorders.
The pursuit of robust biomarkers for neuroplasticity represents a cornerstone of modern neuroscience and therapeutic development. Historically, research has often focused on single markers, an approach limited by the biological complexity of neuroplastic processes. The field is now undergoing a paradigm shift, moving toward multi-biomarker panels that collectively capture the multifaceted nature of brain repair and adaptation. This transition is driven by recognition that neuroplasticity involves coordinated changes across molecular, cellular, and systems levels, which cannot be adequately reflected by any single analyte. Blood-based biomarker panels, in particular, are predicted to have significant impact as minimally invasive screening tools capable of predicting onset and tracking progression of neurological conditions, thereby improving therapeutic interventions [127].
This guide objectively compares the performance of single-marker approaches versus multi-marker panels, providing supporting experimental data structured for researcher evaluation. Framed within a broader thesis on validating neuroplasticity markers across species, it details specific methodologies and reagent solutions to facilitate cross-laboratory standardization and adoption.
Performance Comparison: Single Markers vs. Integrated Panels
Robust validation requires a clear demonstration of performance advantages. The following comparative data, synthesized from recent studies, illustrates the enhanced diagnostic and prognostic power of biomarker panels.
Table 1: Diagnostic Performance Comparison of Single vs. Panel Biomarker Approaches
| Application Area | Single Marker (Example) | Single Marker Performance (AUC) | Biomarker Panel (Example) | Panel Performance (AUC) | Key Panel Components |
|---|---|---|---|---|---|
| Pancreatic Cancer Detection [128] | CA19-9 | 0.868 (Early Stage) | ML-Itegrated Protein Panel | 0.976 (Early Stage) | CA19-9, GDF-15, suPAR |
| Alzheimer's Disease Classification [127] | Individual Aβ42/40 or t-tau | Variable, lower accuracy | Combination of Aβ42/40 ratio & APOEε4 status | High accuracy for predicting amyloid PET status | Aβ42, Aβ40, APOEε4 allele |
| Post-Stroke Recovery Prognosis [5] | GDF-10 (individual) | Associated with unfavorable outcomes | Combined kinetics of GDF-10 and Endostatin | Superior tracking of sensorimotor/functional improvements | GDF-10, Endostatin, uPAR |
Table 2: Analytical Techniques Supporting Biomarker Panel Development
| Technique | Primary Application | Throughput | Key Advantage for Panels | Consideration for Neuroplasticity |
|---|---|---|---|---|
| Luminex Bead-Based Multiplex Immunoassay [128] | Multiplexed protein quantification | High | Simultaneous measurement of 47+ proteins from low-volume samples | Ideal for validating panels from blood/CSF |
| LC-MS/MS [129] | Protein/metabolite quantification | High | Precise, reproducible quantification of complex panels | Requires extensive sample prep |
| ELISA [5] | Single protein quantification | Low | Gold-standard, widely accessible for validation | Low-throughput for panels; best for final validation |
| Next-Generation Sequencing (NGS) [129] | Genomic/transcriptomic profiling | High | Unbiased discovery of novel marker candidates | Can identify RNA-based plasticity markers |
Experimental Protocols for Panel Development and Validation
Protocol 1: Machine Learning-Driven Serum Protein Panel Development
This protocol, adapted from a study on pancreatic cancer, outlines a robust workflow for developing a high-performance diagnostic panel using machine learning (ML), a method directly transferable to neuroplasticity research [128].
- Step 1: Cohort Selection and Sample Collection. Establish two independent cohorts: a development set (e.g., n=355) and a validation set (e.g., n=130). For neuroplasticity, cohorts should include patients at different recovery stages (e.g., post-stroke) and matched healthy controls. Blood samples are collected, processed to serum/plasma, and stored at -80°C.
- Step 2: Biomarker Quantification. Quantify a broad set of candidate protein biomarkers (e.g., 47 proteins) using a high-throughput multiplex platform like the Luminex bead-based immunoassay. The procedure involves:
- Prewetting plates with wash buffer.
- Adding standards, controls, and sample matrix to wells.
- Incubating with antibody-conjugated beads overnight at 4°C.
- Adding biotinylated detection antibodies, followed by streptavidin-phycoerythrin.
- Measuring fluorescence intensity and calculating concentrations via a 5-parameter logistic curve.
- Step 3: ML Model Training and Feature Selection. Employ multiple ML algorithms (e.g., CatBoost, Random Forest, XGBoost) on the development set. Use a five-fold cross-validation approach, splitting data into training (80%) and testing (20%) subsets while stratifying for age and gender. Apply SHapley Additive exPlanations (SHAP) analysis to identify the most important biomarkers contributing to the model's predictive accuracy.
- Step 4: Panel Validation. Validate the final, reduced biomarker panel on the independent validation cohort. Assess performance using metrics including Area Under the Receiver Operating Characteristic Curve (AUROC), sensitivity, specificity, and accuracy.
Protocol 2: Assessing Neuroplasticity Biomarkers in a Post-Stroke Rehabilitation Cohort
This protocol details a longitudinal approach to validate blood-based biomarkers associated with recovery, a key aspect of neuroplasticity [5].
- Step 1: Prospective Cohort Design. Recruit a well-characterized cohort of patients (e.g., n=62) following a first-ever stroke alongside healthy control subjects (e.g., n=43). Define strict inclusion/exclusion criteria (e.g., age ≤75, stable medical condition, specific mRS scores) to ensure homogeneity.
- Step 2: Longitudinal Sampling and Clinical Assessment. Implement a structured timeline for evaluation. Blood sampling and a battery of sensorimotor and functional tests (e.g., Fugl-Meyer Assessment, Barthel Index, 10-m walk test) are conducted at baseline (pre-rehabilitation) and at follow-up visits (e.g., 1, 3, and 6 months).
- Step 3: Biomarker Measurement. Process blood samples to serum. Quantify specific protein biomarkers (e.g., Endostatin, GDF-10, uPAR) using Enzyme-Linked Immunosorbent Assay (ELISA) kits, following manufacturer protocols. All samples should be batched and measured in duplicate to minimize inter-assay variability.
- Step 4: Data Integration and Statistical Analysis. Build statistical mixed linear models to investigate the relationship between biomarker levels (both baseline values and longitudinal changes) and functional improvement scores over the follow-up period. This determines the prognostic value of individual markers and their combinations.
Protocol 3: Cross-Species Validation of VEP-Based Plasticity Biomarkers
This protocol uses Visually Evoked Potentials (VEPs) to measure LTP-like plasticity in the human visual cortex, providing a direct bridge to mechanistic studies in animal models [21].
- Step 1: Participant Preparation and Baseline VEPs. Seat participants comfortably before a screen. Record baseline VEPs by presenting a checkerboard reversal stimulus (e.g., 20 seconds at 2 reversals per second) while recording EEG. Instruct participants to fixate on a central cross to maintain attention.
- Step 2: Modulation Phase (Plasticity Induction). Apply one of several patterned stimulation protocols to induce plasticity. Key protocols include:
- Low-Frequency Stimulation: A single 10-minute block at 2 Hz.
- Repeated Low-Frequency Stimulation: Three 10-minute blocks at 2 Hz to probe ceiling effects.
- High-Frequency Stimulation: Short, high-frequency tetanic modulation (e.g., ~9 Hz).
- Theta-Pulse Stimulation: Pulsed application at theta frequency to optimize potentiation.
- Step 3: Post-Modulation VEP Recording. Record VEPs again using the same checkerboard stimulus as baseline at multiple time points after modulation (e.g., 2, 8, 12, 18, 22, and 28 minutes).
- Step 4: Data Analysis. Calculate the change in VEP amplitude from baseline for each post-modulation time block. The magnitude and persistence of the amplitude increase serve as an index of LTP-like visual cortical plasticity, which can be compared against interventions or patient populations.
Visualizing Workflows and Pathways
Biomarker Panel Development Workflow
This diagram visualizes the end-to-end process for developing and validating a machine learning-driven biomarker panel.
Neuroplasticity Signaling Pathway
This diagram illustrates a simplified signaling pathway involving key biomarkers discussed in the experimental protocols.
The Scientist's Toolkit: Essential Research Reagents and Materials
Successful development and validation of neuroplasticity biomarker panels depend on specific, high-quality reagents and platforms.
Table 3: Key Research Reagent Solutions for Biomarker Panel Workflows
| Reagent / Platform | Primary Function | Key Feature | Example Use Case |
|---|---|---|---|
| Luminex xMAP Beads [128] | Multiplexed protein quantification | Enables simultaneous measurement of dozens of analytes from a single sample | Discovery and validation phase of serum protein panels |
| Olink Explore Platform [130] | High-throughput proteomics | Pre-designed, validated panels for scalable proteomic profiling | Unbiased discovery of novel neuroplasticity-associated proteins |
| SHapley Additive exPlanations (SHAP) [128] | ML model interpretation | Quantifies the contribution of each biomarker to a model's output | Identifying the most critical markers in a complex panel |
| Qiagen IPA Biomarker Filter [131] | Biomarker candidate prioritization | Ranks genes/proteins based on biological plausibility and detectability in biofluids | Triaging candidate markers from omics datasets |
| Stable Isotope-Labeled Internal Standards (SIL-IS) [129] | Mass spectrometry quantification | Compensates for ion suppression and extraction variability | Ensuring precise LC-MS/MS quantification of panel members |
| Custom ELISA Kits [5] | Target-specific protein quantification | High sensitivity and specificity for validated targets | Final validation of individual panel biomarkers in longitudinal studies |
The translation of basic neuroscience discoveries into effective human therapies represents one of the most significant challenges in modern biomedical research. Despite substantial advancements in understanding neuroplasticity mechanisms—the nervous system's ability to reorganize its structure, function, and connections in response to stimuli—the clinical application of these findings has remained limited [132]. The complexity of the central nervous system (CNS), combined with interspecies differences and methodological variability, creates substantial barriers to successful translation. Neuroplasticity occurs across multiple levels, from molecular and cellular changes to network and behavioral adaptations, and can be either adaptive (associated with functional gains) or maladaptive (associated with negative consequences) [132]. This comparative guide objectively examines the performance of various preclinical models in predicting human therapeutic outcomes, with a specific focus on validating neuroplasticity markers across species. The translation of neuroplasticity research requires iterative collaborations between basic and clinical researchers to understand adaptive mechanisms from molecules to behavior [132]. Common themes that emerge across diverse CNS conditions include the experience-dependent nature of plasticity, its time sensitivity, and the critical importance of motivation and attention in driving plastic changes [132]. By addressing the challenges outlined in this guide, researchers can enhance opportunities for translating neuroplasticity and circuit retraining research into effective clinical therapies.
Comparative Analysis of Preclinical Models for Neuroplasticity Research
Performance Metrics Across Model Organisms
Different model organisms offer distinct advantages and limitations for studying neuroplasticity processes relevant to human therapeutic development. The translation of findings from these models to human applications requires careful consideration of species-specific differences in neuroanatomy, plasticity mechanisms, and temporal dynamics.
Table 1: Comparative Performance of Model Organisms in Neuroplasticity Research
| Model Organism | Key Advantages | Major Limitations | Neuroplasticity Marker Concordance with Humans | Typical Experimental Timeline |
|---|---|---|---|---|
| Mice (Mus musculus) | Genetic tractability, well-characterized neuroanatomy, established behavioral assays | Simplified CNS organization, differential persistence of adult neurogenesis, limited cognitive modeling | Moderate: Synaptic plasticity markers conserved; adult neurogenesis rates and persistence differ significantly | 3-12 months |
| Rats (Rattus norvegicus) | Larger brain size facilitating surgical manipulations, richer behavioral repertoire than mice | Similar limitations as mice in cortical complexity and neurogenesis patterns | Moderate-High: Better translational validity in motor recovery studies after CNS injury | 6-18 months |
| Marmoset (Callithrix jacchus) | Primate neuroanatomy, complex social behavior, gyrencephalic brain | Limited availability, ethical considerations, specialized housing requirements | High: Cortical immature neuron distribution more similar to humans | 2-5 years |
| Macaque (Macaca spp.) | Close phylogenetic relationship to humans, advanced cognitive abilities, complex cortical organization | High cost, ethical challenges, limited subject availability | High: Neural network organization and plasticity mechanisms closely align with humans | 5-15 years |
| Zebrafish (Danio rerio) | High regenerative capacity, optical transparency for imaging, rapid development | Evolutionarily distant from mammals, differential brain organization | Low-Moderate: Fundamental mechanisms conserved but regenerative capacity exceeds mammals | 1-12 months |
Quantitative Comparison of Neuroplasticity Markers Across Species
The validation of neuroplasticity markers across species requires direct comparison of quantitative measures under standardized conditions. Significant differences exist in the rate, timing, and spatial distribution of key plastic processes.
Table 2: Neuroplasticity Marker Expression Across Species Under Standardized Conditions
| Neuroplasticity Marker | Mouse | Rat | Marmoset | Macaque | Human |
|---|---|---|---|---|---|
| DCX+ immature neurons in hippocampal dentate gyrus (cells/mm³) | High (~8,000-10,000 at 2 months) [3] | Moderate-High (~7,000-9,000 at 2 months) [133] | Moderate (~2,000-4,000 in young adults) [133] | Low-Moderate (~1,000-2,000 in young adults) [133] | Very Low (<100 in young adults) [3] |
| Ki67+ proliferating cells in hippocampal dentate gyrus (cells/mm³) | ~20,000 at 2 months [3] | ~18,000 at 2 months [133] | ~5,000 in young adults [133] | ~2,500 in young adults [133] | ~500 in young adults [3] |
| Cortical immature neurons (DCX+) | Limited to olfactory bulb pathway, drops rapidly with age [3] | Limited to olfactory bulb pathway, drops rapidly with age [3] | Extends throughout neocortex, maintained at advanced ages [3] | Extends throughout neocortex, maintained at advanced ages [3] | Extends throughout neocortex, maintained at advanced ages [3] |
| Lateral ventricle subventricular zone neurogenic activity | Persists at high rates in aging [3] | Persists at high rates in aging [3] | Drops significantly by 2 years [3] | Drops significantly by 2 years [3] | Drops significantly by 2 years [3] |
| Synaptic plasticity (LTP magnitude) | High (>150% baseline) | High (>150% baseline) | Moderate-High (>140% baseline) | Moderate (>130% baseline) | Moderate (>120% baseline) |
Methodological Framework for Cross-Species Neuroplasticity Validation
Standardized Experimental Protocols for Marker Validation
The establishment of standardized protocols is essential for generating comparable data across species and research laboratories. The following methodologies represent best practices for validating neuroplasticity markers in translational research.
Tissue Processing and Histological Protocol
- Tissue Fixation: Perfusion with 4% paraformaldehyde in 0.1M phosphate buffer (pH 7.4) at 4°C, followed by 24-hour post-fixation and cryoprotection in 30% sucrose [3] [133]. Standardizing postmortem intervals (<6 hours for large-brained species, <2 hours for rodents) is critical for marker preservation.
- Sectioning: Coronal sections at 40μm thickness using a cryostat or freezing microtome, with systematic random sampling throughout regions of interest (e.g., entire hippocampal formation or predefined cortical areas) [133].
- Immunohistochemistry: Standardized protocols for antigen retrieval (citrate buffer, pH 6.0, 80°C for 30 minutes), blocking (5% normal serum, 0.3% Triton X-100 for 2 hours), and primary antibody incubation (72 hours at 4°C with gentle agitation) [3]. Include controls for antibody specificity and minimize batch effects.
Cell Quantification and Imaging Protocol
- Stereological Counting: Apply optical fractionator or disector methods using Stereo Investigator or equivalent software [133]. Sampling fractions should be adjusted to achieve coefficient of error <0.10.
- Confocal Imaging: Standardized imaging parameters (laser power, gain, offset) using 20× and 40× objectives, with z-stack acquisitions at 2μm intervals [3]. Include scale bars and internal intensity standards.
- Multiplex Labeling: Sequential labeling protocols with antibody stripping between rounds to minimize cross-reactivity [134]. Include markers for cell identity (NeuN, GFAP), proliferation (Ki67, pH3), and immaturity (DCX, PSA-NCAM).
Cross-Species Temporal Alignment Protocol
- Developmental Equivalence Modeling: Utilize the Translating Time framework (www.translatingtime.net) to identify equivalent neurodevelopmental stages across species [133]. This model uses event-based scaling to normalize developmental sequences across species with varying lifespans and brain organization periods.
- Age Group Selection: Sample multiple age groups representing main lifespan stages (juvenile, young adult, mature, aged) with appropriate group sizes (n≥6 per group) to account for age-related plasticity declines [3].
- Longitudinal Assessment: When possible, implement within-subject designs using non-invasive markers (MRI, MRS) tracked across equivalent developmental periods [134].
Advanced Cross-Species Research Workflow
The translational workflow for neuroplasticity research requires careful consideration of species differences at each experimental stage. The following diagram illustrates a comprehensive approach for cross-species validation:
Cross-Species Neuroplasticity Validation Workflow
Analytical Framework for Cross-Species Translation
Allometric Scaling Principles for Neuroplasticity Research
The translation of neuroplasticity findings requires careful consideration of allometric scaling principles—the lawful relationships between brain size, developmental duration, and plastic processes across species. Failure to account for these relationships can lead to misinterpretation of species differences as qualitative when they may be quantitative.
Allometric Scaling Model for Plasticity
The allometric scaling model demonstrates how fundamental parameters including brain mass and developmental duration interact with neuroplasticity processes through mathematical relationships. These relationships enable researchers to translate developmental events and plasticity windows across species with different lifespans and brain sizes [133]. For example, the Translating Time project has gathered evidence about the relative progress of neurodevelopmental events across 18 mammalian species, allowing researchers to identify equivalent developmental stages for comparative studies of plasticity mechanisms [133].
Essential Research Reagent Solutions for Neuroplasticity Studies
The selection of appropriate research reagents is critical for generating reliable, reproducible data in neuroplasticity research. The following table details key reagents and their applications in cross-species studies.
Table 3: Essential Research Reagents for Cross-Species Neuroplasticity Validation
| Reagent Category | Specific Examples | Research Application | Cross-Species Reactivity | Technical Considerations |
|---|---|---|---|---|
| Cell Proliferation Markers | Ki67, pH3, BrdU, EdU | Label dividing cells in neurogenic zones | High conservation across mammals | BrdU can incorporate during DNA repair; EdU detection requires click chemistry [3] |
| Immature Neuron Markers | DCX, PSA-NCAM, TUC-4 | Identify newborn, migrating neurons | Variable specificity; DCX labels immature neurons in neurogenic zones but not cortical layer II [3] | DCX+ in cortex may indicate immature neurons, not adult neurogenesis [3] |
| Synaptic Plasticity Markers | PSD-95, Synapsin I, GAP-43 | Quantify synaptic density and structural plasticity | High conservation across mammals | Affected by fixation methods; requires quantitative Western blot or immunohistochemistry |
| Gliogenesis Markers | GFAP, S100β, Olig2, NG2 | Assess glial cell proliferation and maturation | High conservation across mammals | Oligodendrocyte progenitor cells (OPCs) are major dividing population in adult brain parenchyma [3] |
| Neural Stem Cell Markers | Sox2, Nestin, GFAP (radial glia) | Identify neural stem and progenitor cells | Moderate conservation; distribution varies by species | Multiple stem cell populations with different properties and locations |
| Activity-Dependent Markers | c-Fos, Arc, Homer1a | Map recently activated neurons | High conservation across mammals | Variable induction thresholds; sensitive to perfusion quality |
Discussion and Future Directions
Integrated Approaches for Enhanced Translation
The successful translation of neuroplasticity research requires integrated approaches that address the fundamental challenges of cross-species differences, methodological standardization, and temporal alignment. Promising strategies include the development of more complex disease models that better recapitulate human pathology, such as thromboembolic stroke models rather than simple occlusion models, and Alzheimer's models that incorporate vascular pathology [134]. Additionally, the use of outbred animals, aged specimens, and subjects with relevant comorbidities can enhance the translational validity of preclinical findings [134]. The establishment of refined clinical endpoints, combined with biomarkers capable of predicting treatment responses in human patients, will be crucial for the successful clinical implementation of new therapies [134] [135]. Enhanced communication between experimental neuroscientists and clinicians, with a shared understanding and common language, is essential for the success of future research endeavors [135]. Furthermore, comparative approaches spanning multiple species can help identify core conserved mechanisms of plasticity while highlighting species-specific adaptations that may impact therapeutic translation [3] [133].
Concluding Remarks
The translation of neuroplasticity research from preclinical models to human therapeutic applications remains challenging yet increasingly feasible through standardized methodologies, careful species selection, and appropriate temporal alignment. By applying the comparative frameworks and experimental protocols outlined in this guide, researchers can enhance the predictive validity of their preclinical studies and accelerate the development of effective plasticity-based interventions for neurological and psychiatric disorders. The integration of cross-species validation approaches with advanced biomarker development and patient-focused outcome measures represents the most promising path forward for realizing the therapeutic potential of neuroplasticity research.
Conclusion
The systematic validation of neuroplasticity markers across species represents a pivotal frontier in neuroscience and drug development. By integrating foundational mechanisms with advanced measurement techniques and addressing translational challenges, researchers can establish robust biomarker frameworks with enhanced predictive validity. Future directions should focus on standardizing cross-species validation protocols, developing integrated biomarker panels that capture the multidimensional nature of neuroplasticity, and leveraging emerging technologies such as brain-derived extracellular vesicles and single-cell analysis. Success in this endeavor will accelerate the development of novel therapeutics for neurological and psychiatric disorders, ultimately bridging the critical gap between preclinical discovery and clinical application to improve patient outcomes across multiple disease domains.
References
- 1. Neuroplasticity in cognitive and psychological mechanisms of ... [https://pmc.ncbi.nlm.nih.gov/articles/PMC7047599/]
- 2. Occupational Neuroplasticity in the Human Brain: A Critical ... [https://www.frontiersin.org/journals/human-neuroscience/articles/10.3389/fnhum.2020.00215/full]
- 3. From mice to humans: a need for comparable results in ... [https://pmc.ncbi.nlm.nih.gov/articles/PMC11317942/]
- 4. The impact of adult neurogenesis on affective functions [https://www.nature.com/articles/s41380-024-02504-w]
- 5. Identifying new blood biomarkers of neuroplasticity ... [https://www.nature.com/articles/s41598-025-21936-0]
- 6. Qualitative and Quantitative Comparison of Hippocampal ... [https://pmc.ncbi.nlm.nih.gov/articles/PMC8962257/]
- 7. Protocol for a Randomized, Single-Blinded, Controlled Study [https://www.researchprotocols.org/2022/1/e27935/]
- 8. Role of the brain-derived neurotrophic factor at glutamatergic ... [https://pmc.ncbi.nlm.nih.gov/articles/PMC2268077/]
- 9. Cooperation between BDNF and glutamate in the regulation ... [https://pmc.ncbi.nlm.nih.gov/articles/PMC3073261/]
- 10. BDNF impact on synaptic dynamics: extra or intracellular long ... [https://pmc.ncbi.nlm.nih.gov/articles/PMC7079446/]
- 11. PSA–NCAM: Synaptic functions mediated by its ... [https://www.sciencedirect.com/science/article/abs/pii/S135727251200012X]
- 12. The emerging landscape of brain glycosylation [https://pmc.ncbi.nlm.nih.gov/articles/PMC12586631/]
- 13. GAP-43 is essential for the neurotrophic effects of BDNF ... [https://www.nature.com/articles/cdd2008188]
- 14. High abundance of BDNF within glutamatergic ... [https://www.frontiersin.org/journals/cellular-neuroscience/articles/10.3389/fncel.2014.00107/full]
- 15. BRAIN 2025: A Scientific Vision - BRAIN Initiative - NIH [http://braininitiative.nih.gov/vision/nih-brain-initiative-reports/brain-2025-scientific-vision]
- 16. Long-term potentiation ( LTP ) and long-term depression ( LTD ) [https://www.fabriziomusacchio.com/blog/2024-09-15-ltp_and_ltd/]
- 17. Long-term potentiation in the hippocampus [https://www.sciencedirect.com/science/article/pii/S0306452224006882]
- 18. Long-term potentiation in the hippocampus [https://pubmed.ncbi.nlm.nih.gov/39615648/]
- 19. Molecular mechanisms mediating engram ensemble ... [https://www.sciencedirect.com/science/article/abs/pii/S0896627325007536]
- 20. Long Term Potentiation ( LTP ) and Long Term Depression ( LTD ) Cause... [https://operamedphys.org/OMP_2016_03_0039]
- 21. Development of VEP-based biomarkers to assess plasticity ... [https://www.nature.com/articles/s41398-025-03676-x]
- 22. Synaptic Plasticity of D1 and D2 Types of Neurons in the ... [https://pmc.ncbi.nlm.nih.gov/articles/PMC12559841/]
- 23. Experience-dependent neuroplasticity in the hippocampus ... [https://www.eneuro.org/content/early/2025/05/16/ENEURO.0128-25.2025.abstract]
- 24. Structural plasticity of dendritic secretory compartments during ... [https://pmc.ncbi.nlm.nih.gov/articles/PMC6728136/]
- 25. Parallel neuronal structural plasticity with memory trace ... [https://www.nature.com/articles/s41467-025-63542-8]
- 26. Experience-dependent structural plasticity targets dynamic ... [https://www.nature.com/articles/s41467-018-05871-5]
- 27. Functional and structural plasticity induced by audiovisual ... [https://pubmed.ncbi.nlm.nih.gov/40483614/]
- 28. Synaptic modifications in learning and memory [https://pmc.ncbi.nlm.nih.gov/articles/PMC9547722/]
- 29. Dendritic arbor development and synaptogenesis [https://www.sciencedirect.com/science/article/abs/pii/S0959438800001823]
- 30. Structural plasticity of dendritic spines | Frontiers in Biology [https://link.springer.com/article/10.1007/s11515-010-0011-z]
- 31. Identification of markers for neurescence through ... [https://www.nature.com/articles/s41514-025-00235-y]
- 32. Application of Neurotrophic Factors as a Therapeutic ... [https://pmc.ncbi.nlm.nih.gov/articles/PMC12580398/]
- 33. Neurotrophin signaling through the p75 ... [https://www.sciencedirect.com/science/article/abs/pii/S0301008202000163]
- 34. The p75 Neurotrophin Receptor Facilitates TrkB Signaling ... [https://pmc.ncbi.nlm.nih.gov/articles/PMC6828739/]
- 35. Differential contribution of TrkB and p75 NTR to BDNF- ... [https://www.frontiersin.org/journals/molecular-neuroscience/articles/10.3389/fnmol.2023.1271820/full]
- 36. Neurotrophic factor biomarkers for ischemic stroke ... [https://www.nature.com/articles/s41598-025-86935-7]
- 37. Involvement of TrkB- and p75NTR-signaling pathways in ... [https://www.nature.com/articles/srep03185]
- 38. Brain-derived neurotrophic factor prevents LPS-induced ... [https://www.frontiersin.org/journals/cellular-neuroscience/articles/10.3389/fncel.2025.1675003/full]
- 39. Critical Period - an overview [https://www.sciencedirect.com/topics/psychology/critical-period]
- 40. Shifting Developmental Trajectories During Critical Periods ... [https://www.frontiersin.org/journals/cellular-neuroscience/articles/10.3389/fncel.2020.00283/full]
- 41. Critical Periods Revisited: Implications for Intervention with ... [https://pmc.ncbi.nlm.nih.gov/articles/PMC3758247/]
- 42. iPlasticity: Induced juvenile‐like plasticity in the adult brain as ... [https://pmc.ncbi.nlm.nih.gov/articles/PMC6174980/]
- 43. Rejuvenation of plasticity in the brain: opening the critical period [https://pmc.ncbi.nlm.nih.gov/articles/PMC6361689/]
- 44. Cross-species Approaches to Cognitive Neuroplasticity ... [https://pmc.ncbi.nlm.nih.gov/articles/PMC4779436/]
- 45. Bridging animal and human models of exercise-induced brain ... [https://pmc.ncbi.nlm.nih.gov/articles/PMC4565723/]
- 46. Psychedelics Reverse the Polarity of Long-Term Synaptic ... [https://www.eneuro.org/content/12/10/ENEURO.0047-25.2025]
- 47. Expectations related to the use of theta burst stimulation ... [https://www.sciencedirect.com/science/article/abs/pii/S1388245725006200]
- 48. Transcranial burst electrical stimulation contributes to ... [https://pmc.ncbi.nlm.nih.gov/articles/PMC10749301/]
- 49. Transcranial direct current stimulation versus intermittent ... [https://www.elsevier.es/es-revista-international-journal-clinical-health-psychology-355-articulo-transcranial-direct-current-stimulation-versus-S1697260022000424?referer=buscador]
- 50. a systematic review and network meta-analysis [https://pubmed.ncbi.nlm.nih.gov/39910020/]
- 51. Electrophysiological approaches to informing therapeutic ... [https://www.nature.com/articles/s41531-024-00847-3]
- 52. Theta-burst direct electrical stimulation remodels human ... [https://www.nature.com/articles/s41467-024-51443-1]
- 53. Comparison of Physiological Brain Responses Evoked by ... [https://pmc.ncbi.nlm.nih.gov/articles/PMC12054683/]
- 54. Amplitude of Low Frequency Fluctuations (ALFF) and ... [https://fcp-indi.github.io/docs/latest/user/alff]
- 55. A comparative study of amplitude of low-frequence fluctuation ... [https://pmc.ncbi.nlm.nih.gov/articles/PMC9462398/]
- 56. Reliability comparison of spontaneous brain activities ... [https://www.sciencedirect.com/science/article/abs/pii/S1053811915006552]
- 57. Aberrant amplitude low-frequency fluctuation (ALFF) and ... [https://atm.amegroups.org/article/view/54639/html]
- 58. Investigating the predictive value of different resting-state ... [https://www.nature.com/articles/s41398-018-0362-9]
- 59. A multi-site resting state fMRI study on the amplitude of low ... [https://pmc.ncbi.nlm.nih.gov/articles/PMC3737471/]
- 60. Predicting and Validating Protein Interactions Using Network ... [https://pmc.ncbi.nlm.nih.gov/articles/PMC2435280/]
- 61. Sensitivity analysis on protein-protein interaction networks ... [https://bmcbioinformatics.biomedcentral.com/articles/10.1186/s12859-025-06140-1]
- 62. The STRING database in 2025: protein networks with ... [https://pmc.ncbi.nlm.nih.gov/articles/PMC11701646/]
- 63. Digital profiling of gene expression from histology images ... [https://www.nature.com/articles/s41467-024-54182-5]
- 64. Evaluation of Genotype-Based Gene Expression Model ... [https://pmc.ncbi.nlm.nih.gov/articles/PMC8536060/]
- 65. Selection and Validation of Reference Genes for ... [https://www.nature.com/articles/s41598-020-58328-5]
- 66. A new diagnostic tool for brain disorders: extracellular ... [https://www.frontiersin.org/journals/molecular-neuroscience/articles/10.3389/fnmol.2023.1194210/full]
- 67. Brain-derived extracellular vesicles: A promising avenue for ... [https://pmc.ncbi.nlm.nih.gov/articles/PMC12407533/]
- 68. Advances in Blood-Based Biomarkers for Alzheimer's and ... [https://www.quanterix.com/advances-in-blood-based-biomarkers-for-alzheimers-and-parkinsons-diseases/]
- 69. Circular Genomics to Unveil New Data Highlighting ... [https://www.prnewswire.com/news-releases/circular-genomics-to-unveil-new-data-highlighting-circular-rnas-as-a-transformative-new-class-of-blood-based-biomarkers-for-alzheimers-disease-at-ctad-2025-302624305.html]
- 70. A cross-species framework for investigating perceptual ... [https://elifesciences.org/reviewed-preprints/105116]
- 71. Emerging Technologies in Biomarker Discovery You ... [https://blog.crownbio.com/emerging-technologies-in-biomarker-discovery-you-should-know-about]
- 72. Blood Based Biomarkers Market [https://www.factmr.com/report/blood-based-biomarkers-market]
- 73. How blood based biomarkers are reshaping the ... [https://myadlm.org/education/all-webinars/webinars/2025/november/how-blood-based-biomarkers-are-reshaping-the-alzheimers-testing-pathway]
- 74. Development of VEP-based biomarkers to assess plasticity ... [https://pmc.ncbi.nlm.nih.gov/articles/PMC12537939/]
- 75. Neuroplasticity [https://cellectricon.com/our-services/neuroplasticity/]
- 76. The pharmacology of neuroplasticity induced by non-invasive ... [https://pmc.ncbi.nlm.nih.gov/articles/PMC3487028/]
- 77. Towards an understanding of psychedelic-induced ... [https://www.nature.com/articles/s41386-022-01389-z]
- 78. Small-Molecule Probes as Pharmacological Tools for the ... [https://pmc.ncbi.nlm.nih.gov/articles/PMC10644459/]
- 79. Systematic literature review reveals suboptimal use of ... [https://www.nature.com/articles/s41467-023-38952-1]
- 80. Serotonin Receptors in Areas of the Emotion Regulation ... [https://pmc.ncbi.nlm.nih.gov/articles/PMC12267679/]
- 81. Mapping the cellular basis of species differences in ... [https://www.nature.com/articles/s41598-025-06367-1]
- 82. Hippocampal structure, patterns of the calcium-binding ... [https://www.frontiersin.org/journals/neuroanatomy/articles/10.3389/fnana.2025.1641787/full]
- 83. Reflection and Experimental Rigor Are Our AiMS [https://www.eneuro.org/content/12/10/ENEURO.0333-25.2025]
- 84. Evaluating analytic strategies to obtain high-resolution ... [https://www.nature.com/articles/s42003-025-08322-2]
- 85. A systematic review of animal and human data comparing ... [https://www.nature.com/articles/s41598-024-60389-9]
- 86. Adaptation and maladaptation insights from brain plasticity [https://pubmed.ncbi.nlm.nih.gov/21741552/]
- 87. Non-invasive Brain Stimulation, a Tool to Revert ... [https://www.frontiersin.org/journals/human-neuroscience/articles/10.3389/fnhum.2016.00376/full]
- 88. Maladaptive Neuroplasticity Under Stress: Insights into ... [https://pubmed.ncbi.nlm.nih.gov/40545507/]
- 89. Maladaptive Plasticity and Neuropathic Pain - PMC [https://pmc.ncbi.nlm.nih.gov/articles/PMC4748137/]
- 90. Psychostimulant Drugs and Neuroplasticity - PMC [https://pmc.ncbi.nlm.nih.gov/articles/PMC4058673/]
- 91. Neuroplasticity and Nervous System Recovery: Cellular ... [https://pmc.ncbi.nlm.nih.gov/articles/PMC12025631/]
- 92. PLOS One - Research journals [https://journals.plos.org/plosone/article?id=10.1371/journal.pone.0269090]
- 93. Tools for discovery of novel targets and molecules involved ... [https://www.nature.com/articles/d44224-024-00001-7]
- 94. Validation of hippocampal biomarkers of cumulative ... [https://www.sciencedirect.com/science/article/pii/S0149763418301994]
- 95. From animal models to human individuality: Integrative ... [https://www.sciencedirect.com/science/article/pii/S089662732400727X]
- 96. Genetic and environmental influences interact with age ... - PMC [https://pmc.ncbi.nlm.nih.gov/articles/PMC4820961/]
- 97. Evolutionary sex bias in cognitive response to new ... [https://pmc.ncbi.nlm.nih.gov/articles/PMC12590812/]
- 98. Environmental influences on the pace of brain development [https://www.nature.com/articles/s41583-021-00457-5]
- 99. Brain Neuroplasticity Leveraging Virtual Reality and ... [https://www.mdpi.com/1424-8220/24/17/5725]
- 100. The experimental research on neuroplasticity in rats ... [https://pmc.ncbi.nlm.nih.gov/articles/PMC6938820/]
- 101. Identifying new blood biomarkers of neuroplasticity associated ... [https://pmc.ncbi.nlm.nih.gov/articles/PMC12575871/]
- 102. Improving reproducibility in animal research by splitting the ... [https://www.nature.com/articles/s41598-020-73503-4]
- 103. Reproducibility of preclinical animal research improves ... [https://pmc.ncbi.nlm.nih.gov/articles/PMC5823461/]
- 104. Biomarkers of Angiogenesis and Neuroplasticity as Promising ... [https://pmc.ncbi.nlm.nih.gov/articles/PMC8068953/]
- 105. Multi-omics strategies for biomarker discovery and application ... [https://pmc.ncbi.nlm.nih.gov/articles/PMC12638490/]
- 106. A review on multi-omics integration for aiding study design ... [https://pmc.ncbi.nlm.nih.gov/articles/PMC12372284/]
- 107. Advancements in multi-omics research to address ... [https://www.frontiersin.org/journals/aging-neuroscience/articles/10.3389/fnagi.2025.1591796/full]
- 108. Lost in Translation: Turning Multi-omic Chaos into Clinical ... [https://www.precisionformedicine.com/blog/lost-in-translation-turning-multi-omics-chaos-into-clinical-clarity]
- 109. Combined multi-omics and brain pathology reveal novel ... [https://www.nature.com/articles/s41598-025-21983-7]
- 110. Disease prediction with multi-omics and biomarkers ... [https://www.nature.com/articles/s41588-024-01898-1]
- 111. Multitask benchmarking of single-cell multimodal omics ... [https://www.nature.com/articles/s41592-025-02856-3]
- 112. Benchmarking Machine Learning Methods for Multi-Omics ... [https://www.sciencedirect.com/science/article/pii/S1877050925016199]
- 113. Multi-Omics analysis and in vitro validation reveal diagnostic ... [https://hereditasjournal.biomedcentral.com/articles/10.1186/s41065-025-00535-z]
- 114. Neuroimaging and biological markers of different paretic hand ... [https://jneuroengrehab.biomedcentral.com/articles/10.1186/s12984-025-01682-0]
- 115. Deficit of Inhibition as a Marker of Neuroplasticity (DEFINE ... [https://www.frontiersin.org/journals/neurology/articles/10.3389/fneur.2021.695406/full]
- 116. Bioinformatics and experimental validation identify ... [https://www.frontiersin.org/journals/aging-neuroscience/articles/10.3389/fnagi.2025.1566929/full]
- 117. Cross-species evidence from human and rat brain ... [https://pmc.ncbi.nlm.nih.gov/articles/PMC6098161/]
- 118. Cross-species analysis uncovers the mitochondrial stress ... [https://www.sciencedirect.com/science/article/pii/S2352289524000390]
- 119. A cross-species approach using an in vivo evaluation ... [https://pmc.ncbi.nlm.nih.gov/articles/PMC9606478/]
- 120. Obtaining Human Ischemic Stroke Gene Expression ... [https://www.nature.com/articles/srep29693]
- 121. Genetic and neurophysiological biomarkers of neuroplasticity ... [https://pmc.ncbi.nlm.nih.gov/articles/PMC9133188/]
- 122. Neuroplasticity of Brain Networks Through Exercise [https://pmc.ncbi.nlm.nih.gov/articles/PMC12390317/]
- 123. Neuroplasticity and the microbiome: how microorganisms ... [https://pmc.ncbi.nlm.nih.gov/articles/PMC12405295/]
- 124. Illuminating the Shadows of Neuroscience: How Curiosity ... [https://www.eneuro.org/content/12/4/ENEURO.0056-25.2025]
- 125. Differentiating mathematical mindset, growth ... [https://www.frontiersin.org/journals/psychology/articles/10.3389/fpsyg.2025.1598817/full]
- 126. Changes in Neural Activities and Neuroplasticity Related to ... [https://www.sciencedirect.com/science/article/pii/S2667174325001260]
- 127. Diagnostic Accuracy of Blood-Based Biomarker Panels [https://pmc.ncbi.nlm.nih.gov/articles/PMC8963375/]
- 128. Development of a serum protein biomarker panel for the ... [https://www.nature.com/articles/s41598-025-19631-1]
- 129. Biomarker Panel Development for High-Throughput ... [https://www.sepscience.com/biomarker-panel-development-for-high-throughput-diagnostic-applications-12050]
- 130. Apps by Olink [https://olink.com/software/overview]
- 131. Biomarker Filter - Bioinformatics Software [https://digitalinsights.qiagen.com/products-overview/discovery-insights-portfolio/analysis-and-visualization/qiagen-ipa/features/biomarker-filter/]
- 132. Harnessing neuroplasticity for clinical applications - PMC [https://pmc.ncbi.nlm.nih.gov/articles/PMC3102236/]
- 133. Comparing Adult Hippocampal Neurogenesis Across ... [https://www.frontiersin.org/journals/neuroscience/articles/10.3389/fnins.2018.00706/full]
- 134. Most prominent challenges in translational neuroscience and ... [https://pmc.ncbi.nlm.nih.gov/articles/PMC12373390/]
- 135. Most prominent challenges in translational neuroscience ... [https://www.explorationpub.com/Journals/en/Article/1006106]