Immunomagnetic Separation for Neural Cell Purification: A Comprehensive Guide for Researchers and Drug Developers
This article provides a comprehensive overview of immunomagnetic separation for purifying specific neural cell types, tailored for researchers and drug development professionals.
Immunomagnetic Separation for Neural Cell Purification: A Comprehensive Guide for Researchers and Drug Developers
Abstract
This article provides a comprehensive overview of immunomagnetic separation for purifying specific neural cell types, tailored for researchers and drug development professionals. It covers the foundational principles of magnetic-activated cell sorting (MACS), detailing its core mechanism and advantages for neural applications. The guide delivers step-by-step methodological protocols for isolating key neural cells like microglia and olfactory neural progenitors, alongside advanced applications in single-cell analysis and drug discovery. It further addresses common troubleshooting scenarios and optimization strategies to maximize cell viability and purity. Finally, the content offers a critical validation of the technique by comparing it with FACS and other methods, evaluating its impact on downstream cellular functions and its efficacy in preserving native cell phenotypes for reliable research outcomes.
Principles and Potentials of Immunomagnetic Separation in Neuroscience
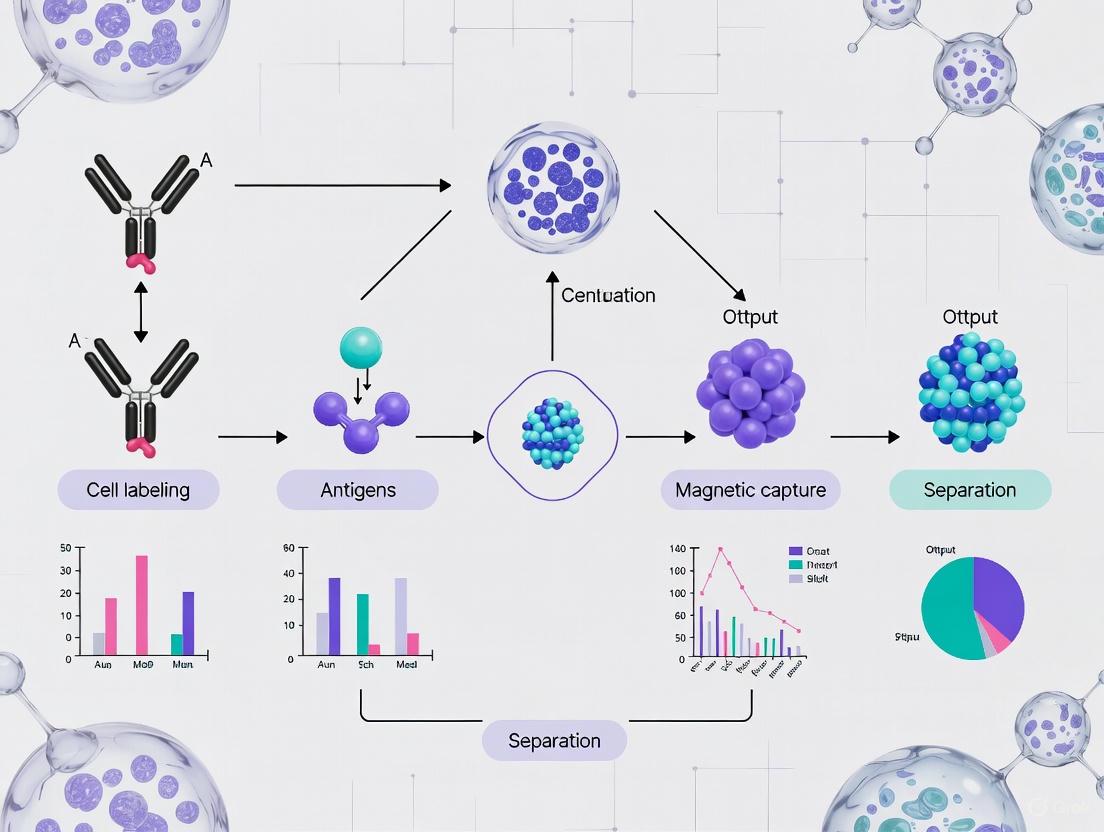
Immunomagnetic separation (IMS) is a powerful laboratory technique that efficiently isolates specific target cells, such as neural cells, from a complex heterogeneous mixture. The core principle relies on the use of superparamagnetic beads coated with antibodies that bind selectively to surface antigens on the target cells [1] [2]. When exposed to an external magnetic field, these bead-bound cells are retained and concentrated, while non-target cells are washed away [3]. This method provides high specificity, reproducibility, and efficiency, making it indispensable for purifying specific neural cell types for research and therapeutic development [4]. Unlike column-based isolation technologies, IMS is a column-free system that simplifies the process, reducing processing time and improving cell viability [5].
Core Mechanism of Immunomagnetic Separation
Principle of Operation
The fundamental mechanism of IMS can be deconstructed into a series of specific biochemical and physical steps. The process begins with the preparation of superparamagnetic beads, typically composed of an iron-containing core surrounded by a polymer shell that allows for the covalent attachment of biological macromolecules [1]. These beads, usually 2-5 μm in diameter, are then coated with primary antibodies, lectins, or streptavidin specific to the target cell's surface markers [1] [2].
When added to a cell suspension, the antibody-coated beads bind to their corresponding antigens present on the target cells, forming a stable magnetic bead-antibody-antigen complex [2]. This binding occurs during an incubation period typically lasting 10-60 minutes, which must be optimized to balance capture efficiency and minimize non-specific binding [2]. Following incubation, the application of a magnetic field immobilizes the complexed target cells against the vessel wall, allowing the removal of unbound components through washing steps [1] [3]. The purified cells can then be eluted for downstream applications, with typical viability ranging from 95-99% and purity yields of 60-99% [3].
Magnetic Bead Technology and Antibody Coupling
The efficiency of IMS fundamentally depends on the properties of the magnetic beads and their antibody coupling. Superparamagnetic beads exhibit magnetic properties only in the presence of an external magnetic field, preventing aggregation during incubation and ensuring a homogeneous suspension [2]. Bead size significantly impacts separation efficiency; larger beads (>2μm) are commonly used in systems like Dynabeads, while smaller beads (<100nm) are employed in MACS systems requiring stronger magnetic fields [1].
Antibodies can be coupled to magnetic beads through several methods, with the direct and indirect approaches being most common [3]. In the direct method, antibodies are covalently bound to the beads, oriented with their Fc region toward the magnetic particle and Fab regions outward for optimal antigen binding [3]. Common covalent binding strategies include:
- Adsorption on hydrophobic magnetic particles
- Chemical conjugation to activated surfaces (e.g., tosyl-activated, carboxy-functionalized)
- Streptavidin-biotin interaction for biotinylated antibodies
- Protein A/G immobilization via Fc region binding
The indirect method involves first incubating the cell suspension with primary antibodies, followed by capture with magnetic particles coated with secondary antibodies, protein A/G, or streptavidin (for biotinylated primary antibodies) [3]. This approach often provides higher efficiency for cells with low surface antigen density [3].
Quantitative Performance Data of IMS
The performance of immunomagnetic separation systems varies based on the target cell type, sample matrix, and specific protocol parameters. The following table summarizes key quantitative metrics from established applications:
Table 1: Performance Metrics of Immunomagnetic Separation Systems
| Target | Sample Type | Incubation Time | Capture Efficiency | Purity/Yield | References |
|---|---|---|---|---|---|
| Microglia | Mouse brain tissue | 15-30 min | >90% | High purity via CD11b+ selection | [6] |
| Astrocytes | Mouse brain tissue | 15-30 min | >90% | High purity via ACSA-2 selection | [6] |
| Neurons | Mouse brain tissue | Sequential protocol | N/A | High purity via negative selection | [6] |
| E. coli O157 | Food samples | 10-60 min | 40-91%* | Culture/enrichment required | [2] |
| L. monocytogenes | Pure culture | 10-60 min | ~91% (high load) | Reduced to 40-70% at lower cell loads | [2] |
| General cells | Cell suspension | 5-60 min | 60-99% | 95-99% viability typical | [3] |
*Capture efficiency highly dependent on initial bacterial load
The relationship between incubation parameters and efficiency follows predictable trends. Extended incubation time generally increases capture yield but may also increase non-specific binding [2]. Similarly, additional washing steps reduce non-specific binding but may decrease recovery efficiency due to loss of bound cells [2]. These parameters must be optimized for each specific application and sample matrix.
Table 2: Factors Affecting IMS Efficiency and Optimization Strategies
| Factor | Effect on Separation | Optimization Strategy |
|---|---|---|
| Bead size | Larger beads (>2μm): easier separationSmaller beads (<100nm): require stronger magnetic fields | Select based on available equipment and application requirements [1] |
| Antibody concentration | Low: reduced capture efficiencyHigh: increased non-specific binding | Titrate to determine optimal concentration for target cell [2] |
| Incubation time | Short: reduced yieldLong: increased non-specific binding | Balance based on application needs (typically 10-60 min) [2] |
| Sample matrix | Complex samples may inhibit binding | Pre-enrichment or sample dilution may be necessary [2] |
| Cell surface antigen density | Low density reduces capture efficiency | Use indirect method or signal amplification [3] |
| Washing steps | Insufficient: high backgroundExcessive: cell loss | Optimize number and stringency of washes [2] |
Research Reagent Solutions for Neural Cell Isolation
The successful implementation of IMS for neural cell purification requires specific reagents tailored to the target cell types. The following table details essential materials and their functions:
Table 3: Essential Research Reagents for Immunomagnetic Separation of Neural Cells
| Reagent/Material | Function/Description | Application Example |
|---|---|---|
| CD11b (ITGAM) Microbeads | Magnetic beads conjugated to CD11b antibody for positive selection of microglia | Isolation of microglial cells from mixed neural cell population [6] |
| ACSA-2 Microbeads | Magnetic beads with Astrocyte Cell Surface Antigen-2 antibody for astrocyte selection | Purification of astrocytes from CD11b-negative fraction [6] |
| Neuron Isolation Beads | Biotin-antibody cocktail for non-neuronal cell depletion | Negative selection to purify neurons [6] |
| Magnetic Separator | Device generating high-gradient magnetic field for bead retention | Column-based systems for positive and negative selection [5] [6] |
| Separation Columns | Column matrix placed within magnetic field for cell retention | Retention of labeled cells during washing steps [6] |
| Enzymatic Digestion Cocktail | Trypsin-based solution for tissue dissociation | Initial breakdown of brain tissue into single-cell suspension [6] |
| Cell Strainers | Filters for removing cell clumps post-digestion | Creation of single-cell suspension before IMS [6] |
Detailed Protocol for Isolation of Neural Cells
This protocol outlines a tandem isolation approach for sequentially purifying microglia, astrocytes, and neurons from the same mouse brain tissue sample, adapted from established methodologies [6].
Sample Preparation and Tissue Dissociation
- Dissection: Euthanize 9-day-old mice according to approved ethical guidelines. Carefully remove the brain and dissect desired regions (e.g., prefrontal cortex, hippocampus).
- Meninges Removal: Excise meningeal layers completely to avoid contamination.
- Mechanical Disruption: Mince tissue finely using sterile scalpel or razor blade in cold dissection buffer.
- Enzymatic Digestion: Incubate tissue with 0.25% trypsin solution for 15 minutes at 37°C with gentle agitation.
- Reaction Termination: Add trypsin inhibitor or serum-containing medium to halt digestion.
- Trituration and Filtration: Gently triturate tissue through pipette tips of decreasing diameter. Pass suspension through 70μm cell strainer to remove clumps.
- Centrifugation: Centrifuge at 300 × g for 10 minutes. Resuspend pellet in appropriate buffer for immunomagnetic separation.
Sequential Immunomagnetic Separation
A. Microglia Isolation (CD11b+ Selection)
- Incubation: Mix cell suspension with CD11b microbeads (20μL per 10^7 cells). Incubate for 15 minutes at 4-8°C.
- Column Preparation: Place separation column in magnetic field. Rinse with appropriate buffer.
- Separation: Apply cell-bead suspension to column. Collect flow-through (CD11b-negative cells) for subsequent astrocyte and neuron isolation.
- Washing: Wash column with buffer 3 times while maintaining magnetic field.
- Elution: Remove column from magnetic field. Elute CD11b+ microglial cells by pushing plunger through column with buffer.
B. Astrocyte Isolation (ACSA-2+ Selection)
- Incubation: Take CD11b-negative fraction and incubate with ACSA-2 microbeads (20μL per 10^7 cells) for 15 minutes at 4-8°C.
- Separation: Apply to fresh column in magnetic field. Collect flow-through (CD11b-/ACSA-2- cells) for neuron isolation.
- Washing and Elution: Repeat washing and elution steps as in microglia protocol to obtain purified astrocytes.
C. Neuron Isolation (Negative Selection)
- Incubation: Take CD11b-/ACSA-2- cell fraction and incubate with non-neuronal cell biotin-antibody cocktail (10μL per 10^7 cells) for 10 minutes at 4-8°C.
- Bead Addition: Add anti-biotin microbeads (10μL per 10^7 cells). Incubate for 15 minutes at 4-8°C.
- Separation: Apply to fresh column in magnetic field. Collect flow-through containing unlabeled neurons.
- Washing: Pass additional buffer through column to maximize neuron recovery.
Post-Isolation Processing and Validation
- Cell Counting and Viability: Count cells using hemocytometer or automated cell counter. Assess viability via trypan blue exclusion (expect >95% viability).
- Culture: Plate cells in appropriate culture vessels pre-coated with substrate (e.g., poly-D-lysine for neurons). Use cell-type specific media formulations.
- Purity Validation: Confirm cell identity using immunocytochemistry for cell-specific markers:
- Microglia: IBA-1, TMEM119
- Astrocytes: GFAP
- Neurons: MAP-2
- Functional Assays: Proceed with downstream applications as quickly as possible to minimize phenotypic changes.
Troubleshooting and Technical Considerations
Common Challenges and Solutions
- Low Yield: Optimize antibody concentration and incubation time. Verify tissue dissociation efficiency. Consider animal age (9-day-old mice recommended) [6].
- Reduced Viability: Minimize processing time. Use pre-cooled buffers. Avoid excessive mechanical force during trituration.
- Non-specific Binding: Include blocking steps with BSA or serum. Optimize washing stringency. Use Fc receptor blocking agents for immune cells.
- Rapid Phenotypic Changes: Process cells quickly after isolation. Use appropriate culture conditions immediately after separation [6].
Advantages and Limitations
IMS offers significant advantages for neural cell isolation, including high specificity, excellent viability maintenance, compatibility with downstream applications (PCR, flow cytometry, culture), and ability to perform sequential isolations from single tissue samples [3] [6]. However, limitations include batch-to-batch variability, requirement for specific surface markers, relatively high cost for magnetic beads, and potential need for specialized equipment [2] [6].
Immunomagnetic separation represents a robust methodology for purifying specific neural cell types with high efficiency and precision. The core mechanism leveraging antibody-coated magnetic beads and magnetic fields provides researchers with a powerful tool to obtain well-defined neural cell populations for studying cellular behavior, signaling pathways, and disease mechanisms. The sequential protocol outlined enables comprehensive investigation of multiple neural cell types from single tissue samples, maximizing research output while maintaining cellular integrity. As magnetic bead technologies advance, IMS continues to evolve as an essential technique in neuroscience research and drug development.
Immunomagnetic separation has emerged as a cornerstone technique for the purification of specific neural cell types, enabling critical advances in neuroscience research and drug development. The pursuit of high-purity neuronal and glial populations is fundamental to modeling neurodegenerative diseases, screening pharmaceutical compounds, and developing regenerative therapies. Unlike other cell separation methods, immunomagnetic separation offers a unique combination of gentleness on delicate neural cells, remarkable scalability from research to potential clinical applications, and significant cost-effectiveness—attributes particularly vital when working with precious human-derived neural samples. This application note details the specific advantages of immunomagnetic separation for neural tissue applications, providing structured experimental data, standardized protocols, and essential resource guidance to facilitate its implementation in basic and translational research settings.
Core Advantages of Immunomagnetic Separation for Neural Research
Gentleness on Cells: Preserving Delicate Neural Phenotypes
The gentle nature of immunomagnetic separation makes it uniquely suited for working with sensitive neural cells, which often suffer from reduced viability and altered physiology when subjected to the shear stresses of fluorescence-activated cell sorting (FACS) or the enzymatic treatments required for other purification methods.
Maintained Viability and Function: Negative selection methods, which deplete unwanted cell types without labeling the target neural population, leave cells completely unbound by antibodies or magnetic particles [7]. This is crucial for downstream functional assays such as electrophysiology, where antibody binding could interfere with receptor function, or for cell transplantation studies, where maximal viability is essential.
Minimal Activation Stress: For neural cells, particularly those involved in immune interactions like microglia, avoiding unintended activation is paramount. Positive selection can directly activate intracellular signaling pathways if antibodies bind to surface receptors involved in cell signaling [7]. Negative selection circumvents this risk entirely, preserving the native state of the target cells.
Structural Integrity: The minimal mechanical forces involved in magnetic separation compared to FACS help maintain the delicate cytoarchitecture of primary neurons, including their nascent neurites, which are essential for establishing proper networks in culture [8].
Scalability: From Research to Therapeutic Applications
Immunomagnetic separation platforms offer exceptional scalability, accommodating everything from small-scale pilot experiments to larger preparations needed for pharmaceutical screening or potential therapeutic applications.
Table 1: Scalability Profiles of Immunomagnetic Separation Systems
| Scale of Operation | Typical Cell Yield | Processing Time | Compatible Downstream Applications |
|---|---|---|---|
| Micro-scale (Research) | 10^5 - 10^7 cells | 15-30 minutes [7] | Single-cell RNA-seq, primary culture, patch-clamp electrophysiology |
| Mid-scale (Screening) | 10^7 - 10^8 cells | 1-2 hours | Bulk RNA/protein analysis, medium-throughput drug screening, biobanking |
| Large-scale (Therapeutic) | >10^8 cells | Several hours | Cell therapy manufacturing, high-content screening campaigns |
The scalability is further enhanced by the compatibility of immunomagnetic separation with various starting samples, including primary tissue dissociates, induced pluripotent stem cell (iPSC)-derived neural cultures, and brain organoids [9] [10]. As the field moves toward personalized medicine, the ability to process multiple small batches efficiently—a strength of magnetic separation systems—becomes increasingly valuable [11].
The economic advantages of immunomagnetic separation make advanced neural cell purification accessible to a broader range of laboratories and applications.
Reduced Capital Equipment: Unlike FACS, which requires a substantial investment in sophisticated instrumentation and dedicated operators, immunomagnetic separation needs only a magnetic stand, a ubiquitous piece of lab equipment [12]. This dramatically lowers the barrier to entry.
Operational Efficiency: The speed of immunomagnetic separation, with some protocols taking as little as 15 minutes for mouse cells, translates to significant time savings [7]. This efficiency allows researchers to process samples quickly, minimizing cell stress and maximizing the number of experiments performed. The technique is also amenable to automation, reducing hands-on time and improving reproducibility [11].
Integrated Workflows for Complex Purification: For isolating complex neural subsets defined by multiple markers, such as CD4+CD127lowCD25+ regulatory T cells, combination kits that sequentially employ negative and positive selection are available [7]. This integrated approach is more cost-effective than developing and validating a multi-step FACS panel, while often yielding higher purity and recovery.
Experimental Data & Performance Metrics
Table 2: Quantitative Comparison of Cell Separation Techniques for Neural Applications
| Parameter | Immunomagnetic Separation (Positive) | Immunomagnetic Separation (Negative) | Fluorescence-Activated Cell Sorting (FACS) | Immunopanning |
|---|---|---|---|---|
| Typical Purity | >90% [7] | 80-95% [7] | >98% | >95% [8] |
| Cell Viability | High | Very High [7] | Moderate to High | High |
| Throughput | High | Very High [7] | Low to Medium | Medium |
| Processing Speed | Fast (20-90 min) | Very Fast (8-15 min) [7] | Slow (hours) | Medium (hours) [8] |
| Antibody Bound to Target Cell | Yes | No [7] | Yes | Yes |
| Relative Cost per Sample | Low | Low | High | Medium |
| Suitability for Sensitive Assays | Good | Excellent [7] | Good | Good |
Detailed Protocols for Neural Cell Purification
Protocol 1: Rapid Pre-Enrichment of Neural Cells via Negative Selection
This protocol is ideal for quickly isolating a target neural population without antibody labeling prior to FACS or single-cell sequencing, maximizing recovery and minimizing activation.
Workflow Overview
Reagents and Equipment
- Single-cell suspension from neural tissue or iPSC-derived cultures.
- Commercial negative selection kit or custom antibody cocktail against non-target cells.
- Magnetic separation stand [12].
- Cell culture medium (e.g., Neurobasal for neurons).
Step-by-Step Procedure
- Preparation: Create a single-cell suspension from your starting material (e.g., dissociated brain tissue or enzymatically treated neural organoids) using standard dissociation protocols. Pass the suspension through a 40-μm cell strainer to remove aggregates.
- Antibody Incubation: Resuspend up to 10^8 cells in the recommended volume of buffer (e.g., PBS with 2% FBS). Add the pre-titrated antibody cocktail for negative selection. The cocktail should contain antibodies that bind all unwanted cell types but do not bind the desired neural cells [7]. Mix well and incubate for 15 minutes at 4°C.
- Magnetic Bead Binding: Add magnetic beads conjugated with a secondary antibody or streptavidin (if using biotinylated primary antibodies). Use a bead-to-cell ratio according to the manufacturer's instructions. Incubate for 15 minutes at 4°C with gentle agitation.
- Magnetic Separation: Bring the total volume to 5-10 mL with buffer. Place the tube in the magnetic separation rack for 2-5 minutes. A strong magnet may require as little as 60 seconds [12].
- Collection: In a single, swift motion, pour the unbound cell fraction (containing the target neural cells) into a new tube. Leave the tube in the magnet for the recommended time to ensure the bead-bound cells are fully retained.
- Analysis: Determine the purity and viability of the collected cells using a hemocytometer or automated cell counter. The resulting cell population is now enriched for the target neural type and ready for immediate downstream use.
Protocol 2: High-Purity Isolation via Positive Selection
This protocol is used when the highest purity is required and antibody binding to the target cell is not a concern for downstream applications.
Workflow Overview
Reagents and Equipment
- Target-specific antibody against a defined neural surface antigen (e.g., NCAM for neurons).
- Magnetic particles conjugated to a secondary antibody or streptavidin.
- Magnetic separation stand.
- Cell culture medium and wash buffers.
Step-by-Step Procedure
- Cell Preparation and Pre-clearing: Prepare a single-cell suspension as in Protocol 1. A pre-clearing step is highly recommended to reduce non-specific binding [12]. Incubate the lysate with plain magnetic beads for 20 minutes, then remove the beads using the magnet before proceeding.
- Target Labeling: Incubate the pre-cleared cell suspension with the primary antibody against the specific neural cell surface marker. The antibody can be directly conjugated to magnetic particles or used as a biotinylated primary antibody followed by streptavidin-magnetic beads. Incubate for 15-30 minutes at 4°C.
- Magnetic Separation and Washing: Place the tube in the magnetic stand. Once the solution clears, carefully aspirate the supernatant containing unbound cells. Without disturbing the bead-bound cell pellet, wash the cells 3-5 times with 500 μL of buffer [12]. Keep the tube on ice between washes.
- Cell Elution: After the final wash, remove the tube from the magnet and resuspend the bead-cell complex in an appropriate culture medium or buffer. The positively selected cells can now be used for downstream applications. For some applications, cells can be cultured directly with the beads, which may detach over time.
The Scientist's Toolkit: Essential Research Reagents
Table 3: Key Reagent Solutions for Immunomagnetic Separation of Neural Cells
| Reagent / Material | Function | Application Notes |
|---|---|---|
| Magnetic Separation Stand | Generates a magnetic field to retain labeled cells/beads. | Choose a design compatible with your sample volume (e.g., microcentrifuge tubes, larger tubes) [12]. |
| Cell-Specific Antibody Cocktails | Recognizes specific cell surface antigens for positive or negative selection. | For neural cells, common targets include NCAM (neurons), A2B5 (glial precursors), and O4 (oligodendrocytes). |
| Magnetic Particles | Provides the paramagnetic component for physical separation. | Available in various sizes and conjugations (e.g., Protein A/G, streptavidin, anti-species Ig). Smaller particles are gentler on cells. |
| 1X Cell Lysis Buffer | Lyses cells for intracellular target immunoprecipitation. | Used with protease/phosphatase inhibitors for protein studies [12]. |
| Protein A/G Magnetic Beads | Binds antibody Fc regions for immunoprecipitation. | Protein A is for rabbit antibodies; Protein G is for mouse IgG [12]. |
| Isotype Control Antibodies | Serves as negative controls to confirm specificity. | Critical for validating that observed effects are due to specific antibody binding [12]. |
Immunomagnetic separation stands as a powerful, versatile, and indispensable tool in the modern neuroscientist's arsenal. Its defining advantages—exceptional gentleness on sensitive neural cells, straightforward scalability for various research and development needs, and compelling cost-effectiveness—make it particularly suited for purifying specific cell types from complex neural tissues, iPSC-derived cultures, and brain organoids. By implementing the detailed protocols and leveraging the reagent solutions outlined in this document, researchers can reliably obtain high-quality neural cell populations to drive discovery in basic neurobiology, disease modeling, and the development of novel therapeutics for neurological disorders.
Immunomagnetic cell separation is a cornerstone technique in modern neuroscience research for purifying specific cell populations from complex tissues or cultures. The method relies on targeting cell surface antigens with antibodies conjugated to magnetic particles, allowing for the selective isolation or depletion of cells when exposed to a magnetic field. The fundamental choice between positive selection (directly labeling and isolating the target cells) and negative selection (indirectly isolating target cells by removing unwanted cells) is critical and is primarily dictated by the requirements of the downstream application [7] [13]. This article provides a structured framework for selecting and implementing the optimal immunomagnetic separation strategy for purifying neural cell types, complete with comparative data, detailed protocols, and essential reagent solutions.
Strategic Selection: Positive vs. Negative Selection
The decision between positive and negative selection strategies involves weighing multiple factors, including target cell characteristics, desired cell purity and yield, and the specific needs of subsequent experiments. The table below summarizes the core characteristics of each approach.
Table 1: Core Characteristics of Positive and Negative Selection Strategies
| Feature | Positive Selection | Negative Selection |
|---|---|---|
| Principle | Directly labels and isolates target cells using antibodies against a specific surface antigen [7] | Indirectly isolates target cells by labeling and depleting unwanted cell types [7] |
| Antibody Binding | Target cells are bound by antibodies and magnetic particles [7] | Target cells remain unbound by antibodies and particles [7] |
| Typical Purity | High [7] | High |
| Protocol Speed | Generally fast | Typically faster and easier with minimal sample manipulation [7] |
| Ideal For | Isolating a single, well-defined cell population; uncommon cell types via indirect labeling [7] | Downstream applications requiring untouched, unactivated cells; pre-enrichment prior to FACS [7] |
The following diagram illustrates the logical decision-making process for choosing between these two strategies, helping to align the method with research goals.
Application to Specific Neural Cell Types
The isolation of primary neural cells from brain tissue involves common initial steps: careful dissection, mechanical disruption, and enzymatic digestion to create a single-cell suspension [6]. Immunomagnetic separation is then applied to this suspension to purify specific cell types. The selection of strategy and markers is paramount.
Marker-Based Isolation of Neural Cells
Different neural cell types express specific surface antigens that can be leveraged for immunomagnetic separation. The following table outlines common targets and recommended strategies for key neural cells.
Table 2: Selection Strategies and Markers for Key Neural Cell Types
| Neural Cell Type | Recommended Strategy | Key Surface Markers/Targets | Notes & Considerations |
|---|---|---|---|
| Microglia | Positive Selection | CD11b (ITGAM) [6] | Common marker for microglia and other myeloid cells. Purify first from a mixed suspension. |
| Astrocytes | Positive Selection | ACSA-2 (Astrocyte Cell Surface Antigen-2) [6] | Isolate sequentially from the CD11b-negative fraction. |
| Neurons | Negative Selection | Use a biotin-antibody cocktail against non-neuronal cells [6] | Preserves untouched neurons. Purity can be affected by the completeness of non-neuronal depletion. |
| Radial Glia | Negative Selection (enrichment) | CD24⁻THY1⁻/lo [14] | These markers enrich for a population that can robustly engraft and differentiate into neurons, oligodendrocytes, and astrocytes. |
| Oligodendrocyte Precursor | Positive Selection | THY1⁺ [14] | Marks unipotent precursors committed to an oligodendroglial fate. |
| Glial Progenitor Cell (GPC) | Positive Selection | THY1ʰⁱEGFRʰⁱPDGFRA⁻ [14] | Identifies a bipotent glial progenitor restricted to generating astrocytes and oligodendrocytes. |
Workflow for Tandem Isolation from a Single Sample
For comprehensive studies, multiple neural cell types can be sequentially isolated from a single brain tissue sample. The following workflow diagram outlines a proven tandem protocol for the sequential isolation of microglia, astrocytes, and neurons.
Detailed Experimental Protocols
Protocol A: Positive Selection of Microglia via CD11b
This protocol is designed for the direct positive selection of microglia from a dissociated mouse brain cell suspension, ideal for applications such as single-cell RNA sequencing or in vitro activation studies where antibody binding is not a concern.
Reagents & Materials:
- Dissociated single-cell suspension from brain tissue.
- EasySep Mouse CD11b Positive Selection Kit (or equivalent).
- Magnetic separation stand (column-free recommended).
- Polypropylene tubes, cell culture medium (e.g., DMEM/F-12 with 10% FBS).
Step-by-Step Procedure:
- Preparation: Create a single-cell suspension from brain tissue via enzymatic digestion (e.g., with trypsin) and mechanical trituration, followed by filtration through a 70μm cell strainer and resuspension in appropriate buffer [6].
- Labeling: Add the CD11b Positive Selection Cocktail to the cell suspension. Use 50μL of cocktail per 1-10 million cells. Mix well and incubate for 15-30 minutes at room temperature.
- Magnetic Particle Addition: Add the appropriate volume of Magnetic Particles to the sample. Mix well and incubate for 10 minutes at room temperature.
- Magnetic Separation: Bring the total volume up to 10mL with buffer. Place the tube into the magnetic stand and incubate for 5 minutes.
- Collection: In one smooth motion, pour off the supernatant (which contains the CD11b-negative cells). While the tube is still in the magnet, wash the isolated cells by adding 10mL of buffer, incubating for 5 minutes, and discarding the supernatant. Repeat this wash step.
- Elution: Remove the tube from the magnetic stand and resuspend the pellet of CD11b-positive microglia in the desired culture medium or buffer for downstream applications [7] [13].
Protocol B: Negative Selection of Neurons
This protocol describes the isolation of untouched neurons from a brain cell suspension that has already been depleted of microglia and astrocytes, perfect for functional studies where antibody-induced activation or signaling must be avoided.
Reagents & Materials:
- Starting cell suspension (e.g., the CD11b/ACSA-2 negative fraction from the tandem workflow).
- Neuron Isolation Kit, Biotin-Antibody Cocktail (non-neuronal cell targets).
- Magnetic Particles conjugated to an anti-biotin antibody.
- Magnetic separation stand.
Step-by-Step Procedure:
- Preparation: Begin with your pre-enriched cell suspension (the negative fraction after microglia and astrocyte removal). Centrifuge the cells and resuspend them in the recommended isolation buffer.
- Labeling Unwanted Cells: Add the Biotin-Antibody Cocktail to the cell suspension. This cocktail contains antibodies against surface antigens on remaining non-neuronal cells (e.g., other glial cells). Incubate for 15 minutes at 4°C.
- Magnetic Particle Addition: Add the Magnetic Particles (e.g., Streptavidin Nanobeads) to the sample. Incubate for 15 minutes at 4°C.
- Magnetic Separation: Bring the tube to the recommended volume with buffer. Place the tube into the magnetic stand and incubate for 5-10 minutes.
- Collection of Neurons: Carefully pour off or pipette the supernatant. This supernatant contains your negatively selected, untouched neurons.
- Concentration (Optional): Centrifuge the supernatant containing the neurons to concentrate the pellet for downstream use [7] [6].
The Scientist's Toolkit: Essential Research Reagent Solutions
Successful immunomagnetic separation relies on a suite of specialized reagents and instruments. The following table details key solutions for building a robust toolkit.
Table 3: Essential Reagents and Tools for Immunomagnetic Cell Separation
| Item | Function/Description | Example Use Case |
|---|---|---|
| Column-Free Magnetic Stand | Creates a magnetic field in a standard tube, immobilizing labeled cells against the wall for easy supernatant removal [13]. | Standard positive or negative selection protocols; ideal for most sample types and avoids column clogging. |
| Column-Based Magnetic System | Uses a column packed with ferromagnetic material to capture labeled cells as the sample flows through [13]. | Processing very large volumes or samples with fine debris; may require more optimization. |
| EasySep or Similar Kits | Pre-formatted antibody and magnetic particle cocktails for specific cell targets in multiple species [7]. | Reliable, off-the-shelf isolation of common neural cell types like microglia (CD11b) or T cells. |
| Biotin-Antibody Cocktails | Mixtures of biotin-conjugated antibodies targeting multiple surface antigens for comprehensive depletion. | Negative selection of neurons or other cells where a single defining surface marker is not available. |
| Anti-Biotin Magnetic Beads | Magnetic particles that bind to biotinylated antibodies, enabling indirect cell capture or depletion. | Used in conjunction with biotin-antibody cocktails for negative selection or custom isolation protocols. |
| Ficoll-Paque or Percoll | Density gradient media for preliminary enrichment of mononuclear cells or removal of debris and dead cells [6]. | Pre-processing of tissue samples to improve viability and purity before immunomagnetic separation. |
Integration with Downstream Applications and Concluding Remarks
The choice of immunomagnetic separation strategy is never made in isolation; it is intrinsically linked to the downstream application. For instance, negative selection is the preferred method for pre-enriching target cells prior to fluorescence-activated cell sorting (FACS), as it yields unlabeled cells, preserves antigenicity for subsequent fluorophore-tagged antibodies, and substantially reduces sorting time [7]. Conversely, when the target cell population is rare or lacks a unique surface marker, indirect positive selection using a user-defined primary antibody offers greater flexibility [7].
Furthermore, the emergence of advanced models like human induced pluripotent stem cell (iPSC)-derived neurons and brain organoids for disease modeling [15] [16] [17] underscores the need for precise purification strategies. Combining immunomagnetic separation with these models allows for the isolation of specific neural progenitors or differentiated cells from heterogeneous organoid cultures, enabling cleaner mechanistic studies and drug screening.
In conclusion, a deep understanding of the principles, markers, and protocols governing positive and negative immunomagnetic selection empowers researchers to make informed strategic decisions. By carefully considering the experimental goals and leveraging the detailed guidelines and reagents outlined in this application note, scientists can reliably isolate high-purity neural cell populations to drive discovery in neuroscience and drug development.
Immunomagnetic separation (IMS) has emerged as a cornerstone technique for the rapid and specific purification of cell populations, including neural cells from the complex milieu of brain tissue. This method leverages the high specificity of antibodies with the physical manipulability of magnetic particles to isolate target cells directly from a heterogeneous suspension. For research on the nervous system, where cellular heterogeneity can obscure specific mechanistic studies, IMS provides a powerful tool to obtain highly purified populations of neurons, astrocytes, microglia, and neural stem cells. The fundamental components of this system are universal: magnetic particles serve as the mobile solid phase, antibodies confer cellular specificity, and the separation column/system provides the physical environment where the magnetic force is applied to separate labeled from unlabeled cells. Due to its speed and simplicity, magnetic cell separation is one of the most commonly used methods for isolating highly purified cell populations for downstream research applications [13]. The technique's versatility allows it to be tailored for complex tasks, such as the sequential isolation of multiple neural cell types from a single brain sample, maximizing the informational yield from precious tissue [6].
Core Components and Their Functions
Magnetic Particles
Magnetic particles, or beads, are the workhorses of IMS, acting as microscopic handles that allow an external magnetic field to manipulate cells. Their properties—including size, composition, and surface chemistry—are critical determinants of separation efficiency and cell viability.
- Size and Composition: Particles range from nanometers to several micrometers in diameter. Micron-sized particles are often preferred for cell separation due to their higher magnetic susceptibility, which facilitates rapid separation in moderate magnetic fields, and their better-controlled characteristics for integrated diagnostic assays [18] [19]. The magnetic core is typically composed of iron oxides (e.g., magnetite, maghemite) and is often coated with a polymer shell (e.g., polystyrene, silica) to provide a stable, biocompatible surface for functionalization.
- Surface Functionalization: The surface of the beads is chemically modified to allow for the covalent coupling of affinity ligands, most commonly antibodies. A key quality feature is effective functionalization and preparation, which ensures high binding capacity and stability while minimizing non-specific cell adsorption [18]. The density, orientation, and flexibility of the attached antibodies are crucial for maximizing capture efficiency of the target neural cells [19].
Table 1: Key Characteristics of Magnetic Particles for Cell Separation
| Characteristic | Description | Impact on Separation |
|---|---|---|
| Size | Nano-scale (e.g., 50-150 nm) to micro-scale (e.g., 1-5 µm) | Larger particles (≥1µm) are better for rapid separation; smaller particles may offer higher surface area but require stronger magnetic fields [18] [19]. |
| Magnetic Core | Superparamagnetic iron oxide nanoparticles (SPIONs) or similar. | Superparamagnetic materials are magnetized only in an external field, preventing clumping and allowing for easy resuspension after separation [20]. |
| Surface Coating | Polymers like polystyrene or dextran. | Provides a matrix for antibody conjugation and helps reduce non-specific binding to non-target cells. |
| Functional Groups | Amine, carboxyl, streptavidin, or custom groups. | Determines the chemistry for covalent antibody coupling or other affinity ligand attachment. |
Antibodies
Antibodies provide the molecular recognition that gives IMS its specificity. They are the bridge between the magnetic particle and the cell-surface antigen (marker) uniquely expressed by the target neural cell type.
- Specificity and Validation: The choice of antibody is dictated by the target cell population. For instance, CD11b (ITGAM) is a canonical marker for microglia, while ACSA-2 (Astrocyte Cell Surface Antigen-2) is used for astrocytes, and specific cadherins or other markers are used for neuronal populations [6]. The antibody must be validated for IMS to ensure it recognizes the native, surface-exposed epitope of the antigen without inducing excessive activation or apoptosis in the target cell.
- Orientation and Conjugation: The method of antibody attachment to the bead surface significantly impacts performance. Random conjugation can block the antigen-binding site in a majority of antibodies. Novel approaches that control affinity compound orientation, such as using recombinant Protein A or G, which binds the Fc region of antibodies, can improve immunomagnetic capture efficiency by presenting the antibody in a uniform, accessible orientation [18] [19].
Separation Columns and Systems
The separation system is the platform where the magnetic force is applied to isolate the bead-bound cells. The two primary formats are column-based and column-free (or "tube-based") systems, each with distinct advantages.
- Column-Based Systems: In these systems, the cell-bead mixture is passed through a column placed within a strong magnetic field. The column is filled with a ferromagnetic matrix (e.g., steel wool or metal spheres) that becomes magnetized, creating a high-gradient magnetic field. This field efficiently captures magnetically labeled cells, allowing unlabeled cells to pass through. After washing, the captured cells are eluted by removing the column from the magnetic field and flushing it with buffer [13]. While highly efficient, columns can sometimes clog, especially with tissue samples containing debris, and require careful washing to avoid cross-contamination [13].
- Column-Free Systems: This format simplifies the process by placing the entire sample tube in a magnetic stand. The magnetic field causes the labeled cells to migrate to the wall of the tube. The supernatant containing the unlabeled cells can then be simply poured or pipetted off. Upon removal from the magnet, the labeled cells are resuspended. This method is generally faster, more flexible, and avoids the risk of column clogging, making it a preferred choice for many research applications [13].
The magnetic force in these systems can be generated by permanent magnets (e.g., neodymium) or electromagnets. Low-gradient magnetic separators (∇B = 2–30 T·m⁻¹) using permanent magnets can be sufficient for many applications, offering a cost-effective and scalable alternative [20]. For high-throughput or automated applications, fully automated instruments, such as the RoboSep, can process multiple samples simultaneously, saving hands-on time and improving reproducibility [13].
Research Reagent Solutions Toolkit
Table 2: Essential Materials for Immunomagnetic Separation
| Item | Function/Purpose |
|---|---|
| Magnetic Separation Kits | Pre-optimized kits (e.g., EasySep) for specific cell types provide magnetic particles and antibodies in a standardized, performance-guaranteed format [13]. |
| Cell Separation Magnets | Specialized magnets (e.g., EasySep magnets) designed to hold specific tube formats or columns, creating the magnetic field for separation [13]. |
| Specific Antibody Cocktails | Antibody mixtures targeting multiple surface markers (e.g., a "non-neuronal cell biotin-antibody cocktail") for highly specific positive or negative selection [6]. |
| Enzymatic Digestion Mix | A blend of enzymes (e.g., papain, trypsin) for the gentle dissociation of solid tissues, like brain, into a single-cell suspension prior to separation [6]. |
| Magnetic Particle Functionalization Kits | Chemical kits for researchers to conjugate their own antibodies or other affinity ligands (e.g., aptamers, lectins) to magnetic beads [18]. |
| Automated Cell Separators | Instruments (e.g., RoboSep) that automate the entire separation process, minimizing hands-on time and variability for labs with high throughput needs [13]. |
Experimental Protocol: Tandem Isolation of Microglia, Astrocytes, and Neurons
This protocol details a sequential, tandem method for the isolation of microglia, astrocytes, and neurons from a single sample of dissociated mouse brain tissue, suitable for a 9-day-old mouse pup [6]. The workflow below provides a visual overview of this multi-step process.
Sample Preparation and Pre-enrichment
- Brain Tissue Dissociation: Euthanize the mouse according to approved institutional protocol. Rapidly dissect the brain region of interest (e.g., cortex, hippocampus) and remove the meninges carefully. Mechanically dissociate the tissue using a sterile pipette or gentle chopping. Transfer the tissue fragments to a tube containing an enzymatic digestion mix (e.g., trypsin or papain). Incubate for 15-20 minutes at 37°C with gentle agitation. Inactivate the protease by adding a serum-containing medium or inhibitor.
- Single-Cell Suspension Generation: Triturate the digested tissue gently with a fire-polished Pasteur pipette to achieve a single-cell suspension. Pass the suspension through a 40 µm cell strainer to remove any remaining clumps or debris. Centrifuge the filtrate (e.g., 300 x g for 5 minutes), remove the supernatant, and resuspend the cell pellet in an appropriate separation buffer (e.g., PBS pH 7.2, 2 mM EDTA, 0.5% BSA). Perform a viable cell count.
Sequential Immunomagnetic Separation
All incubations and separations should be performed on ice or at 4°C to preserve cell viability and prevent antibody internalization.
Step 1: Isolation of Microglia (Positive Selection)
- Incubation: Take the prepared single-cell suspension and incubate it with CD11b (Integrin alpha M) microbeads for 15-30 minutes. Use the manufacturer's recommended volume of beads per number of total cells.
- Separation: Wash the cells to remove unbound beads and resuspend in buffer. Apply the cell suspension to a pre-rinsed magnetic column (for column-based systems) or a tube placed in a magnetic stand (for column-free systems).
- Collection: For column-based systems, allow the unlabeled, CD11b-negative cells to flow through. After several washes, remove the column from the magnet and flush out the positively selected CD11b+ microglia. For column-free systems, allow the labeled cells to collect at the tube wall, then carefully pipette off the supernatant containing the negative fraction. Remove the tube from the magnet and resuspend the microglia.
- Cell Processing: The collected microglia are now purified and can be cultured or processed for downstream analysis. Keep the negative fraction (flow-through) for the next step.
Step 2: Isolation of Astrocytes (Positive Selection from Microglia-Negative Fraction)
- Incubation: Take the CD11b-negative cell fraction and centrifuge it to concentrate the cells. Incubate the cell pellet with ACSA-2 (Astrocyte Cell Surface Antigen-2) microbeads for 15-30 minutes.
- Separation and Collection: Repeat the magnetic separation process as in Step 1. The cells bound by the ACSA-2 microbeads are the purified astrocytes. Collect this positive fraction. Retain the negative flow-through (now depleted of both CD11b+ and ACSA-2+ cells) for the final step.
Step 3: Isolation of Neurons (Negative Selection from Remaining Fraction)
- Incubation: Take the CD11b/ACSA-2 double-negative cell fraction and centrifuge it. Incubate the cell pellet with a biotinylated antibody cocktail against non-neuronal cells (e.g., targeting remaining glial and endothelial cells).
- Magnetic Depletion: After a 15-minute incubation, add anti-biotin magnetic beads and incubate for another 15 minutes. Perform the magnetic separation. In this negative selection strategy, the unlabeled cells that pass through the magnetic field are the target cells—in this case, the neurons. The magnetically labeled non-neuronal cells are retained.
- Collection: Collect the flow-through, which contains the enriched neuronal population.
Post-isolation Processing and Quality Control
- Cell Viability and Counting: Assess the viability of each purified cell fraction using Trypan Blue exclusion or a fluorescent live/dead stain. Count the cells to determine the yield for each population.
- Purity Assessment: It is critical to validate the purity of each isolated cell batch. This is typically done by immunocytochemistry or flow cytometry using markers specific to each cell type (e.g., IBA1 for microglia, GFAP for astrocytes, MAP2 or NeuN for neurons). Purity levels can often exceed 90% with well-optimized protocols [6].
- Downstream Applications: The purified cells can be used immediately for RNA/protein extraction, plated for short-term culture, or analyzed by single-cell RNA sequencing, qRT-PCR, or western blot. Note that primary neurons have a limited lifespan and may start to change their morphology shortly after purification, so downstream experiments should be performed as soon as possible [6].
Advanced Applications and Methodological Considerations
Dual-Marker Isolation for Rare Cell Populations
For isolating rare cell populations or those lacking a single unique identifier, a dual-marker positive selection strategy significantly enhances purity. This method, exemplified by the isolation of bona fide Lymphatic Endothelial Cells (LECs) using podoplanin and VEGFR-3 markers [21], is directly applicable to challenging neural cell types.
- Protocol: The cell suspension is sequentially incubated with two different magnetic bead sets, each conjugated to an antibody against a distinct surface marker on the target cell. For example, a neural stem cell population might be targeted using a combination of CD24 and THY1 [14]. The sequential binding ensures that only cells expressing both markers are captured with high specificity during the magnetic separation, effectively eliminating cells that express only one of the markers. This strategy is crucial for applications like single-cell RNA sequencing where high purity is a primary concern [21].
Quality Control and Cluster Characterization
The formation of immunomagnetic clusters—aggregates of magnetic beads and target cells—is a direct indicator of capture efficiency. Monitoring these clusters is a key quality control step.
- Characterization Techniques: Immunomagnetic aggregates can be evaluated using various endpoint and dynamic methods. Flow cytometry can rapidly assess the percentage of bead-bound cells. Microscopy techniques, such as fluorescence microscopy (to visualize labeled cells and beads) and scanning electron microscopy (SEM, for high-resolution analysis of cluster morphology), provide visual confirmation of successful capture and can reveal issues with bead functionalization if clusters are uneven [18] [19].
- Troubleshooting: Low purity can result from non-specific binding or insufficient washing. High cell loss can be due to overly aggressive mechanical processing or magnetic force. If the target cell yield is low, re-optimize the bead-to-cell ratio and the incubation time. Batch-to-batch variation in tissue sources is a known challenge in primary cell isolations, so phenotypic characterization of each batch is required to ensure experimental consistency [6].
The robust and reproducible isolation of specific neural cell types is achievable through a detailed understanding of the three essential components of immunomagnetic separation: magnetic particles, antibodies, and separation systems. The provided tandem protocol demonstrates how these components can be strategically combined to maximize information from a single tissue sample. As the field advances, the integration of IMS with microfluidics and the development of more sophisticated automated instruments and characterization methods will further solidify its role as an indispensable tool for deconstructing the complexity of the nervous system in health and disease.
Protocols and Cutting-Edge Applications for Neural Cell Isolation
The isolation of pure cell populations from complex neural tissues is a cornerstone of modern neuroscience research, enabling precise studies of cellular functions, signaling pathways, and disease mechanisms. Immunomagnetic separation has emerged as a powerful technique for isolating specific neural cell types with high purity and viability, overcoming limitations of traditional methods that often yield mixed populations unsuitable for detailed molecular analyses. This protocol provides a comprehensive framework for obtaining pure populations of neurons, astrocytes, and microglia from brain tissue, utilizing optimized dissociation techniques followed by magnetic-activated cell sorting (MACS). The methodology is particularly valuable for drug development applications where understanding cell-type-specific responses is critical for evaluating therapeutic efficacy and safety profiles. By maintaining cellular integrity throughout the process, researchers can obtain populations that faithfully represent in vivo states for downstream applications including transcriptomics, proteomics, and functional assays [6].
Background Principles
Neural Cell Types and Characteristics
The central nervous system contains diverse cell types with distinct functions and marker expressions essential for targeted isolation. Neurons, the primary signaling cells, process and transmit information through electrical and chemical signals. Glial cells, including astrocytes, microglia, and oligodendrocytes, provide crucial support functions: astrocytes maintain extracellular ion balance and regulate blood flow; microglia serve as the primary immune defense; and oligodendrocytes produce myelin to insulate axons [6]. These functional differences are reflected in their physical and biological properties, which can be exploited for separation. Table 1 summarizes key characteristics of major neural cell types relevant for isolation procedures.
Table 1: Neural Cell Types and Isolation Characteristics
| Cell Type | Primary Functions | Key Surface Markers | Abundance in CNS | Isolation Considerations |
|---|---|---|---|---|
| Neurons | Information processing via electrical and chemical signaling | MAP-2, NeuN (intracellular); NCAM/L1CAM (surface) | Varies by region | Extremely sensitive; require gentle dissociation and negative selection |
| Astrocytes | Homeostasis, blood-brain barrier regulation, neuronal support | GFAP (intracellular); ACSA-2 (surface) | ~20-40% | Often isolated via positive selection using ACSA-2 |
| Microglia | Immune defense, phagocytosis, neuroprotection | IBA-1 (intracellular); TMEM119, CD11b (surface) | 5-10% | Can be activated by damage; purify first from fresh tissue |
| Oligodendrocytes | Myelination of axons | MBP, PLP (intracellular); O4 (surface) | Varies by region | Myelin content can complicate isolation |
Immunomagnetic Separation Fundamentals
Immunomagnetic separation leverages antibody-antigen interactions conjugated to magnetic particles to isolate specific cell types from heterogeneous mixtures. The technique offers significant advantages for neural cell isolation, including gentle processing that preserves viability, high specificity, and scalability from research to potential clinical applications. Two principal approaches are employed:
- Positive Selection: Target cells are directly labeled with antibody-conjugated magnetic beads and retained in a magnetic field. This approach yields high purity but may potentially activate cellular receptors through antibody binding [22].
- Negative Selection: Unwanted cells are labeled and removed, leaving the target population unlabeled and untouched in suspension. This preserves native cell function but may result in lower purity if not all non-target cells are effectively depleted [22].
For neural tissues, a sequential approach combining both methods often provides optimal results, particularly for sensitive cell types like neurons that benefit from negative selection to avoid antibody-induced activation [6].
Materials and Equipment
Research Reagent Solutions
Table 2: Essential Reagents and Materials for Neural Cell Isolation
| Item | Function/Application | Examples/Specifications |
|---|---|---|
| Tissue Dissociation Enzymes | Breaks down extracellular matrix to release single cells | gentleMACS Neural Tissue Dissociation Kit; cold-active proteases (e.g., subtilisin A) [23] |
| MACS Buffer | Medium for immunomagnetic procedures | PBS + EDTA + BSA or FBS; calcium- and magnesium-free to prevent clumping |
| Magnetic Beads | Binds to target cells for separation | Microbeads conjugated to CD11b, ACSA-2, or biotin-antibody cocktails [6] |
| Magnetic Separator | Creates field for separation | EasySep Magnet; MACS columns and magnets [24] |
| Cell Strainers | Removes cell clumps and debris | 70µm and 40µm mesh sizes; preferably sterile [24] |
| Density Gradient Medium | Separates cells based on density | Percoll for microglia and astrocyte isolation [6] |
| Viability Enhancers | Maintains cell health during stress | ROCK inhibitor (Y-27632); final concentration 10µM [24] |
| Neural Cell Culture Medium | Supports cell survival post-isolation | Specific formulations for neurons, astrocytes, or microglia |
Experimental Workflow
The complete protocol for obtaining pure neural cell populations encompasses tissue acquisition, dissociation, and sequential immunomagnetic separation, as visualized in the following workflow diagram.
Diagram 1: Complete workflow for neural cell isolation
Step-by-Step Protocol
Tissue Dissociation and Single-Cell Suspension Preparation
Critical Pre-Protocol Considerations: Source age, species, and sex significantly impact isolation outcomes. Murine tissues from 9-day-old pups typically yield optimal results, though age should be selected based on research questions. All steps should be performed under sterile conditions with pre-chilled solutions unless specified [6].
Tissue Acquisition and Preparation:
- Euthanize animal according to approved institutional protocols.
- Rapidly dissect brain region of interest (e.g., prefrontal cortex, hippocampus).
- Carefully remove meninges using fine forceps to avoid vascular contamination.
- Transfer tissue to petri dish containing ice-cold, calcium-magnesium-free PBS.
- Mince tissue into approximately 1mm³ pieces using sterile micro-dissecting scissors.
Enzymatic Digestion:
- Transfer minced tissue to dissociation tube containing enzyme mix. For neural tissue, use either:
- Standard neural tissue dissociation enzymes (e.g., gentleMACS Neural Tissue Dissociation Kit)
- Cold-active protease (e.g., subtilisin A at 4°C) to minimize stress-induced transcriptional artifacts [23]
- Add ROCK inhibitor (Y-27632) to final concentration of 10µM to enhance viability [24].
- Incubate for 15-45 minutes at 37°C (standard enzymes) or 4°C (cold-active protease) with gentle agitation.
- Transfer minced tissue to dissociation tube containing enzyme mix. For neural tissue, use either:
Mechanical Dissociation:
- Place tube on gentleMACS dissociator and run appropriate neural tissue program.
- Alternatively, triturate tissue 10-15 times using fire-polished Pasteur pipette with progressively smaller openings.
- Monitor dissociation visually; avoid over-processing which reduces viability.
Filtration and Washing:
- Pass cell suspension through 70µm cell strainer to remove large debris.
- Follow with filtration through 40µm cell strainer.
- Centrifuge filtrate at 300 × g for 5 minutes at 4°C.
- Carefully aspirate supernatant and resuspend pellet in MACS buffer.
- Perform viability count using trypan blue exclusion; aim for >85% viability.
Sequential Immunomagnetic Separation of Neural Cells
This sequential protocol enables isolation of multiple neural cell types from the same tissue sample, maximizing resource utilization. The recommended order exploits differential abundance and marker stability [6].
Microglia Isolation (CD11b+ Positive Selection):
- Incubate single-cell suspension with CD11b (ITGAM) microbeads for 15 minutes at 4°C.
- Wash cells with MACS buffer to remove unbound beads.
- Apply cell mixture to MACS column positioned in magnetic field.
- Collect flow-through (negative fraction) for subsequent isolations.
- Remove column from magnet and flush out CD11b+ microglia with buffer.
- Transfer purified microglia to complete culture medium.
Astrocyte Isolation (ACSA-2+ Positive Selection):
- Take flow-through from microglia isolation and incubate with ACSA-2 microbeads for 15 minutes at 4°C.
- Repeat magnetic separation procedure as in Step 1.
- Collect flow-through for neuron isolation.
- Elute ACSA-2+ astrocytes and transfer to culture medium.
Neuron Isolation (Negative Selection):
- Take flow-through from astrocyte isolation and incubate with biotin-antibody cocktail against non-neuronal cells for 10 minutes at 4°C.
- Add antibiotic microbeads and incubate for additional 15 minutes.
- Apply to MACS column; neurons will pass through while non-neuronal cells are retained.
- Collect flow-through containing purified neurons.
- Centrifuge and resuspend in neuronal culture medium.
Post-Isolation Processing and Analysis
Cell Quantification and Viability Assessment:
- Count cells using automated cell counter or hemocytometer.
- Perform viability staining (trypan blue or propidium iodide).
- Assess yield and purity expectations as outlined in Table 3.
Purity Validation:
- Aliquot small portion of each population for immunocytochemistry.
- Stain for cell-type-specific markers:
- Neurons: MAP-2 or NeuN
- Astrocytes: GFAP
- Microglia: IBA-1 or TMEM119
- Analyze by fluorescence microscopy or flow cytometry.
- Expect >90% purity for each population with optimized protocol.
Downstream Applications:
- Culture cells in appropriate conditions for functional assays.
- Process immediately for RNA/protein isolation for omics studies.
- Utilize isolated cells within 4-6 hours for best results in drug response assays.
Expected Results and Performance Metrics
When successfully implemented, this protocol yields highly pure populations of neural cells suitable for a wide range of downstream applications. The sequential isolation approach maximizes tissue utilization while maintaining cellular integrity. Table 3 summarizes typical outcomes and quantitative performance metrics.
Table 3: Expected Results and Performance Metrics
| Parameter | Microglia (CD11b+) | Astrocytes (ACSA-2+) | Neurons (Negative Selection) |
|---|---|---|---|
| Typical Purity | >90% | >90% | >85% |
| Average Yield | 5-10% of total cells | 20-40% of total cells | Varies by brain region |
| Viability | >90% | >90% | >85% |
| Key Markers | CD11b, IBA-1, TMEM119 | ACSA-2, GFAP, S100B | MAP-2, NeuN, β-III-tubulin |
| Common Contaminants | Peripheral macrophages | Neurons, fibroblasts | Astrocytes, endothelial cells |
| Time Culture Stable | 1-2 weeks | Multiple passages | 2-4 weeks (mature cultures) |
Troubleshooting and Optimization
Even with careful execution, researchers may encounter challenges during neural cell isolation. The following table addresses common issues and provides evidence-based solutions.
Table 4: Troubleshooting Guide for Common Issues
| Problem | Potential Causes | Solutions |
|---|---|---|
| Low Cell Viability | Over-digestion with enzymes; excessive mechanical force; delayed processing | Optimize enzyme incubation time; use cold-active proteases [23]; include ROCK inhibitor; process tissue rapidly after dissection |
| Poor Purity | Inadequate antibody concentration; insufficient washing; magnetic separation issues | Titrate antibodies for optimal concentration; increase wash steps; ensure proper column preparation and avoid bubbles |
| Low Yield | Incomplete tissue dissociation; cell loss during washes; suboptimal tissue quality | Gently triturate during dissociation; use low-protein-binding tubes; ensure tissue freshness and proper handling |
| Cell Clumping | DNA release from damaged cells; insufficient enzymatic digestion | Add DNase to digestion mix; filter through appropriate strainer sizes; use calcium-magnesium-free buffers |
| Inconsistent Results Between Preparations | Biological variability; protocol deviations | Include internal controls; standardize animal age/sex; use consistent timing; perform power analysis for adequate sample size [6] |
Applications in Drug Development and Research
The isolation of pure neural cell populations using this protocol enables numerous applications in basic research and pharmaceutical development. For drug discovery, purified cells allow for:
- Screening compound efficacy and toxicity on specific neural cell types
- Understanding cell-type-specific mechanisms of drug action
- Modeling neurological disorders using human-relevant in vitro systems
- Investigating cell-type-specific responses to candidate therapeutics
Recent advances in single-cell technologies further enhance the utility of these preparations. Isolated cells can be immediately processed for single-cell RNA sequencing to generate comprehensive transcriptomic profiles, enabling the identification of novel cellular states and biomarkers in neurological diseases [25] [24]. When combining immunomagnetic separation with subsequent omics analyses, researchers can achieve unprecedented resolution in understanding cellular responses to therapeutic interventions, accelerating the development of targeted treatments for neurological and psychiatric disorders.
Microglia, the resident innate immune cells of the central nervous system (CNS), play crucial roles in both normal brain physiology and the neuroinflammation associated with virtually all CNS disorders. The isolation of pure, functionally intact microglia is therefore a fundamental requirement for studying their activities ex vivo. CD11b, a subunit of complement receptor 3 (CR3), serves as a definitive surface marker for microglial identification and purification. A significant challenge in microglial isolation is the efficient removal of myelin debris, which can interfere with downstream separation techniques and analytical applications. This Application Note details refined methodologies for isolating high-purity microglia from mouse and human brain tissue using CD11b-based immunomagnetic separation, with a specific focus on optimizing myelin removal to preserve cell viability and phenotype.
The Central Role of CD11b in Microglial Identity and Function
CD11b (cluster of differentiation 11b), which pairs with CD18 to form the integrin CR3, is highly and constitutively expressed on microglia and is essential for their immune functions. This receptor not only serves as a prime target for isolation but is also functionally involved in myelin phagocytosis. Research indicates that CR3 mediates the phagocytosis of both opsonized and non-opsonized myelin, a process that can subsequently induce the production of inflammatory mediators such as tumor necrosis factor-α (TNF-α) and nitric oxide (NO) [26]. The strategic selection of CD11b for microglial purification therefore provides a population of cells that are directly relevant to the study of neuroinflammatory demyelinating pathologies.
Immunomagnetic cell separation leverages antibodies conjugated to magnetic particles to isolate or deplete specific cell populations. For microglial isolation, a positive selection strategy is employed, which involves directly targeting the CD11b antigen on the microglial cell surface [7]. This approach offers high purity and is well-suited for obtaining microglia for downstream molecular and functional analyses. The general workflow involves creating a single-cell suspension from brain tissue, removing myelin debris, labeling cells with anti-CD11b magnetic particles, and finally performing magnetic separation to retain the CD11b+ microglia.
Critical Step: A Comparative Analysis of Myelin Removal Techniques
The presence of myelin in CNS cell suspensions can severely compromise the efficiency of immunomagnetic separation and the accuracy of subsequent flow cytometric analysis. A comparative study evaluated three common myelin removal methods for their effects on microglial viability and yield [27]. The key findings are summarized in the table below.
Table 1: Comparison of Myelin Removal Methods for Microglial Isolation
| Method | Principle | Cell Viability | Relative Cell Yield | Key Considerations |
|---|---|---|---|---|
| Percoll Gradient (30%) | Density-based centrifugation | Highest | Highest | Considered the preferred method for optimal viability and yield [27]. |
| Sucrose (0.9 mol/L) | Density-based centrifugation | Lower than Percoll | Lower than Percoll | A viable alternative, though results in lower recovery [27]. |
| Anti-Myelin Beads | Immunomagnetic depletion | Not Specified | Not Specified | Effective for myelin removal; performance may be sample-dependent [27]. |
This comparative data indicates that the 30% Percoll gradient method provides the most favorable outcome, yielding the highest number of CD11b+ cells with the best viability, and is therefore highly recommended for most applications [27].
Detailed Experimental Protocol for Microglial Isolation
The following step-by-step protocol is optimized for the isolation of microglia from adult mouse brain tissue, incorporating the most effective myelin removal technique.
Tissue Dissociation and Single-Cell Suspension Preparation
- Perfusion and Dissection: Perfuse the mouse transcardially with ice-cold PBS to remove circulating blood cells. Dissect the brain and weigh it.
- Enzymatic Digestion: Mechanically dissociate the brain tissue and subject it to enzymatic digestion using a commercial Neural Tissue Dissociation Kit for 35 minutes at 37°C. The process can be performed on ice with extended digestion time if preserving delicate surface antigens is a concern.
- Filtration: Pass the resulting cell suspension through a 40-μm cell strainer to remove undissociated tissue debris [27].
Myelin Removal Using a Percoll Gradient
- Resuspend the pelleted cells in a 30% Percoll solution.
- Centrifuge the suspension at 700 × g for 10 minutes. Myelin, being less dense, will remain in the supernatant.
- Carefully aspirate and discard the myelin-containing supernatant.
- Wash the pelleted cells with Hank's Balanced Salt Solution (HBSS) to remove residual Percoll [27].
CD11b-Positive Immunomagnetic Selection
- Staining: Resuspend the myelin-depleted cells in IMAG buffer (PBS with 0.5% BSA and 2 mM EDTA). Incubate the cells with PE-conjugated anti-CD11b antibodies for 10 minutes at 4°C.
- Magnetic Labeling: Without a wash step, add anti-PE magnetic beads to the cell suspension and incubate for 15 minutes at 4°C. The amount of antibody and beads should be calculated based on the cell count obtained after myelin removal.
- Separation: Place the labeled cell suspension into a prepped magnetic separation column (e.g., MS columns from Miltenyi Biotec). Collect the unbound, CD11b-negative effluent. Then, remove the column from the magnetic field and flush out the purified CD11b+ microglia [27].
- Assessment: Determine cell viability and count using Trypan Blue exclusion or a fluorescent Live/Dead stain compatible with downstream applications [27].
The entire workflow, from dissociated tissue to purified microglia, is illustrated in the following diagram.
Phenotypic Validation of Isolated Microglia
It is critical to confirm that the isolation process itself does not activate the microglia or alter their phenotype. Flow cytometric analysis can be used for this validation.
- Purity Check: Analyze the isolated cells for CD11b and CD45 expression. A highly pure population should show a single, distinct cluster of CD11b+ cells.
- Contamination Check: The isolated fraction can be stained for intracellular markers of other neural cells, such as GFAP (astrocytes) and NeuN (neurons), to confirm the absence of contamination.
- Activation State: To verify that the phenotype is preserved, microglia isolated from control mice should show a quiescent profile, while those from lipopolysaccharide (LPS)-treated mice should display a clear pro-inflammatory activation, such as upregulated TNF-α expression [27]. This confirms that the isolation method accurately reflects the in vivo state.
The Scientist's Toolkit: Essential Reagents for Microglial Isolation
Table 2: Key Research Reagent Solutions for Microglial Isolation
| Item | Function/Description | Example Product/Catalog |
|---|---|---|
| Anti-CD11b Magnetic Beads | Primary reagent for positive selection of microglia. | EasySep Mouse CD11b Positive Selection Kit II [28] |
| Neural Tissue Dissociation Kit | Optimized enzyme blend for generating single-cell suspensions from brain tissue. | Neural Tissue Dissociation Kit (Miltenyi Biotec) [27] |
| Percoll | Density gradient medium for effective myelin removal. | Percoll (GE Healthcare) [27] |
| Magnetic Separation Column | Device for retaining magnetically labeled cells in a magnetic field. | MS or LS Columns (Miltenyi Biotec) [27] |
| Viability Stain | Fluorescent dye to distinguish live from dead cells for flow cytometry. | Live/Dead Fixable Stain (Invitrogen) [27] |
Concluding Remarks
The immunomagnetic isolation of microglia using CD11b is a robust and reliable method that, when coupled with optimized myelin removal, yields cells of high purity and viability. The 30% Percoll gradient method stands out as the most effective pre-separation step. The resulting microglial populations retain their in vivo phenotype, making them suitable for a wide array of downstream applications, including gene expression analysis, protein quantification, functional phagocytosis assays, and flow cytometric characterization. This protocol provides a solid foundation for researchers investigating microglial biology in health and disease.
Adult human olfactory neuroepithelium (ONe) contains neural progenitors with lifelong regenerative capacity, making it a promising autologous cell source for central nervous system repair strategies [29]. The primary challenge in utilizing these cells is the heterogeneous nature of the isolated population, which typically contains mixed progenitor types with varying differentiation potentials. This case study details the application of immunomagnetic separation technology to isolate purified subpopulations of olfactory neural progenitors using tyrosine kinase (Trk) receptors as surface markers, enabling detailed study of their biology and therapeutic potential [29].
The Trk receptor family—comprising TrkA, TrkB, and TrkC—serves as high-affinity receptors for neurotrophins and plays crucial roles in neuronal development, survival, and differentiation [30]. Within the olfactory system, these receptors exhibit sequential expression patterns corresponding to different stages of neuronal maturation, providing an excellent targeting system for progenitor cell isolation [31].
Background and Significance
Olfactory Neural Progenitors as a Therapeutic Resource
The olfactory neuroepithelium represents a unique neural tissue that undergoes continuous neurogenesis throughout adult life, maintained by populations of neural progenitors and stem cells [29]. This regenerative capacity, combined with its relative accessibility via endoscopic biopsy, positions ONe as an ideal source for patient-specific cell replacement therapies in neurodegenerative conditions such as Parkinson's disease, Alzheimer's disease, and spinal cord injury [29].
Neurosphere-forming cells (NSFCs) derived from ONe contain primarily neuronally restricted progenitors alongside a smaller glial-restricted population [29]. However, this heterogeneity presents significant challenges for both basic research and clinical applications, as mixed populations exhibit variable growth characteristics, differentiation potentials, and responses to therapeutic stimuli.
Trk Receptor Biology in Neural Development
Trk receptors function as tropomyosin receptor kinases that bind neurotrophins with varying specificities: TrkA primarily binds nerve growth factor (NGF), TrkB binds brain-derived neurotrophic factor (BDNF) and neurotrophin-4/5 (NT-4/5), while TrkC preferentially binds neurotrophin-3 (NT-3) [32] [30]. These receptors activate intracellular signaling cascades including RAS-ERK, PI3K-AKT, and PLCγ-PKC pathways, ultimately regulating neuronal survival, differentiation, and connectivity [30].
In developing and adult olfactory epithelium, Trk receptors demonstrate sequential expression: TrkA appears in neuronal precursor basal cells, TrkB in immature neurons, and TrkC in mature olfactory neurons [31]. This expression hierarchy provides a molecular framework for isolating specific developmental stages from heterogeneous ONe cultures.
Table 1: Neurotrophin-Trk Receptor Specificity
| Receptor | Primary Ligand(s) | Cellular Expression in ONe | Biological Functions |
|---|---|---|---|
| TrkA | Nerve Growth Factor (NGF) | Neuronal precursor basal cells [31] | Cell survival, differentiation [30] |
| TrkB | BDNF, NT-4/5 [30] | Immature neurons [31] | Neuronal maturation, plasticity [29] [30] |
| TrkC | NT-3 [30] | Mature olfactory neurons [31] | Neuronal survival, maintenance [32] |
Materials and Methods
Olfactory Neural Progenitor Source and Culture
Tissue Sources:
- Postmortem adult human olfactory neuroepithelium obtained within 24 hours of death
- Endoscopic biopsy specimens from patients undergoing nasal sinus surgery
- All procedures approved by institutional ethics committees with appropriate informed consent
Primary Culture Establishment:
- Process ONe tissue specimens mechanically and enzymatically using collagenase/dispase solution
- Plate resulting cell suspension in serum-free neural basal medium supplemented with B27, N2, EGF (20 ng/mL), and FGF-2 (20 ng/mL)
- Culture at 37°C in 5% CO₂ with weekly partial medium changes
- Passage neurospheres every 10-14 days using enzymatic dissociation
- Confirm multilineage potential through differentiation assays [29]
Immunomagnetic Separation Protocol
Reagents and Equipment:
- Magnetic cell separator (autoMACS Pro Separator or equivalent) [33]
- Anti-Trk pan antibody (recognizes TrkA, B, and C extracellular domains) [29]
- Magnetic microbeads conjugated with secondary antibodies [33]
- MACS buffer: PBS pH 7.2, 0.5% BSA, 2 mM EDTA
- Cell viability stain (e.g., trypan blue)
Separation Procedure:
- Harvest neurospheres and dissociate to single-cell suspension using enzymatic treatment
- Resuspend 10⁷ cells in 400 μL cold MACS buffer
- Incubate with primary anti-Trk pan antibody (1:100 dilution) for 30 minutes at 4°C with gentle agitation
- Wash twice with 10-20 volumes of MACS buffer to remove unbound antibody
- Incubate with magnetic bead-conjugated secondary antibody (50 μL per 10⁷ cells) for 15 minutes at 4°C
- Wash cells and resuspend in 500 μL MACS buffer
- Apply cell suspension to magnetic separation column pre-rinsed with MACS buffer
- Collect flow-through containing Trk-negative fraction
- Remove column from magnetic field and elute positively selected Trk-positive cells with 5-10 mL MACS buffer using plunger
- Count both fractions and assess viability using trypan blue exclusion
- Culture separated populations in optimized neural progenitor medium [29]
Critical Parameters:
- Maintain cells at 4°C throughout the procedure to prevent receptor internalization
- Use degassed buffers to prevent bubble formation in magnetic columns
- Process cells promptly after separation to maximize viability and recovery
- Include isotype control antibodies to establish separation specificity
Characterization of Separated Populations
Immunocytochemical Analysis:
- Fix subsets of separated cells at 0, 5, and 14 days post-separation
- Process for immunostaining using antibodies against Trk receptors, β-tubulin III (neuronal marker), GFAP (glial marker), and nestin (progenitor marker)
- Quantify marker expression across multiple fields using fluorescence microscopy
Functional Assessments:
- Perform neurosphere formation assays with limited dilutions
- Assess multipotency through differentiation under neuronal and glial conditions
- Evaluate Trk receptor signaling responsiveness to neurotrophin stimulation
- Measure phosphorylation of downstream effectors (ERK, AKT) via Western blot [30]
Results and Data Analysis
Separation Efficiency and Cellular Composition
Immunomagnetic separation using pan-Trk antibodies successfully partitioned heterogeneous neurosphere-forming cells into distinct subpopulations. The Trk-positive fraction demonstrated significantly enriched expression of Trk receptors immediately following separation, while the negative fraction showed minimal immunoreactivity [29].
Table 2: Separation Efficiency and Cellular Characteristics
| Parameter | Trk-Positive Fraction | Trk-Negative Fraction | Unsorted Population |
|---|---|---|---|
| Purity Post-Separation | >85% Trk-positive [29] | >90% Trk-negative [29] | Mixed |
| Viability | >95% [29] | >95% [29] | >95% |
| TrkB Expression | High (majority of cells) [29] | Low | Heterogeneous |
| TrkA Expression | Moderate (subset of cells) [29] | Minimal | Heterogeneous |
| TrkC Expression | Minimal [29] | Minimal | Low |
| Neurosphere Formation | Maintained | Maintained | Maintained |
Temporal Stability of Separated Populations
The separation-induced purification proved dynamic over time. Trk-positive cells maintained elevated receptor expression for approximately one week post-separation, after which the number of Trk-expressing cells gradually decreased. Remarkably, the Trk-negative population began to express Trk receptors within five days of culture, and both fractions reverted to a heterogeneous composition resembling the original population after two weeks [29]. This plasticity suggests ongoing regulation of Trk receptor expression in olfactory neural progenitors.
Lineage Restriction and Differentiation Potential
Both Trk-positive and Trk-negative subpopulations retained multipotent differentiation capacity, generating neurons and glia under appropriate conditions. Lineage restriction analysis demonstrated equivalent differentiation potential between the separated fractions and the original heterogeneous population [29]. This finding confirms that immunomagnetic separation based on Trk receptors isolates distinct developmental stages without compromising developmental competence.
Discussion
Technical Considerations for Trk-Based Separation
The successful implementation of Trk receptor-based immunomagnetic separation requires careful consideration of several technical factors. The dynamic nature of Trk receptor expression necessitates prompt processing and characterization of separated cells, as the purification is transient [29]. The choice of detection antibody is also critical—while pan-Trk antibodies provide broader recovery of progenitor populations, receptor-specific antibodies enable isolation of more discrete developmental stages.
Recent advancements in magnetic separation technology, such as the MultiMACS X Separator, offer improved throughput and reproducibility for clinical applications [33]. These systems can achieve purities exceeding 85-95% for various cell types while maintaining high cell viability, essential for downstream therapeutic applications [33].
Biological Implications of Trk Expression Dynamics
The reversion of separated populations to heterogeneity within two weeks highlights the dynamic regulation of Trk receptors in olfactory neural progenitors [29]. This plasticity may reflect the inherent developmental flexibility of these cells or response to autocrine/paracrine signaling within the culture environment. Indeed, NSFCs produce BDNF and express its cognate receptor TrkB, suggesting potential autoregulatory mechanisms influencing population dynamics [29].
The prevalence of TrkB receptors in olfactory progenitors aligns with their immature neuronal character and suggests particular responsiveness to BDNF-mediated signaling [29] [31]. This receptor-ligand pairing may represent a key regulatory axis maintaining progenitor populations in a proliferative, undifferentiated state.
Applications and Future Directions
The ability to isolate purified populations of olfactory neural progenitors enables more precise investigation of factors controlling their lineage restriction, expansion, and differentiation. From a therapeutic perspective, enriched populations reduce variability in transplantation studies and may improve safety profiles by eliminating unwanted cell types.
Future applications could incorporate more refined separation strategies using receptor-specific antibodies or sequential separation approaches aligned with the natural Trk expression sequence during olfactory neurogenesis [31]. Additionally, small molecule Trk agonists being developed [34] may provide pharmacological tools to manipulate separated populations for enhanced expansion or directed differentiation.
Signaling Pathways in Trk-Positive Progenitors
The Trk receptors activate multiple intracellular signaling cascades that regulate survival, proliferation, and differentiation of olfactory neural progenitors. Understanding these pathways provides insight into the biological behavior of separated populations.
The Scientist's Toolkit: Research Reagent Solutions
Table 3: Essential Reagents for Immunomagnetic Separation of Olfactory Progenitors
| Reagent/Category | Specific Examples | Function/Application | Notes/Considerations |
|---|---|---|---|
| Primary Antibodies | Anti-Trk pan (recognizes A,B,C) [29]; Anti-TrkA, Anti-TrkB, Anti-TrkC [32] | Target receptor recognition for cell selection | Pan-Trk provides broader recovery; receptor-specific enables discrete isolation |
| Magnetic Separation Systems | autoMACS Pro Separator [33]; MultiMACS X Separator [33] | High-throughput magnetic cell separation | MultiMACS offers increased capacity and reduced manual processing [33] |
| Separation Buffers | MACS buffer (PBS/BSA/EDTA) [33] | Maintain cell viability during separation | Must be degassed to prevent bubble formation |
| Cell Culture Media | Neural basal medium with B27, N2 supplements [29] | Support neural progenitor growth | Serum-free conditions maintain progenitor state |
| Growth Factors | EGF, FGF-2 [29]; BDNF, NT-3 [32] | Progenitor expansion and differentiation | BDNF particularly relevant for TrkB+ populations [29] |
| Viability Assessment | Trypan blue exclusion [29] | Post-separation cell viability measurement | Essential for quantifying separation impact |
| Characterization Tools | β-tubulin III, GFAP, nestin antibodies [29] | Lineage marker immunocytochemistry | Confirm neural identity and differentiation potential |
Immunomagnetic separation using Trk receptors represents an effective methodology for purifying specific subpopulations of adult human olfactory neural progenitors. This approach enables isolation of viable, functionally competent cells that retain their differentiation potential while providing enriched populations for detailed study. The dynamic nature of Trk receptor expression following separation reveals intrinsic plasticity in these progenitor populations, possibly regulated through autocrine/paracrine mechanisms involving their endogenous production of neurotrophins like BDNF.
This technical capability advances their potential therapeutic application for CNS repair by enabling production of more defined cellular products. Future developments combining Trk-based separation with small molecule modulators of receptor signaling [34] may further enhance control over these promising progenitor populations for both basic research and clinical applications in neurodegenerative disorders.
Single-cell radiotracer allocation via immunomagnetic sorting (scRadiotracing) represents a groundbreaking methodological approach that enables researchers to quantify radiotracer uptake at the cellular resolution, effectively bridging the gap between macroscopic positron emission tomography (PET) imaging and cellular physiology. This innovative technique combines in vivo radiotracer injection with subsequent immunomagnetic cell separation to allocate tracer uptake to specific cell populations, thereby disentangling complex PET signals derived from heterogeneous tissues [35] [36].
The fundamental principle underlying scRadiotracing leverages the metabolic trapping mechanism of certain radiotracers. For instance, after in vivo injection of 18F-fluorodeoxyglucose (18F-FDG), the tracer is transported into cells and phosphorylated by hexokinase, resulting in metabolic trapping without further opportunity for metabolism. This provides a "snapshot" of cellular glucose uptake at the time of injection, which is preserved through the cell isolation process [35]. The technology has demonstrated particular utility in neuroscience, oncology, and radiochemistry, where cellular heterogeneity has traditionally hampered precise interpretation of PET signals [36].
Key Applications and Quantitative Findings
scRadiotracing in Neuroscience
In neurological research, scRadiotracing has revolutionized our understanding of cellular metabolism in both healthy and diseased brains. Traditional interpretation of 18F-FDG PET signals in the brain attributed glucose uptake predominantly to neuronal activity. However, scRadiotracing studies have revealed that microglial cells exhibit surprisingly high 18F-FDG uptake, with significant increases observed during activation in amyloid pathology models [35] [36].
Application in Alzheimer's disease research has been particularly revealing. Studies investigating regional desynchronization of microglial activity demonstrated that TSPO-PET signal alterations closely correlate with cognitive decline, with scRadiotracing confirming the microglial source of these changes [37]. Furthermore, in progranulin knockout mouse models with hyperactivated microglia, scRadiotracing helped decipher whether observed PET signal reductions reflected diminished neuronal activity or altered microglial metabolism [36].
scRadiotracing in Oncology
The tumor microenvironment presents exceptional cellular heterogeneity that complicates PET signal interpretation. scRadiotracing has emerged as a powerful tool for dissecting the cellular sources of radiotracer uptake in various cancer models, including glioblastoma, renal cell carcinoma, colorectal carcinoma, and breast cancer [36] [38].
In glioblastoma research, scRadiotracing applied to the translocator protein (TSPO) tracer [18F]GE-180 revealed that single tumor cells exhibited 1.37-fold higher tracer uptake compared to tumor-associated microglia/macrophages (TAMs), challenging previous assumptions about the cellular sources of TSPO-PET signals in brain tumors [38]. This approach has proven valuable for validating cellular targets of novel radiotracers and identifying potential off-target effects.
Table 1: Quantitative scRadiotracing Findings in Disease Models
| Disease Model | Tracer | Cell Type | Tracer Uptake (%ID*BW/cell) | Key Finding |
|---|---|---|---|---|
| Healthy Mouse Brain [38] | [18F]GE-180 (TSPO) | CD11b+ Microglia | 7.7 × 10⁻⁷ ± 0.7 × 10⁻⁷ | 12.5-fold higher than astrocytes |
| Healthy Mouse Brain [38] | [18F]GE-180 (TSPO) | ACSA2+ Astrocytes | 6.2 × 10⁻⁸ ± 0.7 × 10⁻⁸ | Confirmed specificity for microglia |
| SB28 Glioblastoma [38] | [18F]GE-180 (TSPO) | Tumor Cells | 1.7 × 10⁻⁶ ± 0.2 × 10⁻⁶ | 1.37-fold higher than TAMs |
| SB28 Glioblastoma [38] | [18F]GE-180 (TSPO) | TAMs (CD11b+) | 1.3 × 10⁻⁶ ± 0.2 × 10⁻⁶ | Higher than sham microglia |
| Amyloid Pathology [36] | 18F-FDG | Activated Microglia | Significant increase | Explains elevated PET signals in amyloid models |
Application in Radiotracer Development
scRadiotracing provides a valuable tool for radiopharmaceutical research and development, offering cellular-level validation of novel tracers that surpasses traditional macroscopic sample quantification or autoradiography blocking experiments [36]. The technique is particularly useful for investigating tracer enrichment in specific cell types and validating target engagement.
The approach shows promise for developing ligands specific to distinct microglial phenotypes, such as homeostatic versus disease-associated microglia, which would significantly advance monitoring of immunomodulatory therapies [36]. While scRadiotracing is most readily applicable to tracers binding intracellular targets, ligands with high internalization rates may also be suitable for analysis despite potential challenges with surface epitope preservation during cell processing [36].
Comprehensive scRadiotracing Protocol
Pre-isolation Procedures
Animal Preparation and Tracer Injection:
- Administer radiotracer (e.g., 18F-FDG or TSPO-specific tracers) via intravenous or intraperitoneal injection under appropriate anesthesia
- Maintain animals under controlled conditions for predetermined uptake period (tracer-dependent)
- Euthanize animals at specified time points post-injection using approved methods
- Rapidly extract target tissues (e.g., brain regions, tumors) and place in ice-cold dissociation buffer to preserve cellular integrity and tracer distribution [36] [38]
Tissue Dissociation:
- Mechanically mince tissue using sterile scalpel or scissors in appropriate buffer solution
- Enzymatic digestion using tissue-specific enzyme cocktails (e.g., collagenase/hyaluronidase for neural tissue)
- Incubate at 37°C with gentle agitation for optimized duration (typically 30-90 minutes)
- Triturate tissue suspension through progressively smaller bore pipettes to achieve single-cell suspension
- Filter through 70μm cell strainer to remove undissociated tissue clumps
- Centrifuge to pellet cells and resuspend in appropriate buffer for subsequent isolation [39] [40]
Immunomagnetic Cell Separation
Antibody Conjugation and Cell Labeling:
- Prepare magnetic bead-antibody conjugates specific to target cell surface markers (e.g., CD11b for microglia/myeloid cells, ACSA-2 for astrocytes, GFP for transfected tumor cells)
- Incubate single-cell suspension with conjugated magnetic beads according to manufacturer specifications
- Optimize antibody concentration, pH, and incubation time to ensure specific binding while minimizing nonspecific interactions [41] [39] [40]
Cell Separation:
- Apply labeled cell suspension to separation columns positioned in strong magnetic fields
- Wash columns extensively with appropriate buffer to remove unbound cells
- Elute target cell population by removing column from magnetic field and flushing with buffer
- Collect flow-through containing unlabeled cells for analysis of depleted fraction if desired
- Assess viability of isolated cells using trypan blue exclusion or similar method [39] [40] [38]
Table 2: Cell Surface Markers for Immunomagnetic Separation in Neural Tissues
| Cell Type | Surface Marker | Isolation Purity Reported | Key Applications |
|---|---|---|---|
| Microglia / Myeloid Cells [35] [38] | CD11b | >90% [38] | Neuroinflammation, Glioma TME |
| Astrocytes [38] | ACSA-2 | High purity demonstrated | Metabolic studies |
| Tumor Cells [38] | GFP (transfected) | 87% ± 2% [38] | Glioblastoma models |
| Endothelial Cells [40] | CD31 | >95% [40] | Blood-nerve barrier studies |
| Macrophages [41] | Lyz promoter-driven reporters | Cell-type specific | TAM isolation |
Radioactivity Quantification and Data Analysis
Gamma Counting and Normalization:
- Transfer isolated cell fractions to gamma counter tubes
- Measure radioactivity in each fraction using calibrated gamma counter
- Normalize measured radioactivity to injected dose and body weight (%ID*BW)
- Count cell numbers in each fraction using hemocytometer or automated cell counter
- Calculate tracer uptake per single cell by dividing total radioactivity by cell count [36] [38]
Data Interpretation and Validation:
- Compare single-cell tracer uptake across different cell populations
- Validate specificity through blocking experiments with excess cold tracer
- Correlate cellular tracer uptake with protein expression levels (e.g., via proteomics)
- Integrate with PET imaging data and histological analyses for comprehensive interpretation [38]
Experimental Workflow and Data Interpretation
The scRadiotracing methodology follows a systematic workflow that integrates in vivo interventions with ex vivo analyses to achieve cellular resolution of PET signals.
Diagram 1: scRadiotracing Experimental Workflow
Data Integration Framework
The interpretation of scRadiotracing data requires careful consideration of multiple factors to accurately allocate PET signals to specific cellular sources.
Diagram 2: scRadiotracing Data Interpretation Logic
Research Reagent Solutions
Table 3: Essential Research Reagents for scRadiotracing
| Reagent / Material | Function | Specific Examples |
|---|---|---|
| Immunomagnetic Beads [39] [40] | Cell separation using surface markers | CD11b-coated beads (microglia), CD31-coated beads (endothelial cells), GFP-trap beads (transfected cells) |
| Enzymatic Digestion Cocktails [40] | Tissue dissociation to single cells | Collagenase/Hyaluronidase mixtures, Trypsin-EDTA, Tissue-specific protease blends |
| Cell Surface Markers [35] [38] | Target identification for separation | CD11b (microglia/myeloid), ACSA-2 (astrocytes), CD31 (endothelial), cell type-specific promoters |
| Radiotracers [36] [38] [37] | PET imaging and cellular uptake | 18F-FDG (metabolism), [18F]GE-180 (TSPO), 18F-glutamine (metabolism), novel target-specific tracers |
| Magnetic Separation Equipment [39] [40] | Cell isolation platform | Commercial magnetic separators, columns, and associated buffers for gentle processing |
Methodological Considerations and Limitations
Technical Challenges and Optimization
Successful implementation of scRadiotracing requires careful attention to several technical aspects. Cell viability and integrity throughout the dissociation and sorting process is paramount, as compromised cells may leak radiotracer or exhibit altered surface marker expression. The dissociation protocol must balance thorough tissue disruption with preservation of cell surface epitopes for immunomagnetic sorting [39].
The specificity of immunomagnetic separation depends heavily on antibody selection and conjugation efficiency. Validation experiments should confirm that reporter gene expression or antibody binding displays minimal nonspecific binding, and that isolated populations exhibit expected morphological and molecular characteristics [41] [40]. Additionally, signal-to-noise ratios for radioactivity detection must be consistently maintained above reliable detection thresholds (typically ≥2) [38].
Interpretation Limitations
Several factors complicate quantitative interpretation of scRadiotracing data. The process of cell dissection and harvesting may systematically over- or underestimate proportions of viable cells in specific regions, potentially hampering accurate extrapolation to absolute cell numbers in intact tissue [36]. Furthermore, cellular proportions can be influenced by proliferation or cell loss during processing.
The technique provides a snapshot of tracer uptake at a specific time point after injection, potentially missing dynamic processes in tracer distribution and metabolism. For tracers targeting membrane-bound surface proteins, the gentle mechanical and enzymatic dissociation must preserve cell integrity and surface epitopes, while ensuring that high-affinity binders withstand hydrolytic treatment [36].
Despite these limitations, when appropriately validated and contextualized with complementary methodologies such as 3D histology and proteomics, scRadiotracing provides unprecedented insights into the cellular sources of PET signals across diverse research applications [38] [42].
The pursuit of new therapeutic agents for neurological disorders relies heavily on the ability to study specific cell types within the complex environment of the central nervous system (CNS). Isolating highly pure populations of neural cells is a critical first step for target validation and biomarker screening, enabling researchers to study disease-specific pathways and evaluate drug efficacy in physiologically relevant models [6]. Immunomagnetic separation has emerged as a cornerstone technique for this purpose, allowing for the precise purification of neurons, astrocytes, microglia, and neural stem cells based on cell surface markers [6] [13]. This application note details standardized protocols for isolating these cells, framing them within the context of a drug discovery workflow aimed at identifying novel targets and biomarkers for conditions such as Alzheimer's disease, traumatic brain injury, and stroke [6] [43].
Key Cell Isolation Methodologies
The choice of isolation methodology directly impacts the purity, viability, and functional state of the isolated cells, thereby influencing the reliability of downstream target validation and screening data. The following table summarizes the core techniques.
Table 1: Core Cell Isolation Techniques in Neuroscience Drug Discovery
| Method | Principle | Best For | Throughput | Key Advantages | Key Limitations |
|---|---|---|---|---|---|
| Immunomagnetic Separation | Antibodies against surface antigens (e.g., CD11b, ACSA-2) bound to magnetic beads [6] [13]. | High-purity isolation of specific cell types (microglia, astrocytes) from a mixed population [6]. | High | Speed, simplicity, cost-effectiveness; no need for specialized instrumentation [13]. | Limited capacity for multi-parameter sorting; unable to isolate based on intracellular markers [13]. |
| Fluorescence-Activated Cell Sorting (FACS) | Antibodies tagged with fluorophores detect surface or intracellular antigens; cells are electrostatically deflected [44]. | Isolating multiple cell types simultaneously, single-cell sorting, isolation based on expression levels [13] [44]. | Medium | Maximum flexibility and purity; multi-parameter analysis and sorting [13] [44]. | Requires expensive instrumentation; higher technical expertise; can be slower than magnetic methods [13]. |
| Density Gradient Centrifugation | Separation based on inherent cell density using a medium like Percoll [6]. | Rapid, cost-effective enrichment of specific cell types (e.g., microglia) without antibodies [6]. | High | Avoids antibody cost and potential effects of enzymatic digestion on cell surface proteins [6]. | Lower purity compared to antibody-based methods; often used as a pre-enrichment step [6]. |
Experimental Protocol: Tandem Immunomagnetic Separation of Microglia, Astrocytes, and Neurons
This protocol, adapted from current neuroscience research, allows for the sequential isolation of three key neural cell types from a single mouse brain sample, maximizing data output and minimizing biological variability for drug discovery projects [6].
Workflow Overview:
Materials:
- Magnetic Separator: Appropriate for tube size (e.g., EasySep magnet) [13].
- Magnetic Beads: Conjugated to antibodies for CD11b (microglia), ACSA-2 (astrocytes), and a non-neuronal cell biotin-antibody cocktail [6].
- Dissection Tools: Fine scissors, forceps.
- Enzymes: Trypsin or a prepared dissociation cocktail [6].
- Buffers: Phosphate-buffered saline (PBS), cell culture media.
- Cell Strainer: 70 µm mesh.
Step-by-Step Procedure:
- Tissue Dissociation:
- Euthanize a 9-day-old mouse according to approved ethical guidelines. Decapitate and carefully remove the brain.
- Dissect the desired brain region (e.g., cortex, hippocampus) and remove the meninges completely.
- Mechanically dissociate the tissue by mincing with scissors in ice-cold PBS.
- Incubate the tissue pieces with a pre-warmed enzymatic solution (e.g., trypsin) at 37°C for 15-20 minutes to digest extracellular proteins [6].
- Inactivate the protease by adding complete culture medium. Triturate the tissue further by pipetting to create a single-cell suspension.
- Pass the suspension through a 70 µm cell strainer to remove clumps and centrifugate to pellet the cells [6].
- Sequential Immunomagnetic Separation:
- Microglia Isolation (CD11b+): Resuspend the cell pellet in separation buffer. Add CD11b-conjugated magnetic beads and incubate. Place the tube in the magnetic separator. After the bead-bound cells form a pellet, carefully decant the supernatant—this contains the non-microglial cells. Remove the tube from the magnet and resuspend the pelleted CD11b+ microglia in culture medium [6] [13].
- Astrocyte Isolation (ACSA-2+): Take the supernatant from the previous step and incubate it with ACSA-2-conjugated magnetic beads. Repeat the magnetic separation process. The bead-bound ACSA-2+ astrocytes are retained, while the flow-through is collected for neuronal isolation [6].
- Neuron Isolation (Negative Selection): Incub the flow-through from the astrocyte separation with a biotinylated antibody cocktail against non-neuronal cells (e.g., remaining glial cells), followed by magnetic beads that bind the biotinylated antibodies. During magnetic separation, the labeled non-neuronal cells are retained, and the highly purified neurons are collected in the flow-through [6].
Integration with Downstream Drug Discovery Applications
Isolated primary neural cells provide a physiologically relevant platform for target validation and biomarker discovery. The following table outlines key downstream applications.
Table 2: Downstream Applications of Isolated Neural Cells in Drug Discovery
| Application | Description | Relevant Cell Types | Readout |
|---|---|---|---|
| Target Validation | Testing hypotheses about the role of specific proteins in disease pathways using genetic (siRNA, CRISPR) or pharmacological (small molecules) modulation [43]. | Neurons, Neural Stem Cells (NSCs) | Gene/protein expression, neurite outgrowth, synaptic activity, cell viability [43]. |
| High-Content Phenotypic Screening | Screening compound libraries for changes in complex morphological features indicative of neuroprotection, neurotoxicity, or altered differentiation. | Neurons (e.g., Tg2576-derived), Astrocytes | Neurite length/branching, cell body size, GFAP/MAP2 expression via immunofluorescence [43]. |
| Biomarker Identification & Screening | Using high-throughput flow cytometry to identify and quantify cell surface or intracellular biomarkers that report on disease state or drug mechanism [45] [46]. | Microglia, Tregs (as an immune model), NSCs | Surface receptor occupancy, phosphorylation states, cytokine production, population distribution [45]. |
| Disease Modeling | Utilizing cells isolated from transgenic animals (e.g., Tg2576 for Alzheimer's disease) to study pathological mechanisms in vitro [43]. | NSCs, Neurons, Astrocytes | Aβ accumulation, altered differentiation capacity, gene expression profiling [43]. |
Experimental Protocol: Biomarker Screening via High-Throughput Flow Cytometry
Purified cells can be immediately used in multiplexed biomarker screens to characterize cell states and compound effects. Flow cytometry is particularly powerful for this, offering single-cell resolution and multiparameter data [45] [46].
Workflow Overview:
Materials:
- Cells: Purified neural cell type (e.g., microglia or astrocytes).
- Compounds: Small molecule library.
- Antibodies: Fluorophore-conjugated antibodies against target biomarkers (e.g., cell surface receptors, phospho-proteins).
- Viability Stain: e.g., Propidium Iodide.
- HT Flow Cytometer: e.g., IntelliCyt HTFC Screening System with HyperCyt autosampler [46].
- Analysis Software: e.g., HyperView [46].
Step-by-Step Procedure:
- Cell Seeding and Treatment: Seed the isolated neural cells into 384-well plates at a density of 10,000-20,000 cells per well. Treat the cells with the compound library for a predetermined time (e.g., 24 hours) to probe target engagement or phenotypic changes [46].
- Multiplexed Staining: After treatment, stain the cells with a pre-optimized cocktail of antibodies. This may include:
- Surface Marker Staining: To identify cell subsets or receptor occupancy. Incubate with antibodies in PBS containing 0.1% BSA for 30 minutes on ice, then wash [45].
- Intracellular Staining (if required): For phospho-proteins or cytokines, fix and permeabilize cells using a commercial kit before antibody application [45].
- Viability Staining: Add a viability dye like Propidium Iodide to exclude dead cells from the analysis.
- High-Throughput Acquisition: Resuspend the stained cells in a suitable buffer. Use an HT flow cytometer equipped with an autosampler. The HyperCyt system, for example, can sample from a 384-well plate in about 12 minutes, creating a continuous data stream where events from each well are separated by air bubbles [46].
- Data Analysis and Hit Identification:
- Use the instrument's software to deconvolute the data, associating events with their respective well IDs.
- Apply a gating strategy to select single, live cells and then analyze biomarker expression within this population.
- Normalize data to positive and negative controls (e.g., DMSO-only vehicle). Compounds that induce a statistically significant shift in biomarker expression beyond a set threshold (e.g., Z-score > 3) are classified as "hits" [46].
The Scientist's Toolkit: Essential Research Reagents
Successful cell isolation and screening depend on high-quality, specific reagents.
Table 3: Essential Reagents for Neural Cell Isolation and Biomarker Screening
| Reagent / Tool | Function | Example(s) | Considerations for Drug Discovery |
|---|---|---|---|
| Cell-Type Specific Antibodies | Bind to surface antigens for cell identification and isolation [6] [44]. | Anti-CD11b (microglia), Anti-ACSA-2 (astrocytes), Anti-MAP2 (neurons) [6]. | Specificity is critical; validate antibodies for the species and application (IMS vs. FACS) to ensure target engagement data is reliable. |
| Magnetic Beads | Paramagnetic particles conjugated to antibodies or streptavidin for cell capture [6] [13]. | Dynabeads, EasySep reagents [6] [13]. | Choose column-free vs. column-based systems based on throughput and sample type. Column-free is often faster and avoids clogging [13]. |
| Fluorophore-Conjugated Antibodies | Enable detection of multiple biomarkers via flow cytometry [45] [46]. | Antibodies conjugated to FITC, PE, APC, etc. | Panel design must account for spectral overlap. Requires validation for intracellular targets if used for phospho-signaling [45]. |
| Enzymatic Dissociation Kits | Digest tissue into single-cell suspensions while preserving cell surface epitopes. | Trypsin-based kits, papain-based kits, gentleMACS Dissociators. | Optimization is required to balance yield and viability; excessive digestion can damage surface markers, affecting isolation purity. |
| Transgenic Animal Models | Provide a source of disease-relevant cells for isolation and study [43]. | Tg2576 mice (Alzheimer's model) [43]. | Cells retain disease pathology (e.g., Aβ accumulation), providing a more relevant system for target validation and compound screening [43]. |
Solving Common Problems and Maximizing Purity, Yield, and Viability
Within the broader scope of thesis research on immunomagnetic separation (IMS) for purifying specific neural cell types, achieving high cell purity is paramount for downstream molecular and functional analyses. Low target cell purity often stems from suboptimal ratios of antibodies to magnetic beads during the cell labeling step, leading to either insufficient target cell capture or excessive non-specific binding [13] [33]. This application note provides a detailed, experimentally-validated framework for systematically optimizing these critical ratios, with a specific focus on applications in neural cell isolation. The protocols and data summarized herein are designed to enable researchers to precisely tailor IMS protocols for their specific cell systems, thereby maximizing purity, yield, and viability for reliable research outcomes.
The Critical Role of Ratios in Immunomagnetic Separation
Immunomagnetic separation relies on the specific binding of antibody-coated magnetic beads to surface antigens on target cells. The efficiency of this binding is a primary determinant of final cell purity and yield [13]. The key parameters requiring optimization are the antibody-to-cell ratio and the bead-to-cell ratio.
An inadequate antibody-to-cell ratio results in insufficient saturation of target cell epitopes, causing low capture efficiency as cells fail to be tagged with enough magnetic particles. Conversely, an excessive antibody concentration can promote non-specific binding through hydrophobic or charge-based interactions, increasing background contamination from non-target cells [33]. Similarly, a low bead-to-cell ratio means that not all labeled cells can be coupled to a bead, drastically reducing recovery. An excessively high bead-to-cell ratio wastes costly reagents and can increase non-specific trapping of non-target cells in magnetic bead aggregates, thereby compromising purity [13]. Furthermore, for sensitive downstream applications like single-cell electrophysiology, the physical presence of a high density of beads on the cell surface could, in theory, interfere with cellular function, although studies on CD4+ T-cells have shown that the presence of magnetic beads does not significantly alter the biophysical properties of ion channels like Kv1.3 [47].
The following diagram illustrates the logical workflow for diagnosing and troubleshooting low cell purity in an IMS experiment, guiding researchers to the appropriate optimization steps.
Experimental Protocols for Ratio Optimization
A systematic, empirical approach is required to determine the optimal ratios for a previously uncharacterized cell type or new reagent batch. The following protocol outlines a small-scale, high-throughput method suitable for this purpose.
Preliminary Small-Scale Titration Experiment
This protocol is designed to be performed in a 96-well plate format, allowing for the parallel testing of multiple conditions with minimal reagent and sample consumption [48].
Materials Required:
- Single-cell suspension of neural tissue (e.g., enzymatically dissociated postnatal rat brain or optic nerve [49]).
- Primary antibody against target neural cell surface antigen (e.g., A2B5 for O-2A progenitor cells [49]).
- Secondary antibody-conjugated magnetic beads (e.g., anti-mouse IgG MicroBeads for a mouse primary antibody) OR direct conjugate magnetic beads.
- Buffer: PBS pH 7.2, supplemented with 0.5% BSA and 2 mM EDTA.
- Magnetic separation unit (e.g., for 96-well plates or small tubes).
- Cell culture incubator and centrifuge.
Step-by-Step Procedure:
- Prepare Cell Suspension: Generate a single-cell suspension from your neural tissue source using standard enzymatic dissociation methods. Determine the exact cell concentration and viability.
- Set Up Titration Plate: Aliquot a fixed number of cells (e.g., 1 x 10^5 cells per well) into multiple wells of a 96-well plate.
- Titrate Primary Antibody: Add a range of concentrations of the primary antibody to the cells. A suggested starting range is 0.1 µg to 10 µg per 1 x 10^6 cells. Incubate on a rotator for 15-20 minutes at 4°C. Include a no-antibody control.
- Wash: Add buffer to each well and centrifuge the plate to pellet cells. Carefully remove the supernatant to eliminate unbound antibody.
- Titrate Magnetic Beads: Re-suspend the cell pellets in buffer containing a range of magnetic bead volumes. A suggested starting point is a bead-to-cell ratio from 1:1 to 50:1. Incubate on a rotator for 15-20 minutes at 4°C.
- Magnetic Separation: Place the plate on the magnetic separator for 2-5 minutes. Carefully aspirate and save the supernatant (this contains the unbound, negatively selected fraction).
- Wash Bound Fraction: While the plate remains on the magnet, add fresh buffer to the wells containing the bead-bound cells, incubate for 1-2 minutes, and aspirate the wash. Repeat this wash step twice.
- Elute and Analyze: Remove the plate from the magnet and re-suspend the positively selected cells in an appropriate medium. Count the cells in both the positive eluate and the negative supernatant fractions using an automated cell counter or flow cytometer. Assess the purity of the positive fraction via flow cytometry using a different antibody against the target cell type or by morphological analysis in culture [49].
Key Parameters to Monitor
During the optimization process, track the following metrics for each condition:
- Purity (%): Percentage of target cells in the positively selected fraction.
- Yield (%): Percentage of initial target cells recovered in the positive fraction.
- Viability (%): Percentage of live cells in the positive fraction (e.g., via Trypan Blue exclusion or 7-AAD staining [47]).
Data Presentation and Analysis
The data generated from the titration experiment should be compiled to identify the condition that offers the best balance between high purity and acceptable yield. The table below provides a hypothetical data set for the isolation of A2B5+ O-2A progenitor cells, illustrating how to interpret results.
Table 1: Sample Data from Optimization of A2B5+ O-2A Progenitor Cell Isolation from Rat Optic Nerve
| Antibody (µg/10^6 cells) | Bead-to-Cell Ratio | Purity (%) A2B5+ | Yield (%) | Viability (%) |
|---|---|---|---|---|
| 0.5 | 10:1 | 85.2 | 45.5 | 95.1 |
| 1.0 | 10:1 | 96.8 | 65.3 | 96.5 |
| 2.0 | 10:1 | 98.5 | 75.1 | 95.8 |
| 5.0 | 10:1 | 98.0 | 74.5 | 94.0 |
| 2.0 | 5:1 | 95.5 | 60.2 | 96.2 |
| 2.0 | 20:1 | 97.8 | 76.0 | 92.3 |
| 2.0 | 50:1 | 96.5 | 75.5 | 90.1 |
Based on the sample data in Table 1, the condition using 2.0 µg antibody per 10^6 cells and a bead-to-cell ratio of 20:1 provides an excellent combination of high purity (~98%), high yield (~76%), and good viability (~92%). This condition would be selected for subsequent, larger-scale isolations.
The relationship between reagent ratios and the outcomes of purity and yield can be visualized as an optimization surface, guiding the selection of the ideal parameters.
The Scientist's Toolkit: Research Reagent Solutions
Selecting the appropriate tools is fundamental to a successful IMS workflow. The following table details key reagents and their critical functions in the context of neural cell purification.
Table 2: Essential Research Reagents for Immunomagnetic Separation
| Item | Function & Role in Optimization | Example Product/Chemistry |
|---|---|---|
| Cell Suspension | Provides the heterogeneous starting material. Tissue dissociation protocol critically impacts cell surface antigen integrity and viability. | Enzymatically dissociated rat central nervous system tissue [49]. |
| Specific Primary Antibody | Binds selectively to a surface antigen on the target neural cell (e.g., A2B5, RAN-2). The clone, affinity, and specificity are paramount [49]. | A2B5 for O-2A progenitor cells; RAN-2 for astrocytes [49]. |
| Magnetic Beads | Provides the magnetic moment for separation. Size (nm to µm), composition (e.g., superparamagnetic), and surface coating affect binding capacity and kinetics. | Secondary antibody-coated beads; ~50 nm nano-sized beads (e.g., MACS MicroBeads) for high-purity cell sorting [33] [47]. |
| Separation Platform | Generates the magnetic field to retain labeled cells. Choice between column-based and column-free formats affects ease-of-use, speed, and scalability [13]. | Column-based separators (e.g., MACS columns) or column-free magnets (e.g., EasySep magnets) [13]. |
| REAlease Kit | Allows for the removal of magnetic beads and antibody fragments after sorting. Essential for functional studies where surface receptor integrity is critical [47]. | REAlease Kit (Miltenyi Biotec) for generating bead-free and label-free cell populations [47]. |
Optimizing the antibody-to-cell and bead-to-cell ratios is not a mere suggestion but a necessity for achieving the high cell purity required for advanced neuroscience research, such as single-cell transcriptomics, proteomics, or electrophysiology. The empirical, small-scale approach outlined in this application note provides a robust and resource-efficient strategy for identifying these optimal conditions. By systematically diagnosing the root cause of low purity and implementing the detailed titration protocol, researchers can significantly enhance the performance of their immunomagnetic separation protocols, thereby ensuring that the isolated neural cell populations are of sufficient quality to yield reliable and biologically relevant data.
Immunomagnetic separation (IMS) is a powerful technique for isolating highly pure populations of target cells from complex mixtures. However, low cell recovery remains a significant challenge, particularly when working with rare or sensitive cell populations such as neural cells. Two critical factors profoundly influencing recovery efficiency are incubation time and non-specific binding (NSB). Optimizing these parameters is essential for obtaining sufficient cell numbers for downstream applications in neuroscience research and drug development. This application note systematically analyzes the impact of incubation time and NSB on cell recovery in IMS and provides evidence-based protocols to maximize target cell yield while maintaining purity, with specific consideration for neural cell isolation.
Quantitative Data Analysis of Recovery Challenges
Documented Recovery Rates Across Cell Types
The following table summarizes documented recovery rates and the impact of protocol modifications across various IMS applications, highlighting the pervasive nature of low recovery challenges.
Table 1: Documented Cell Recovery Rates in Immunomagnetic Separation Protocols
| Cell Type/Application | Standard Protocol Recovery | Optimized Protocol Recovery | Key Optimization Factor | Citation |
|---|---|---|---|---|
| Peripheral Blood B-cells | 11.0-18.6% (CliniMACS Plus) | 37.7% (Modified CliniMACS Prodigy) | Exhaustive column rinsing, modified activity matrix | [50] |
| Circulating Tumor Cells (CTCs) | Not specified (EasySep) | Higher recovery (Inertial microfluidics) | Label-free, size-based separation avoiding NSB | [51] |
| Human Adipose Microvascular Endothelial Cells | Overgrowth by stromal cells | Purity preventing overgrowth | Mitigated non-specific IMP uptake | [52] |
| CD45-negative Rare Cells | Variable, contamination issues | 96% recovery, 1600-fold depletion | Dynamic magnetic labeling, simplified capture | [53] |
Impact of Non-Specific Binding on Separation Efficiency
Non-specific binding (NSB) represents a major contributor to low recovery and purity. The following table systematizes the causes and solutions for NSB identified in recent research.
Table 2: Strategies to Mitigate Non-Specific Binding (NSB) in IMS
| Primary Cause of NSB | Impact on Recovery/Purity | Effective Mitigation Strategy | Evidence of Improvement | Citation |
|---|---|---|---|---|
| Coordination between surface iron and bacterial membranes | Reduced capture selectivity, false positives | Dextrin-functionalized IOPs (hydroxyl-rich coating) | >80% capture efficiency, minimal NSB in whole milk | [54] |
| Non-specific uptake of immunomagnetic particles (IMPs) | Stromal cell overgrowth, reduced purity | Optimized washing, blocking, and IMP formulation | HAMVEC cultures achieving purities preventing overgrowth | [52] |
| Electrostatic and hydrophobic interactions | Non-target cell retention, reduced purity | Hydration layer formation via hydroxyl-rich coatings | Selective bacterial capture in complex matrices | [54] |
Experimental Protocols for Optimization
Protocol: Optimization of Immunomagnetic Incubation Time
This protocol describes a systematic approach to determine the optimal incubation time for IMS, balancing recovery against purity.
Materials
- Magnetic separation platform: CliniMACS Prodigy (or equivalent system for neural cells) [50]
- Immunomagnetic particles: CD19 MicroBeads (for B-cell model) or neural cell-specific beads (e.g., CD271 for neural crest-derived cells)
- Cell suspension: Target neural cells spiked into a heterogeneous suspension
- Buffer: PBS with 0.5% BSA and 2mM EDTA
- Platform: MACS Column placed in a magnetic field
Procedure
- Prepare cell suspension: Create a single-cell suspension at a concentration of 1×10⁷ cells/mL in buffer.
- Add immunomagnetic particles: Combine cells with beads according to manufacturer's recommended ratio.
- Incubate with varying times: Aliquot the cell-bead mixture into separate tubes. Incubate at 2-8°C for 5, 15, 30, and 60 minutes with gentle agitation.
- Separate and wash: Apply each aliquot to a separation column. Wash with buffer using three column volumes.
- Elute and quantify: Remove the column from the magnetic field and elute positively selected cells. Count cells using a hemocytometer or automated cell counter and determine viability.
- Assess purity: Analyze eluted fractions by flow cytometry using antibodies against target neural markers (e.g., NCAM, βIII-tubulin) and non-target markers.
Data Analysis
- Plot recovery percentage and purity percentage against incubation time.
- Identify the incubation time that provides the optimal balance between recovery and purity.
- For neural cells with delicate processes, shorter incubation times with gentle agitation may preserve viability despite slightly lower recovery.
Protocol: Reduction of Non-Specific Binding Through Surface Engineering
This protocol outlines the application of surface-engineered particles to minimize NSB, adapted from food safety and endothelial cell isolation research for neural cell applications [54] [52].
Materials
- Surface-modified particles: Dextrin-functionalized iron oxide particles (IOPs) or commercially available beads with hydroxyl-rich coatings [54]
- Antibody conjugation system: Maltose-binding protein (MBP) and streptococcal protein G (SPG) fusion protein for oriented antibody immobilization [54]
- Neural cell-specific antibody: e.g., anti-CD271 for neural stem cells or anti-A2B5 for glial precursors
- Blocking solution: PBS with 2% BSA or 1% HSA
- Wash buffer: PBS with 0.1% BSA
Procedure
- Conjugate antibodies to coated particles: Incubate surface-engineered particles with neural-specific antibodies using the MBP-SPG fusion system for optimal orientation.
- Block non-specific sites: Incubate conjugated beads with blocking solution for 1 hour at 4°C.
- Prepare cell suspension: Create a single-cell suspension of neural tissue digest or cultured cells at 1×10⁷ cells/mL.
- Perform immunomagnetic separation: Incubate cells with blocked, conjugated beads for the optimized time determined in Protocol 3.1.
- Wash stringently: Perform three washes with wash buffer, retaining the beads magnetically between washes.
- Elute and analyze: Elute bound cells and assess recovery, viability, and purity as described in Protocol 3.1.
Data Analysis
- Compare recovery and purity between standard and surface-engineered particles.
- Assess non-specific binding by analyzing the presence of non-target cells in the eluted fraction via flow cytometry.
- For neural cells, functional validation may include differentiation assays to confirm retained multipotency after separation.
The Scientist's Toolkit: Research Reagent Solutions
Table 3: Essential Reagents for Optimizing Immunomagnetic Separation
| Reagent/Category | Specific Examples | Function in IMS Optimization | Application Notes |
|---|---|---|---|
| Surface-Engineered Particles | Dextrin-functionalized IOPs; Hydroxyl-rich coatings | Reduce NSB via stable hydration layers | Superior to carboxyl-based modifications for NSB suppression [54] |
| Oriented Immobilization Systems | MBP-SPG fusion protein; Protein A-coated beads | Ensure proper antibody orientation | Enhances binding efficiency, reduces antibody consumption [54] |
| Cell Separation Platforms | CliniMACS Prodigy; EasySep; MACS Columns | Provide standardized magnetic separation | Modified protocols can significantly improve recovery [50] [51] |
| Blocking Agents | BSA (1-2%); HSA (1%); Serum proteins | Minimize non-specific interactions | Concentration optimization critical for sensitive neural cells |
| Hydration Layer Promoters | Dextrin; Polyethylene glycol (PEG) | Form protective hydration shells | Hydroxyl groups more effective than carboxyl groups [54] |
Workflow and Pathway Diagrams
Optimizing immunomagnetic separation for challenging applications like neural cell isolation requires a systematic approach addressing both incubation parameters and non-specific binding. Evidence indicates that modifying incubation times and implementing surface-engineered particles with hydroxyl-rich coatings can dramatically improve recovery rates while maintaining high purity. The protocols and data presented here provide researchers with actionable strategies to overcome the prevalent challenge of low cell recovery in IMS, enabling more reliable isolation of neural cell populations for neuroscience research and therapeutic development. As IMS technology continues to evolve, attention to these fundamental parameters will remain essential for maximizing the potential of cell-based research and therapies.
The isolation of high-viability neural cells via immunomagnetic separation requires exceptionally clean single-cell suspensions, free from the myelin debris that plagues brain tissue processing. Myelin fragments can clog separation columns, non-specifically bind to magnetic beads, and reduce the purity and yield of target cells. The choice of myelin removal method therefore directly impacts the success of downstream immunomagnetic purification. This application note provides a quantitative comparison of Percoll and sucrose gradient centrifugation—the two predominant myelin removal techniques—and delivers optimized protocols to maximize cell viability and yield for your immunomagnetic separation research.
Quantitative Comparison of Myelin Removal Methods
The following table summarizes key performance characteristics of Percoll and sucrose density gradient methods based on current literature.
Table 1: Quantitative Comparison of Myelin Removal Methods
| Feature | Percoll Gradient | Sucrose Gradient |
|---|---|---|
| Fundamental Principle | Silica nanoparticles coated with PVP; creates an iso-osmotic density gradient [55] | High-concentration sugar solution creating an osmotic gradient [55] |
| Typical Working Concentration | 24-30% (v/v) in isotonic buffer [56] [55] [57] | 30% (w/v?) in appropriate buffer [55] |
| Myelin Removal Efficacy | High; 24-26% SIP effectively pellets myelin debris without cells [56] | Lower; less effective at removing non-immune cells compared to Percoll [55] |
| Microglial Yield | ~1.09 x 10^6 cells (with accutase digestion) [55] | ~0.99 x 10^6 cells (with accutase digestion) [55] |
| Impact on Cell Viability | Maintains high viability when optimized [56] | Maintains viability, but may be less gentle than Percoll due to osmotic stress [55] |
| Key Advantages | • Iso-osmotic, minimizing cell stress• Highly effective for myelin removal• High cell yield and viability [56] [55] [57] | • Simple and cost-effective preparation [55] |
| Key Disadvantages | • Higher cost• Requires precise concentration optimization [56] | • Creates osmotic stress for cells• Lower effectiveness in myelin and non-immune cell removal [55] |
| Recommended Best Use | Superior choice for most applications, especially when high purity and viability are critical for IMS. | A viable alternative when cost is a primary constraint and slightly lower purity is acceptable. |
Detailed Experimental Protocols
Protocol 1: Myelin Removal Using an Optimized Percoll Gradient
This protocol is adapted for high cell viability, making it ideal for subsequent immunomagnetic separation.
Research Reagent Solutions
- Percoll Stock Solution: Purchase commercially available sterile Percoll.
- Hank's Balanced Salt Solution (HBSS): Without Ca++ and Mg++.
- Sample Preparation Medium: DMEM/F-12 with 15 mM HEPES or HBSS, containing 2% Fetal Bovine Serum (FBS). FBS helps to block non-specific binding in downstream steps [57].
- Phosphate Buffered Saline (PBS): Ice-cold, for perfusion and washes.
Procedure
- Tissue Dissociation: Begin with a mechanically and enzymatically dissociated single-cell suspension from brain tissue. (Note: Protease selection—such as papain or accutase—significantly affects the viability of various brain cell types and should be optimized for your target cells [56] [55] [58]).
- Centrifugation: Centrifuge the cell suspension at 300 x g for 10 minutes. Carefully discard the supernatant [57].
- Percoll Solution Preparation: Prepare a 24-30% isotonic Percoll (SIP) solution by mixing the appropriate volume of Percoll with 10X PBS and sterile water to achieve 1X final concentration. A 24% SIP solution is particularly effective at removing myelin debris while preserving cells [56].
- Resuspension: Gently but thoroughly resuspend the cell pellet in the prepared Percoll solution. Use 6 mL of Percoll solution per mouse brain [57].
- Density Gradient Centrifugation: Transfer the suspension to a centrifuge tube and spin at 700 x g for 10 minutes with the brake disengaged [57]. This step is critical to prevent disturbing the gradient.
- Myelin Removal: After centrifugation, myelin will form a thick, white layer at the top of the tube. Carefully aspirate and discard this myelin layer using a wide-bore pipette tip or a serological pipette.
- Cell Collection: The intact cells will form a pellet at the bottom of the tube. Carefully remove and discard the remaining Percoll supernatant without disturbing the cell pellet.
- Wash: Resuspend the cell pellet in a generous volume (e.g., 10-20 mL) of sample preparation medium to dilute any residual Percoll.
- Final Centrifugation: Centrifuge at 300 x g for 10 minutes to wash the cells. Discard the supernatant. The cell pellet is now a myelin-depleted suspension ready for immunomagnetic labeling and separation [57].
Protocol 2: Myelin Removal Using a Sucrose Gradient
This protocol offers a cost-effective alternative, though it may result in lower final purity.
Research Reagent Solutions
- Sucrose Solution: 30% (w/v) sucrose in PBS or HBSS. Filter sterilize.
- Sample Preparation Medium: As described in Protocol 1.
- PBS: Ice-cold.
Procedure
- Tissue Dissociation: Obtain a single-cell suspension as in Protocol 1.
- Centrifugation: Centrifuge the cell suspension at 300 x g for 10 minutes. Discard the supernatant.
- Resuspension: Resuspend the cell pellet in the 30% sucrose solution.
- Density Gradient Centrifugation: Layer the cell-sucrose suspension over a cushion of sample preparation medium in a centrifuge tube. Centrifuge at 700 x g for 10 minutes with the brake disengaged [55].
- Myelin and Cell Collection: After centrifugation, myelin fragments and dead cells will often be found at the interface between the sucrose and the medium, while viable cells form a pellet. Carefully aspirate the supernatant, including the interface.
- Wash: Resuspend the cell pellet in sample preparation medium and centrifuge at 300 x g for 10 minutes to wash out the sucrose.
- Final Preparation: Discard the supernatant. The resulting cell pellet can be used for immunomagnetic separation, though expect a lower purity than with Percoll [55].
Integrated Workflow for Immunomagnetic Separation
The diagram below illustrates the critical decision point for myelin removal within the broader context of a cell isolation workflow culminating in immunomagnetic separation.
The Scientist's Toolkit: Essential Research Reagents
The following table lists key reagents critical for successful myelin removal and cell isolation.
Table 2: Essential Reagents for Myelin Removal and Cell Preparation
| Reagent | Function/Application | Key Considerations |
|---|---|---|
| Percoll | Silica-based density gradient medium for myelin removal. | Opt for pre-made, sterile solutions to ensure consistency and avoid endotoxin contamination. |
| Papain | Protease for enzymatic tissue dissociation. | Must be activated immediately before use with cysteine-HCl and EDTA for full activity [57]. |
| Accutase | Enzymatic blend (proteases & collagenases) for tissue dissociation. | Gentle on cell surface antigens; results in high microglial yield with low variance [55]. |
| DNase I | Enzyme that degrades DNA. | Prevents cell clumping by digesting DNA released from damaged cells during dissociation [57] [58]. |
| Fetal Bovine Serum (FBS) | Protein component of wash and resuspension media. | Acts as a blocking agent to reduce non-specific binding of antibodies and beads in downstream steps [57]. |
| MACS Buffer (PBS + EDTA + BSA) | Standard buffer for immunomagnetic separation. | Protects cell viability, prevents clumping, and provides an ideal medium for magnetic labeling. |
For immunomagnetic separation protocols where the integrity of cell surface epitopes and overall cell viability are paramount, the Percoll density gradient method is the unequivocally recommended choice. Its iso-osmotic properties and superior myelin-clearing capability consistently yield cleaner cell suspensions, which directly translates to higher efficiency and purity in subsequent magnetic column-based purification. While the sucrose gradient provides a valid and more economical alternative for certain exploratory studies, the Percoll-based protocol offers the robustness and performance required for generating reliable, publication-quality data in neural cell research and drug development.
Immunomagnetic separation has become a cornerstone technique for the purification of specific cell types, proving particularly invaluable in neuroscience research where obtaining homogenous populations of neural cells from complex tissues is a critical first step. This method relies on the use of magnetic beads conjugated with antibodies to target specific cell surface antigens, enabling the physical isolation of desired cells from a heterogeneous mixture. The two principal formats for this technology are column-based and column-free magnetic separation. The choice between these systems significantly impacts experimental outcomes, workflow efficiency, and cell viability. This application note provides a detailed comparison of these two formats and outlines specific protocols for their use in purifying neural cells, providing researchers with the data needed to select the optimal method for their experimental goals.
Technical Comparison: Column-Based vs. Column-Free Systems
The core difference between these systems lies in their separation mechanics. Column-based separation involves passing a magnetically labeled cell sample through a column matrix seated within a magnetic field [13]. The column is filled with ferromagnetic spheres that create a high-gradient magnetic field, trapping labeled cells while non-target cells pass through [13]. In contrast, column-free separation involves placing a tube containing the magnetically labeled sample directly into a magnetic field, causing the labeled cells to migrate toward the magnet and be immobilized at the tube wall, allowing the supernatant containing unlabeled cells to be decanted or pipetted away [13].
The following table summarizes the key operational differences between the two formats, informed by both commercial and research applications [13] [59].
Table 1: Comparative Analysis of Column-Based and Column-Free Magnetic Separation Systems
| Feature | Column-Based System | Column-Free System |
|---|---|---|
| Separation Principle | Filtration through a magnetized column matrix [13] | Direct immersion of sample tube in a magnetic field [13] |
| Typical Bead Size | Small beads (20-50 nm) [59] | Medium-sized beads (~100 nm) [59] |
| Key Advantage | High purity of isolation [13] [59] | High speed and simplicity [60] [13] [61] |
| Typical Hands-On Time | ~30 minutes [59] | As little as 8-25 minutes [61] [59] |
| Sample Clogging Risk | Higher risk, especially with tissue samples containing debris [13] | Lower risk, as there is no column to clog [13] |
| Cell Viability & Function | Potential for mechanical stress on cells from column passage [13] | Generally higher; reduced mechanical stress preserves cell functionality [61] |
| Throughput & Scalability | Requires a new column for each sample, which can be costly [13] | Easier scaling; can process larger sample volumes in a single tube [61] |
| Best Suited For | Isolating low-abundance target cells from complex samples [59] | Rapid isolations and experiments requiring highly viable, functional cells [61] |
Application Protocols for Neural Cell Isolation
The following protocols are adapted from established methodologies for isolating specific neural cell types from primary brain tissue, illustrating the application of both column-based and column-free techniques.
Protocol 1: Column-Based Positive Selection of Oligodendrocytes
This protocol details the isolation of primary oligodendrocytes from a murine neural cell suspension using a column-based immunomagnetic system [62].
Workflow Overview:
Detailed Reagents and Steps:
Reagents:
- Neural cell suspension from mouse pup brain.
- Magnetic cell sorting buffer.
- Anti-O4 antibody-conjugated magnetic microbeads.
- Oligodendrocyte proliferation medium.
Procedure:
- Preparation: Resuspend the neural cell suspension in an appropriate volume of magnetic cell sorting buffer to prevent cell clumping [62].
- Labeling: Add anti-O4 magnetic microbeads to the cell suspension. The O4 antibody targets a sulfated galactolipid antigen on the surface of oligodendrocytes [62]. Agitate the mixture gently to ensure uniform exposure.
- Incubation: Incubate the cell-bead mixture for 15 minutes at 4°C. Gently flick the tube every 5 minutes to resuspend the cells. This low-temperature incubation promotes specific binding while minimizing non-specific internalization of beads.
- Washing: Add 2 mL of magnetic cell sorting buffer per 1 x 10^7 cells and centrifuge. Carefully aspirate and discard the supernatant to remove unbound beads.
- Column Setup: Place a pre-rinsed magnetic bead-sorting column into the magnetic separator. Place a 40-micron strainer on top of the column.
- Separation: Apply the resuspended cell sample onto the strainer. Allow the unbound, non-target cells to pass through the column, which is held in the magnetic field. The magnetically labeled oligodendrocytes are retained within the column.
- Washing: Wash the column three times with 3 mL of magnetic cell sorting buffer per wash to remove any residual unbound cells thoroughly.
- Elution: Transfer the column to a clean 15 mL collection tube. Use a plunger to flush out the purified oligodendrocytes with 5 mL of oligodendrocyte proliferation medium, eluting the target cells by displacing them from the magnetic field [62].
Protocol 2: Column-Free Tandem Isolation of Multiple Neural Cell Types
This advanced protocol demonstrates the sequential, column-free isolation of microglia, astrocytes, and neurons from the same single-cell suspension of mouse brain tissue, using a negative selection strategy for neurons [6].
Workflow Overview:
Detailed Reagents and Steps:
Reagents:
- Single-cell suspension from dissociated mouse brain tissue (e.g., from 9-day-old mice).
- Column-free magnetic separation instrument (e.g., EasySep magnet).
- Magnetic beads conjugated to: Anti-CD11b (for microglia), Anti-ACSA-2 (for astrocytes), and a biotinylated non-neuronal cell antibody cocktail.
Procedure:
- Isolate Microglia: Incubate the initial single-cell suspension with magnetic beads conjugated to an anti-CD11b antibody. CD11b (Integrin Alpha M) is a surface marker for microglia and other myeloid cells [6]. Place the tube in a column-free magnet. The CD11b+ microglia will be pulled to the tube's sides. Pour off the supernatant, which is the negative fraction containing all other cells, and set it aside. The positively selected microglia can be retrieved by resuspending the bead-bound fraction after removal from the magnet.
- Isolate Astrocytes: Take the negative fraction from the previous step and incubate it with magnetic beads conjugated to an Anti-ACSA-2 (Astrocyte Cell Surface Antigen-2) antibody [6]. Repeat the magnetic separation in the column-free magnet. The ACSA-2+ astrocytes will be immobilized, allowing you to collect the negative fraction by decanting. This negative fraction now contains primarily neurons and is depleted of microglia and astrocytes.
- Isolate Neurons: The final negative fraction is incubated with a biotinylated antibody cocktail against non-neuronal cells and magnetic beads. This cocktail depletes any remaining non-target cells. When this mixture is placed in the magnet, the labeled non-neuronal cells are immobilized against the tube wall. The desired, untouched neurons remain in the supernatant and can be simply poured off into a new tube, resulting in a highly purified neuronal population [6].
The Scientist's Toolkit: Essential Research Reagents
The following table lists key reagents and materials essential for successfully implementing immunomagnetic separation for neural cell isolation.
Table 2: Essential Reagents for Immunomagnetic Separation of Neural Cells
| Item | Function/Description | Example Application |
|---|---|---|
| Magnetic Beads | Micron-sized particles coated with antibodies for cell targeting. Sizes range from 20-100nm [59]. | Cell surface antigen recognition (e.g., O4, CD11b, ACSA-2) [6] [62]. |
| Cell Sorting Buffer | A balanced salt solution, often with additives like EDTA, to prevent cell clumping and ensure viability. | Used to wash and resuspend cells during the separation process [62]. |
| Specific Antibodies | Monoclonal antibodies define the specificity of the cell isolation. | Anti-O4 (oligodendrocytes), Anti-CD11b (microglia), Anti-ACSA-2 (astrocytes) [6]. |
| Magnetic Separator | Device generating the magnetic field. Format varies (column holder or tube stand). | Physical separation of bead-bound cells from unlabeled cells [13] [61]. |
| Separation Column | (For column-based systems) A column with a ferromagnetic matrix to capture labeled cells. | Creates a high-gradient magnetic field for high-purity isolation [13]. |
| Enzymatic Digestion Mix | A blend of enzymes (e.g., trypsin, papain) to dissociate solid brain tissue. | Creating a single-cell suspension from primary brain tissue for subsequent separation [6]. |
Assessing Technique Efficacy, Phenotype Preservation, and Method Comparison
Within the context of a broader thesis on immunomagnetic separation for purifying specific neural cell types, validating the success of the isolation procedure is a critical step. The functional reliability of downstream applications, from transcriptomic analysis to in vitro disease modeling, is contingent upon obtaining a cell population of high purity and correct phenotypic identity [6] [63]. Flow cytometry stands as a powerful and quantitative method for this essential validation, enabling researchers to confirm both the purity of the isolated fraction and the presence of defining phenotypic markers [64]. This Application Note provides detailed protocols and data analysis frameworks for using flow cytometry to validate the isolation of neural cells, such as neurons, astrocytes, and microglia, following immunomagnetic separation.
The Critical Role of Validation in Cell Isolation Workflows
Immunomagnetic separation has become a cornerstone technique for isolating neural cell types due to its relative simplicity, high speed, and cost-effectiveness compared to fluorescence-activated cell sorting (FACS) [49] [13]. However, the isolation process itself, whether based on positive or negative selection, presents potential pitfalls that necessitate validation.
- Purity and Yield: The primary goal of isolation is to obtain a high yield of the target cell type with minimal contamination from other neural cells. Flow cytometry provides a quantitative assessment of the separation efficiency [63].
- Phenotypic Integrity: The process of tissue dissociation, enzymatic digestion, and antibody binding during immunomagnetic separation has the potential to activate cells or alter their surface marker profile. This is a particular concern for sensitive cells like microglia, which can rapidly change their morphology and phenotype in culture [6]. Validation ensures that the isolated cells retain the key characteristics of their in vivo counterparts.
- Experimental Reproducibility: Primary cells are inherently variable, and batch-to-batch differences in isolations can impact experimental outcomes [6]. Consistent validation using flow cytometry establishes a quality control checkpoint, ensuring that only isolations meeting pre-defined purity criteria are used for downstream experiments.
While image cytometry is an emerging alternative that allows cells to be analyzed in their culture environment—preserving data on morphology and protein localization—flow cytometry remains the gold standard for high-throughput, quantitative analysis of cell suspensions [65].
Experimental Protocol: Validating Immunomagnetically Isolated Neural Cells
This protocol is designed to be performed immediately after the immunomagnetic separation of cells from brain tissue.
Sample Preparation and Staining
- Prepare Single-Cell Suspension: The starting material for flow cytometry is a single-cell suspension. If the immunomagnetic isolation procedure (e.g., using a tandem protocol with CD11b, ACSA-2, and a neuronal biotin-antibody cocktail) has already yielded this, proceed to the next step [6]. Ensure cell viability is high; consider using a viability dye to exclude dead cells from the analysis.
- Aliquot Cells: Aliquot approximately (1 \times 10^5) to (5 \times 10^5 ) cells into separate flow cytometry tubes for each staining condition (unstained, single-color controls, and the experimental panel).
- Blocking: Incubate cells with an Fc receptor blocking agent (e.g., purified anti-CD16/32) for 10 minutes on ice to reduce non-specific antibody binding.
- Antibody Staining: Prepare a master mix of fluorescently-conjugated antibodies diluted in an appropriate buffer (e.g., PBS with 2% FBS). The panel should include antibodies against the target marker used for isolation (to assess purity) and additional markers to confirm phenotype and check for contamination.
- Example Panel for Microglia Validation:
- Purity Marker: Anti-CD11b-APC (to confirm isolation of the target population)
- Identity/Phenotype Marker: Anti-TMEM119-PE (a specific microglial marker) [6]
- Contamination Check: Anti-GFAP-FITC (to detect astrocyte contamination)
- Incubate cells with the antibody mix for 20-30 minutes in the dark at 4°C.
- Example Panel for Microglia Validation:
- Washing and Resuspension: Wash cells twice with cold buffer to remove unbound antibody. Resuspend the final cell pellet in 200-500 µL of flow cytometry buffer containing a viability dye like 7-AAD or DAPI [47]. Pass the suspension through a cell strainer cap to remove any clumps before acquisition.
Data Acquisition and Analysis
- Instrument Setup: Calibrate the flow cytometer using appropriate calibration beads. Set photomultiplier tube (PMT) voltages using unstained and single-stained controls.
- Compensation: Use single-stained controls to calculate compensation settings for spectral overlap between fluorescent channels.
- Acquisition: Acquire a minimum of 10,000 events per sample. Record all data for subsequent analysis.
- Gating Strategy: The analysis involves a sequential gating strategy to identify the live, single-cell population and then analyze marker expression within it.
- Viable Cells: Gate on cells that exclude the viability dye.
- Single Cells: Gate on viable cells using FSC-A vs. FSC-H to exclude doublets and cell aggregates [64].
- Target Population Analysis: On the pre-gated single, live cells, create plots for the relevant markers (e.g., CD11b vs. TMEM119). The percentage of cells that are double-positive for the isolation marker and a confirmatory phenotypic marker represents the purity of the sample.
The following workflow diagrams the complete process from cell isolation to final data analysis.
Data Presentation and Interpretation
Expected Purity and Yield Metrics
Validation studies for immunomagnetic separation protocols report a range of purity and viability values. The following table summarizes typical performance metrics for neural and other primary cells based on recent literature and commercial kit specifications.
Table 1: Typical Performance Metrics for Immunomagnetic Cell Separation
| Cell Type | Isolation Marker | Typical Purity | Typical Viability | Key Validation Markers | Citations |
|---|---|---|---|---|---|
| Microglia | CD11b (ITGAM) | >95% | >80% | TMEM119, IBA-1, P2RY12 | [6] |
| Astrocytes | ACSA-2 | >90% | >80% | GFAP, S100B, AQP4 | [6] |
| Neurons | Negative Selection | >85% | Variable | MAP-2, NeuN, β-III-Tubulin | [6] |
| CD3+ T Cells | CD3 | 85-99% | >80% | CD4, CD8, TCR | [63] |
| CD19+ B Cells | CD19 | 85-95% | >75% | CD20, CD79a | [63] |
Analyzing and Presenting Flow Cytometry Data
After applying the gating strategy, the final step is to interpret the plots to determine purity and phenotype. The scatter plot below illustrates how to identify pure and contaminated populations.
Essential Research Reagent Solutions
The following table details key reagents and materials required for the successful immunomagnetic separation and subsequent flow cytometry validation of neural cells.
Table 2: Essential Reagents for Isolation and Validation
| Item | Function/Description | Example Application |
|---|---|---|
| Immunomagnetic Beads | Antibody-conjugated magnetic nanoparticles for target cell binding and separation. | Positive selection of CD11b+ microglia or ACSA-2+ astrocytes [6] [13]. |
| Cell Separation Columns/Magnets | Hardware to generate a magnetic field for retaining bead-bound cells. | Column-based (e.g., MACS) or column-free (e.g., EasySep) systems [13]. |
| Tissue Dissociation Enzymes | Proteases (e.g., trypsin, papain) for digesting extracellular matrix to create single-cell suspensions. | Enzymatic digestion of brain tissue prior to immunomagnetic separation [6]. |
| Fluorochrome-Conjugated Antibodies | Antibodies tagged with fluorescent dyes for detecting cell surface and intracellular markers. | Validation of purity (anti-CD11b) and phenotype (anti-TMEM119, anti-GFAP) via flow cytometry [6] [64]. |
| Viability Staining Dye | A dye (e.g., 7-AAD, DAPI) that is excluded by live cells, allowing their discrimination. | Distinguishing live from dead cells during flow cytometry analysis to ensure accuracy [47] [63]. |
| Flow Cytometry Buffer | Protein-supplemented buffer (e.g., PBS with 2% FBS) to reduce non-specific antibody binding. | Used for diluting antibodies and washing cells during staining protocol. |
Troubleshooting and Technical Notes
- Low Purity: If the validated purity is lower than expected, consider optimizing the tissue dissociation protocol to reduce cell clumping, titrating the immunomagnetic bead-to-cell ratio, or incorporating an additional negative selection step to deplete common contaminants [6] [13].
- Low Viability: Poor cell viability can result from prolonged enzymatic digestion or stressful mechanical dissociation. Using a gentle dissociation protocol and ensuring the use of fresh, appropriate culture medium immediately after isolation can improve viability [6] [63].
- High Background in Flow: This can be caused by inadequate washing, insufficient Fc receptor blocking, or antibody over-titration. Ensure thorough washing steps and proper antibody titration are performed.
- Phenotypic Drift: Be aware that primary neural cells, especially microglia, can undergo rapid phenotypic changes in culture [6]. It is recommended to perform flow cytometry validation as soon as possible after isolation (e.g., within 24 hours) to obtain an accurate snapshot of the initial population.
Within the context of a broader thesis on immunomagnetic separation for purifying specific neural cell types, this application note addresses the critical challenge of preserving ion channel functionality throughout the isolation process. Ion channels are transmembrane proteins that establish and regulate the electrical potential across cell membranes by facilitating the passive, selective diffusion of specific inorganic ions down their electrochemical gradients [66]. Their proper function is a key indicator of cellular health and viability post-isolation.
Immunomagnetic separation has emerged as a rapid and efficient method for isolating highly purified populations of specific neural cell types, such as glial cells and 0-2A progenitor cells from the central nervous system, achieving purity levels exceeding 99% [67]. The core principle involves targeting cells with antibodies specific to surface antigens, which are then cross-linked to magnetic beads. The labeled cells are separated from a heterogeneous population using a magnetic field [13]. This technique can be completed within hours, producing cells with high viability suitable for downstream functional assays [67]. The success of such downstream analyses—particularly the evaluation of ion channel properties—hinges on the isolation protocol's ability to maintain the structural integrity and physiological responsiveness of these delicate proteins.
Key Ion Channel Properties and Functional States
Ion channels are characterized by two fundamental properties: ion selectivity, which allows them to discriminate between different ion species like Na⁺, K⁺, Ca²⁺, or Cl⁻, and gating, which refers to their ability to fluctuate between open and closed states in response to specific stimuli [66]. The activation and inactivation of these channels are central to their function in generating and propagating electrical signals in neurons and other excitable cells [68].
Voltage-Gated Ion Channel States
Voltage-gated ion channels, which respond to changes in the membrane potential, can exist in three primary conformational states, as detailed in Table 1 [68].
Table 1: Functional States of Voltage-Gated Ion Channels
| State | Activation Gate | Inactivation Gate | Ion Permeability | Physiological Role |
|---|---|---|---|---|
| Resting/Deactivated | Closed | Open | Impermeable | The channel is closed but available to open in response to a threshold stimulus. |
| Open/Activated | Open | Open | Permeable | The channel allows ions to flow through, enabling rapid changes in membrane potential. |
| Inactivated | Open | Closed | Impermeable | A refractory state that prevents further activation, crucial for action potential termination and unidirectional propagation. |
The transition between these states is tightly regulated. For example, voltage-gated sodium (Naᵥ) channels open rapidly upon membrane depolarization, allowing Na⁺ influx that drives the rising phase of the action potential. This is followed by a delayed closure of their inactivation gate, which halts Na⁺ entry [68]. Recent structural studies on human Kᵥ4.2 channels reveal that closed-state inactivation can involve an unprecedented symmetry breakdown, where only two of the four S4-S5 linkers move to seal the pore [69].
Experimental Protocol: Isolation and Functional Validation
This section provides a detailed methodology for the immunomagnetic separation of neural cells and the subsequent evaluation of their ion channel function.
Immunomagnetic Separation of Glial Cells
The following protocol is adapted from Wright et al. (1997) and incorporates modern column-free magnetic separation techniques [67] [13].
- Step 1: Tissue Dissociation. Dissociate fresh central nervous system (CNS) tissue (e.g., from rat brain) enzymatically to create a single-cell suspension.
- Step 2: Immunological Labeling. Incubate the cell suspension with a primary antibody specific to a surface antigen on the target cell. For A2B5-positive 0-2A progenitor cells or RAN-2-positive astrocytes, use the respective monoclonal antibodies [67].
- Step 3: Magnetic Bead Coupling. Add magnetic beads (e.g., EasySep) pre-coated with a secondary antibody specific to the primary antibody. Incubate to allow for immunological coupling between the target cells and the magnetic beads [67] [13].
- Step 4: Column-Free Magnetic Separation. Transfer the cell suspension to a tube and place it within a magnetic field. For positive selection, the magnetically labeled target cells will migrate and be immobilized against the tube wall. Carefully pipette off the supernatant containing unlabeled cells. Remove the tube from the magnet and resuspend the bound target cells in an appropriate physiological buffer [13].
- Step 5: Viability and Purity Check. Assess cell viability using Trypan Blue exclusion or similar methods. Determine purity by culturing a sample of the isolated cells and examining their morphology and antigenic expression via immunocytochemistry [67].
Functional Evaluation of Ion Channels
Following isolation, the functional integrity of ion channels can be assessed using several key assays. The required reagents and tools for these evaluations are summarized in Table 2.
Table 2: Research Reagent Solutions for Ion Channel Functional Assays
| Reagent/Tool | Function/Application |
|---|---|
| Patch Clamp Electrophysiology Rig | The gold-standard technique for directly measuring ionic currents through single ion channels or the whole cell. |
| Voltage-Clamp Protocols | Used to hold the membrane potential at a fixed value and measure the resulting ionic currents, ideal for studying voltage-gated channels. |
| Current-Clamp Protocols | Allows the membrane potential to change freely, used to record action potentials and synaptic potentials. |
| Specific Pharmacological Agonists/Antagonists | Chemical tools to activate or block specific ion channel types (e.g., Tetrodotoxin for Naᵥ channels, Tetraethylammonium for Kᵥ channels) to confirm identity and function. |
| Fluorescent Ion Indicators | Dyes (e.g., Fura-2 for Ca²⁺) used in fluorescence-based assays to monitor changes in intracellular ion concentration as a proxy for channel activity. |
Assay 1: Whole-Cell Patch-Clamp Recording of Voltage-Gated Channels.
- Transfer the isolated cells to a recording chamber perfused with an extracellular solution.
- Establish a whole-cell configuration using a fire-polished glass micropipette filled with an intracellular-like solution.
- To characterize Naᵥ channels, hold the cell at -70 mV and apply a series of 10-mV step depolarizations from -80 mV to +30 mV. The resulting inward currents represent Naᵥ channel activation.
- To characterize Kᵥ channels, hold the cell at -30 mV after a depolarizing step to inactivate Naᵥ channels. Apply steps to more positive potentials; the resulting outward currents represent Kᵥ channel activation [68].
- Analyze the current-voltage (I-V) relationship and the kinetics of activation and inactivation.
Assay 2: Assessment of Resting Membrane Potential.
- Use the current-clamp mode of the patch-clamp amplifier without injecting current.
- The stable voltage recorded immediately after achieving whole-cell access is the resting membrane potential. In neurons and glia, this potential is dominated by K⁺ leak channels, and a value near -70 mV indicates healthy, intact membrane properties [66] [68].
Assay 3: Calcium Imaging for Ligand-Gated and Voltage-Gated Ca²⁺ Channels.
- Load isolated cells with a cell-permeable Ca²⁺-sensitive fluorescent dye (e.g., Fluo-4 AM).
- Stimulate the cells either by depolarizing the medium (high K⁺) to activate voltage-gated Caᵥ channels or by applying a specific neurotransmitter (e.g., glutamate) to activate ligand-gated channels.
- Monitor changes in fluorescence intensity using a fluorescence microscope or plate reader. A rapid increase in intracellular Ca²⁺ confirms the functional presence of Ca²⁺-permeable channels [68] [70].
Data Interpretation and Analysis
Successful preservation of ion channel function is demonstrated by data that aligns with established biophysical principles. The table below summarizes the key parameters for different channel types.
Table 3: Expected Functional Properties of Major Neuronal Ion Channels
| Ion Channel Type | Primary Function | Typical Activation Threshold | Ion Flow Direction | Key Functional Signature |
|---|---|---|---|---|
| Voltage-Gated Na⁺ (Naᵥ) | Action Potential Rising Phase | -55 mV (Threshold Potential) [68] | Influx (Into Cytosol) | Rapid, transient inward current. |
| Voltage-Gated K⁺ (Kᵥ) | Action Potential Repolarization | Around +30 mV (Delayed) [68] | Efflux (Out of Cytosol) | Slow, sustained outward current. |
| Voltage-Gated Ca²⁺ (Caᵥ) | Neurotransmitter Release | Around +30 mV [68] | Influx (Into Cytosol) | Slow, sustained inward current. |
| K⁺ Leak Channels | Maintain Resting Potential | Always active at rest [66] | Efflux (Out of Cytosol) | Background conductance stabilizing membrane near K⁺ equilibrium potential. |
- Interpretation of Patch-Clamp Data: Well-preserved Naᵥ channels will show a clear threshold for activation around -55 mV, with rapid activation and complete inactivation within a few milliseconds. A shift in the voltage dependence of activation or a failure to inactivate fully suggests channel damage or improper modulation.
- Validation of Cell Type: The ion channel "fingerprint" can serve as a secondary validation of the target cell type. For instance, the successful isolation of cerebellar Purkinje cells can be corroborated by the presence of specific Kᵥ channel subtypes (e.g., Kv1.1), mutations in which cause episodic ataxia [68].
Workflow Visualization
The following diagram illustrates the integrated workflow from cell isolation to functional validation, highlighting the critical checkpoints for ensuring ion channel integrity.
Diagram 1: Integrated workflow for cell isolation and functional validation, with key quality control checkpoints.
The purification of specific neural cell types is a cornerstone of neuroscience research, enabling the study of cellular behavior, signaling pathways, and disease mechanisms in a controlled environment. The choice of cell isolation technology is critical, as it directly impacts the yield, purity, and functional state of the isolated cells, thereby influencing all downstream experimental results. Among the available techniques, Immunomagnetic Separation and Fluorescence-Activated Cell Sorting (FACS) have emerged as two of the most prominent methods. This Application Note provides a direct comparison of these two technologies, framing the analysis within the context of purifying neural cells—such as neurons, astrocytes, and microglia—for research and drug development. We summarize key performance data, provide detailed protocols for cell isolation, and outline essential reagent solutions to guide researchers in selecting the optimal method for their specific experimental needs.
Immunomagnetic Separation (IMS) and FACS operate on fundamentally different principles. IMS uses antibodies conjugated to magnetic beads to target cell surface antigens, allowing for the selection or depletion of specific cell populations when exposed to a magnetic field [13]. FACS, conversely, uses a laser-based system to detect fluorescently-labeled cells and sorts them into collection vessels based on their light-scattering and fluorescent characteristics [13].
The table below summarizes the head-to-head characteristics of the two methods, with a focus on parameters critical for neural cell research.
Table 1: Direct Comparison of Immunomagnetic Separation and FACS
| Parameter | Immunomagnetic Separation | Fluorescence-Activated Cell Sorting (FACS) |
|---|---|---|
| Speed | Fast and simple; typical protocols take less than 2 hours [13]. | Slower; complex setup and lower throughput extend sorting time [13]. |
| Ease of Use | Simple; minimal specialized training required; can be automated [13]. | Complex; requires significant technical expertise to operate and maintain [13]. |
| Cost | Lower initial instrument cost and per-experiment cost [13]. | High capital investment and substantial maintenance costs [13]. |
| Purity | High purity for common cell types, sufficient for many applications [13]. | Very high purity; capable of single-cell precision and complex gating [13]. |
| Viability | Maintains high cell viability; gentle process [71]. | Can subject cells to shear stress, potentially affecting viability. |
| Multiparameter Sorting | Limited; typically isolates cells based on one or two surface markers. | Excellent; can simultaneously sort based on multiple surface and intracellular markers [13]. |
| Cell Yield | High recovery rates, advantageous for rare cell types [71]. | Lower recovery due to stringent gating and sort decisions. |
| Downstream Applications | Ideal for bulk analysis, RNA sequencing, and functional assays post-enrichment [6]. | Ideal for single-cell analysis, cloning, and studies requiring precisely defined subpopulations [13]. |
| Best For | Rapid isolation, high yield, routine purification, pre-enrichment before FACS [13]. | Complex isolation schemes, single-cell sorting, analysis of intracellular markers [13]. |
For neural cell isolation, where starting material is often limited and cells can be sensitive, the high yield and gentleness of IMS are significant advantages. A study on primary brain cells confirms that immunomagnetic separation is a standard methodology for extracting highly pure populations of neurons, astrocytes, and microglia from dissociated brain tissue [6].
Experimental Protocols for Neural Cell Isolation
The following protocols are adapted for the sequential isolation of microglia, astrocytes, and neurons from a single sample of rodent brain tissue, a common requirement in neuroscience research [6].
Tandem Immunomagnetic Separation of Microglia, Astrocytes, and Neurons
This protocol utilizes a column-based magnetic separation system for the sequential positive selection of microglia and astrocytes, followed by the negative selection of neurons [6].
Workflow Overview:
Materials:
- Tissue Source: Brain tissue from postnatal day 9 mice [6].
- Dissociation Kit: Neural Tissue Dissociation Kit (e.g., from Miltenyi Biotec).
- Magnetic Separator: A strong magnet for column-based separation (e.g., OctoMACS or QuadroMACS).
- Separation Columns: LS or MS Columns compatible with the separator.
- Magnetic Beads: Anti-CD11b (Microglia), Anti-ACSA-2 (Astrocytes), and Non-Neuronal Cell Biotin-Antibody Cocktail (for neuron isolation) [6].
- Buffers: Phosphate-Buffered Saline (PBS) pH 7.2, supplemented with 0.5% Bovine Serum Albumin (BSA) and 2 mM EDTA.
Step-by-Step Protocol:
- Tissue Dissociation: Dissect the brain region of interest and carefully remove the meninges. Mechanically disrupt the tissue and subject it to enzymatic digestion using papain or trypsin to obtain a single-cell suspension. Pass the suspension through a cell strainer (70 µm) to remove clumps and centrifuge to pellet the cells [6].
- Microglia Isolation:
- Resuspend the cell pellet in cold buffer (80 µL per 10^7 cells).
- Add Anti-CD11b MicroBeads (20 µL per 10^7 cells), mix, and incubate for 15 minutes at 4°C.
- Wash the cells by adding 1-2 mL of buffer and centrifuge. Resuspend in 500 µL of buffer.
- Place a column in the magnetic field and prime it with buffer. Apply the cell suspension to the column.
- Wash the column 3 times with buffer. The CD11b+ microglia are retained in the column.
- Remove the column from the magnet and place it over a collection tube. Pipette buffer onto the column and firmly flush out the magnetically labeled microglia using the plunger [6].
- Astrocyte Isolation:
- Collect the unlabeled cell fraction that passed through the column during microglia isolation.
- Centrifuge this flow-through and resuspend the cell pellet in buffer.
- Add Anti-ACSA-2 MicroBeads and repeat the incubation, washing, and column separation steps as described for microglia. The retained ACSA-2+ cells are the purified astrocytes [6].
- Neuron Isolation (Negative Selection):
- Collect the unlabeled cell fraction from the astrocyte isolation step.
- Centrifuge and resuspend the cell pellet. Add the Biotin-Antibody Cocktail to deplete non-neuronal cells (e.g., remaining microglia and astrocytes).
- Incubate, wash, and apply the cells to a pre-primed column. The purified neurons, which are not labeled by the antibodies, will pass through the column and can be collected in the flow-through [6].
Cell Viability Assessment Protocol: Flow Cytometry vs. Fluorescence Microscopy
After isolation, assessing cell viability and apoptosis is crucial. The following protocol compares two common assessment methods, highlighting their performance differences as demonstrated in a cytotoxicity study [72].
Workflow Overview:
Materials:
- Staining Dyes:
- Equipment: Fluorescence microscope with appropriate filters and a flow cytometer.
Step-by-Step Protocol:
- Cell Staining: Split the isolated cell sample into two aliquots. Stain one aliquot for FM analysis (FDA/PI) and the other for FCM analysis (multiparametric panel), following manufacturer protocols.
- Fluorescence Microscopy Analysis:
- Place a small volume of the stained cell suspension on a hemocytometer and acquire images using a fluorescence microscope.
- Count viable (FDA-positive) and non-viable (PI-positive) cells manually or with image analysis software across several fields of view.
- Calculate the percentage of viable cells. Note that this method is labor-intensive and has low throughput, analyzing only a few hundred cells [72].
- Flow Cytometry Analysis:
- Run the multiparametric-stained sample on the flow cytometer.
- Use forward and side scatter to gate on the cell population of interest.
- Analyze the fluorescent channels to distinguish and quantify subpopulations: viable (Annexin V-/PI-), early apoptotic (Annexin V+/PI-), late apoptotic (Annexin V+/PI+), and necrotic (Annexin V-/PI+) cells.
- The cytometer will automatically provide precise percentages for tens of thousands of cells, offering robust statistical power and the ability to discern different mechanisms of cell death [72].
Performance Insight: A direct comparative study on biomaterial cytotoxicity found a strong correlation between FM and FCM data (r = 0.94). However, FCM demonstrated superior precision, sensitivity, and statistical resolution, particularly under high cytotoxic stress. It was also more effective at distinguishing apoptosis from necrosis, a critical distinction in neurotoxicity studies [72].
The Scientist's Toolkit: Essential Research Reagent Solutions
Successful cell isolation and analysis depend on high-quality, specialized reagents. The table below lists key solutions for implementing the protocols described in this note.
Table 2: Essential Reagents for Neural Cell Isolation and Analysis
| Reagent / Solution | Function / Application | Specific Example / Note |
|---|---|---|
| Anti-CD11b (ITGAM) Magnetic Beads | Positive selection of microglial cells from a mixed neural cell suspension. | Binds to the CD11b surface antigen expressed on microglia and other myeloid cells [6]. |
| Anti-ACSA-2 Magnetic Beads | Positive selection of astrocyte populations. | Targets the Astrocyte Cell Surface Antigen-2 (ACSA-2), a specific marker for astrocytes [6]. |
| Non-Neuronal Cell Biotin-Antibody Cocktail | Negative selection of neurons by depleting contaminating glial cells. | Contains antibodies against common non-neuronal surface markers; untouched neurons are collected [6]. |
| Magnetic Cell Separation Columns | Physical matrix that retains magnetically labeled cells when placed in a magnetic field. | LS Columns are suited for up to 10^9 total cells; MS Columns for up to 10^7 total cells [6]. |
| Cell Separation Buffer (PBS/BSA/EDTA) | Preservation of cell viability and prevention of clumping during the isolation process. | The buffer is critical for maintaining a healthy cell suspension. BSA reduces non-specific binding, and EDTA acts as an anticoagulant [6]. |
| Multiparametric Viability Stains (Annexin V, PI, Hoechst) | Discrimination of viable, apoptotic, and necrotic cell populations via flow cytometry. | Provides a more detailed picture of cell health than simple live/dead stains [72]. |
| Trypsin/Papain-based Dissociation Kits | Enzymatic breakdown of the extracellular matrix in brain tissue to create a single-cell suspension. | Gentle enzymes are required to preserve the viability and surface antigens of sensitive neural cells [6]. |
Discussion and Strategic Guidance for Neural Cell Research
The choice between IMS and FACS is not a matter of one being universally superior, but rather which is best suited to the specific research question and experimental constraints.
For the majority of neural cell purification projects, particularly those requiring high yield and rapid processing for downstream functional assays (e.g., gene expression, metabolomics, or in vitro culture), Immunomagnetic Separation is the recommended starting point. Its speed, simplicity, and high cell recovery make it ideal for isolating the substantial cell numbers needed from often limited brain tissue. The ability to perform sequential isolation of multiple cell types from one sample, as described in the protocol, is a significant advantage for comprehensive studies [6].
However, FACS is the indispensable tool when the experimental design demands maximum resolution of complex cellular subsets. If the research aims to isolate a specific neuronal subtype defined by a combination of rare surface markers, to sort cells based on intracellular protein expression (e.g., transcription factors), or to directly deposit single cells into plates for clonal analysis, then FACS is the only suitable option [13].
A powerful and cost-effective strategy that leverages the strengths of both technologies is pre-enrichment followed by sorting. Researchers can first use IMS to rapidly and crudely enrich a target population (e.g., CD11b+ cells), thereby reducing sample volume and complexity. This enriched sample can then be subjected to FACS for high-precision, multiparameter sorting. This hybrid approach maximizes purity and yield while minimizing the time the sample spends on the sorter, preserving cell viability and freeing up a valuable core facility instrument [13].
Both Immunomagnetic Separation and FACS are powerful, well-established technologies for purifying neural cells. IMS excels in efficiency, yield, and ease of use, making it the workhorse for routine isolation and pre-enrichment. FACS provides unparalleled purity and flexibility for the most complex experimental designs. By understanding their comparative strengths and limitations, and by implementing the detailed protocols and reagent solutions outlined here, researchers can make an informed decision that optimizes the quality of their cellular samples and the robustness of their scientific findings in neuroscience and drug development.
Immunomagnetic separation (IMS) has become a cornerstone technique for purifying specific neural cell types from the complex milieu of the central nervous system. The method leverages antibody-coated magnetic beads to selectively target cells based on surface antigens, resulting in populations of high purity and viability [67] [1]. However, the ultimate value of any cell isolation technique is determined by its compatibility with the downstream analytical and functional assays that drive scientific discovery. For researchers isolating neural cells, key downstream applications often include quantitative PCR (qPCR) for gene expression analysis, Western blotting for protein-level quantification, and a suite of functional assays to probe cellular physiology. This application note systematically evaluates the impact of IMS on these critical downstream applications, providing validated protocols and quantitative data to guide experimental design in neural cell research and drug development. We frame this within the context of a broader thesis on using IMS to purify specific neural cell types, such as astrocytes and 0-2A progenitor cells, for functional genomic and proteomic studies.
The table below summarizes the quantitative performance and key considerations for using immunomagnetically separated cells in various downstream applications, as established in the literature.
Table 1: Compatibility of Immunomagnetic Separation with Downstream Applications
| Downstream Application | Reported Purity / Yield | Key Considerations for IMS-Compatible Processing | Impact on Data Quality |
|---|---|---|---|
| qPCR / Gene Expression | N/A | Bead removal not strictly necessary for RNA extraction [1]; Preamplification enables multi-target analysis from limited samples [73]. | Minimal bias introduced with optimized preamplification; Accurate fold-change measurements maintained [73]. |
| Western Blot / Proteomics | N/A | Bead-bound cells can be lysed directly; Total protein normalization (e.g., TotalStain Q) is superior to single housekeeping proteins [74]. | Prevents artifacts from variable housekeeping protein expression; Increases data reliability [74]. |
| Functional Cellular Assays (e.g., Electrophysiology) | Membrane capacitance and ion channel gating unchanged [75] | Bead presence (bead-bound config.) may not affect function; Bead removal kits (bead-free/config.) available for sensitive assays [75]. | Suitable for biophysical and pharmacological studies; No significant effect on ion channel block kinetics observed [75]. |
| Cell Culture & Expansion | >99% purity and high viability reported [67] | Beads can be designed for enzymatic release (e.g., CELLection Kit) or may be incorporated by cells during culture [76] [1]. | Isolated cells show normal morphology and antigenic expression in culture [67]. |
IMS Workflow and Downstream Application Branching
The following diagram outlines the core immunomagnetic separation workflow and its direct integration paths with major downstream applications. This provides a logical map for planning full experimental pipelines.
Detailed Experimental Protocols
Rapid Immunomagnetic Purification of Glial Cells
This protocol, adapted from Wright et al. (1997), details the initial separation of glial cells, a foundational step for all downstream applications [67].
- Step 1: Tissue Dissociation. Dissociate rat central nervous system (CNS) tissue enzymatically to create a single-cell suspension.
- Step 2: Primary Antibody Incubation. Incubate the cell suspension with a primary antibody specific to the target cell's surface antigen. For example, use A2B5 for 0-2A progenitor cells or RAN-2 for astrocytes.
- Step 3: Immunomagnetic Coupling. Add magnetic beads pre-coated with a secondary antibody specific to the primary antibody. Incubate to allow for immunological coupling between the target cells and the magnetic beads.
- Step 4: Magnetic Separation. Apply the cell-bead mixture to a magnetic field. The magnetically labeled target cells will be immobilized, while unbound cells are removed by washing.
- Step 5: Cell Collection. Upon removal from the magnetic field, the bead-bound target cells can be collected in a suitable buffer. The entire process can be completed within 2 hours, yielding a population of >99% purity and high viability [67].
qPCR Analysis with Preamplification from IMS-Purified Cells
Given the typically limited yield from IMS, this protocol utilizes preamplification to enable robust multi-target qPCR analysis [73].
- Step 1: Nucleic Acid Extraction. Extract total RNA or synthesize cDNA from the IMS-purified cell population. Bead removal is not necessary prior to lysis for nucleic acid extraction [1].
- Step 2: Preamplification Reaction.
- Setup: Prepare a highly multiplexed PCR reaction using a preamplification master mix (e.g., SsoAdvanced PreAmp Supermix) and a panel of primer sets (up to 400 targets) for the genes of interest.
- Cycling: Perform a limited number of PCR cycles (typically 10–14 cycles) to enrich the target sequences without introducing significant bias [73].
- Step 3: qPCR Analysis. Dilute the preamplified product and analyze it using standard qPCR protocols with SYBR Green or probe-based chemistry.
- Step 4: Data Interpretation and Validation.
- Cq Shift: Expect an earlier Cq value in qPCR due to target enrichment. A 14-cycle preamplification will shift Cq values approximately 6 cycles earlier.
- Bias Validation: Compare qPCR results with and without preamplification for a subset of samples. The observed ΔCq should be within ±0.75 of the expected value, indicating minimal amplification bias [73].
Western Blot Analysis with Total Protein Normalization
This protocol emphasizes a superior normalization strategy to account for potential loading variations when working with precious IMS-derived samples [74].
- Step 1: Direct Lysis and Protein Extraction. Lyse the bead-bound or bead-free IMS-purified cells directly in a suitable protein lysis buffer containing protease inhibitors.
- Step 2: Electrophoresis and Transfer. Separate the proteins by SDS-PAGE and transfer them to a membrane using standard protocols.
- Step 3: Total Protein Normalization.
- Stain: Immediately after transfer, stain the membrane with a reversible total protein stain (e.g., Azure TotalStain Q) according to the manufacturer's instructions [74].
- Image and Quantify: Image the membrane to visualize and quantify the total protein in each lane. This serves as a direct measure of protein loading and transfer efficiency.
- Destain: Completely remove the stain as per the protocol to avoid interference with subsequent immunodetection.
- Step 4: Immunoblotting. Proceed with standard blocking, primary antibody, and secondary antibody incubation steps.
- Step 5: Data Analysis. Normalize the signal intensity of your target protein to the total protein signal in each corresponding lane, rather than to a single housekeeping protein, for more reliable and accurate quantification [74].
The Scientist's Toolkit: Essential Reagents for IMS Workflows
The table below lists key reagent solutions used in the experiments cited herein, which are essential for successful integration of IMS with downstream applications.
Table 2: Key Research Reagent Solutions for IMS and Downstream Analysis
| Reagent / Kit Name | Provider Example | Function in Workflow |
|---|---|---|
| Dynabeads | Thermo Fisher Scientific | Superparamagnetic, uniform beads for the isolation of cells, proteins, and nucleic acids. Available in various sizes and surface coatings (e.g., streptavidin, secondary antibodies) [76]. |
| EasySep / RoboSep | STEMCELL Technologies | Column-free magnetic cell isolation technologies for positive or negative selection of cells from various sample sources [13]. |
| REAlease Kit | Miltenyi Biotec | An immunomagnetic separation kit that allows for bead-bound, bead-free, and label-free experimental configurations, ideal for functional assays [75]. |
| SsoAdvanced PreAmp Supermix | Bio-Rad | A preamplification reagent designed to maintain optimal PCR efficiency for up to 400 targets simultaneously from limited cDNA or DNA samples, minimizing bias in qPCR [73]. |
| Azure TotalStain Q | Azure Biosystems | A reversible, ready-to-use total protein stain for Western blot membranes that enables accurate normalization based on total protein load, overcoming the variability of housekeeping proteins [74]. |
| CELLection Pan Mouse IgG Kit | Thermo Fisher Scientific | A magnetic bead kit that uses a cleavable linker, allowing for enzymatic release of isolated cells after positive selection, leaving them bead-free for culture or sensitive assays [76]. |
Conclusion
Immunomagnetic separation stands as a robust, reliable, and versatile technique for the purification of specific neural cell types, proving indispensable for both basic neuroscience and translational drug development. Its key strengths lie in its ability to yield highly pure and viable cells with preserved native phenotypes, its operational simplicity, and its cost-effectiveness compared to more complex technologies like FACS. The method's validation across diverse applications—from isolating microglia for neuroinflammation studies to purifying neural progenitors for regenerative medicine—underscores its fundamental utility. Future directions will likely involve greater automation, the development of novel antibody targets for even more specific neural subpopulations, and an expanded role in personalized medicine through the isolation of patient-specific neural cells for therapy development and screening. By mastering the principles, applications, and optimization strategies outlined in this guide, researchers can fully leverage this powerful technology to accelerate discoveries in brain function and dysfunction.
References
- 1. Immunomagnetic separation [https://en.wikipedia.org/wiki/Immunomagnetic_separation]
- 2. Immunomagnetic Separation - an overview [https://www.sciencedirect.com/topics/agricultural-and-biological-sciences/immunomagnetic-separation]
- 3. Immunomagnetic Separation - an overview [https://www.sciencedirect.com/topics/biochemistry-genetics-and-molecular-biology/immunomagnetic-separation]
- 4. Extracellular vesicles isolation: a focus on magnetic beads ... [https://www.frontiersin.org/journals/bioengineering-and-biotechnology/articles/10.3389/fbioe.2025.1646385/full]
- 5. EasySep™ Magnet for Cell Separation [https://www.stemcell.com/products/easysep-cell-separation-magnet.html]
- 6. Isolation of Primary Brain Cells: Challenges and Solutions [https://pmc.ncbi.nlm.nih.gov/articles/PMC12320896/]
- 7. Positive Vs. Negative Selection | Immunomagnetic Cell Separation [https://www.stemcell.com/cell-separation/positive-vs-negative-selection]
- 8. Designing and troubleshooting immunopanning protocols for... [https://pubmed.ncbi.nlm.nih.gov/25447277/]
- 9. Over 400 different types of nerve cell have been grown [https://ethz.ch/en/news-and-events/eth-news/news/2025/07/over-400-different-types-of-nerve-cell-have-been-grown-far-more-than-ever-before.html]
- 10. Modeling neurodegenerative diseases with brain organoids [https://www.frontiersin.org/journals/cell-and-developmental-biology/articles/10.3389/fcell.2025.1663286/full]
- 11. A purpose-built future: 2025 trends for cell and gene therapy [https://www.team-consulting.com/us/insights/a-purpose-built-future-2025-trends-for-cell-and-gene-therapy/]
- 12. Immunoprecipitation Protocol (Magnetic...) | Cell Signaling Technology [https://www.cellsignal.com/learn-and-support/protocols/protocol-ip-magnetic]
- 13. Magnetic Cell Separation | Cell Isolation Technology [https://www.stemcell.com/cell-separation/magnetic-cell-isolation]
- 14. Purification and characterization of human neural stem and ... [https://www.sciencedirect.com/science/article/pii/S0092867423001605]
- 15. Subcellular proteomics and iPSC modeling uncover ... [https://www.nature.com/articles/s43587-025-00823-3]
- 16. differentiation protocols: how to choose the correct approach... Neural [https://pmc.ncbi.nlm.nih.gov/articles/PMC9838171/]
- 17. Quantitative profiling of human brain organoid cell diversity ... [https://pubmed.ncbi.nlm.nih.gov/40864552/]
- 18. A Concise Review of the Control and Assessment ... [https://pmc.ncbi.nlm.nih.gov/articles/PMC12113384/]
- 19. A Concise Review of the Control and Assessment ... [https://www.mdpi.com/1996-1944/18/10/2264]
- 20. Low-gradient magnetic separation in Biotechnology [https://www.sciencedirect.com/science/article/pii/S1383586625034331]
- 21. Two-Step Positive Selection Method for the Magnetic ... [https://pubmed.ncbi.nlm.nih.gov/40859071/]
- 22. Cell isolation and separation: Essential techniques [https://www.abcam.com/en-us/knowledge-center/cell-biology/cell-isolation-and-separation]
- 23. A Cold-Active Protease Tissue Dissociation Protocol for the ... [https://pubmed.ncbi.nlm.nih.gov/40364987/]
- 24. Human breast cancer patient tissue dissociation for single- ... [https://www.protocols.io/view/human-breast-cancer-patient-tissue-dissociation-fo-g6tmbzek7.html]
- 25. An Optimized Tissue Dissociation Protocol for Single-Cell ... [https://explore.data.humancellatlas.org/projects/849ed38c-5917-43c4-a8f9-0782241cf10c]
- 26. Macrophage phagocytosis of myelin in vitro determined by ... [https://www.sciencedirect.com/science/article/abs/pii/S0165572896001105]
- 27. Efficient isolation of live microglia with preserved phenotypes ... [https://jneuroinflammation.biomedcentral.com/articles/10.1186/1742-2094-9-147]
- 28. How to Prepare a Single-Cell Suspension from Mouse ... [https://www.stemcell.com/how-to-prepare-a-single-cell-suspension-from-mouse-brain-tissue.html]
- 29. Immunomagnetic separation of adult human olfactory ... [https://pubmed.ncbi.nlm.nih.gov/16720518/]
- 30. Regulation of neurotrophin receptor (Trk) signaling [https://pmc.ncbi.nlm.nih.gov/articles/PMC4030161/]
- 31. Sequential expression of Trks A, B, and C in the ... [https://pmc.ncbi.nlm.nih.gov/articles/PMC6578567/]
- 32. Direct NT-3 Activation of TrkB Neurons In Vivo [https://pmc.ncbi.nlm.nih.gov/articles/PMC2711510/]
- 33. Validation of a New High-Throughput Cell Separation ... [https://www.mdpi.com/1422-0067/26/14/6747]
- 34. Selective Modulation of Trk Receptors by Cyclo ... [https://pmc.ncbi.nlm.nih.gov/articles/PMC12333011/]
- 35. Single-Cell Radiotracer Allocation via Immunomagnetic Sorting to Disentangle PET Signals at Cellular Resolution - PubMed [https://pubmed.ncbi.nlm.nih.gov/35589403/]
- 36. Single-Cell Radiotracer Allocation via Immunomagnetic ... [https://pmc.ncbi.nlm.nih.gov/articles/PMC9536696/]
- 37. Regional desynchronization of microglial activity is associated ... [https://molecularneurodegeneration.biomedcentral.com/articles/10.1186/s13024-024-00752-6]
- 38. Deciphering sources of PET signals in the tumor ... [https://pmc.ncbi.nlm.nih.gov/articles/PMC10610915/]
- 39. Isolation of Primary Brain Cells: Challenges and Solutions [https://www.fortunejournals.com/articles/isolation-of-primary-brain-cells-challenges-and-solutions.html]
- 40. Rapid and efficient immunomagnetic isolation of ... [https://www.nature.com/articles/s41598-021-81361-x]
- 41. Labeling, isolation, and characterization of cell type-specific ... [https://pmc.ncbi.nlm.nih.gov/articles/PMC12505222/]
- 42. Viewing the Glioblastoma Tumor Microenvironment at Single Cell Resolution | The Scientist [https://www.the-scientist.com/viewing-the-glioblastoma-tumor-microenvironment-at-single-cell-resolution-71771]
- 43. Neural stem cells isolated from amyloid precursor protein ... [https://pmc.ncbi.nlm.nih.gov/articles/PMC3812526/]
- 44. Methods for isolating neural stem and progenitor cells from the ... [https://techfinder.stanford.edu/technology/methods-isolating-neural-stem-and-progenitor-cells-developing-human-brain]
- 45. The Power of Flow Cytometry in Biomarker-Driven Clinical ... [https://www.precisionformedicine.com/blog/harnessing-flow-cytometry-biomarker-driven-clinical-trials/]
- 46. Cell-Based Screening Using High-Throughput Flow Cytometry [https://pmc.ncbi.nlm.nih.gov/articles/PMC3045571/]
- 47. Immunomagnetic separation is a suitable method for ... [https://pmc.ncbi.nlm.nih.gov/articles/PMC7781520/]
- 48. High-Capacity and High-Purity Antibody Purification Using ... [https://www.promega.com/resources/pubhub/high-capacity-and-high-purity-antibody-purification/]
- 49. Rapid purification of glial cells using immunomagnetic ... [https://www.sciencedirect.com/science/article/abs/pii/S0165027097224003]
- 50. Cell recovery optimization of peripheral blood B- ... [https://www.sciencedirect.com/science/article/abs/pii/S1465324925003664]
- 51. Benchmarking microfluidic and immunomagnetic platforms for ... [https://pubs.rsc.org/en/content/articlehtml/2025/lc/d5lc00512d]
- 52. Mitigating the non-specific uptake of immunomagnetic ... [https://www.nature.com/articles/s42003-021-02732-8]
- 53. Advances in rare cell isolation: an optimization and evaluation ... [https://translational-medicine.biomedcentral.com/articles/10.1186/s12967-016-1108-1]
- 54. Enhanced specificity of immunomagnetic separation of ... [https://www.sciencedirect.com/science/article/abs/pii/S030881462502833X]
- 55. Proposed practical protocol for flow cytometry analysis of ... [https://www.frontiersin.org/journals/cellular-neuroscience/articles/10.3389/fncel.2022.1017976/full]
- 56. Critical factors for flow cytometry analysis of the brain - PMC [https://pmc.ncbi.nlm.nih.gov/articles/PMC12220843/]
- 57. How to Prepare a Single-Cell Suspension from Mouse ... [https://www.stemcell.com/how-to-prepare-a-single-cell-suspension-from-mouse-brain-tissue-protocol.html]
- 58. Dissociation of neonatal and adult mice brain for ... [https://www.sciencedirect.com/science/article/pii/S2451830120300017]
- 59. Magnetic bead cell sorting: Column-based or column-free? [https://www.rwdstco.com/the-difference-between-two-types-of-magnetic-bead-cell-sorting/]
- 60. Magnetic vs. column protein purification [https://www.minipcr.com/magnetic-vs-column-protein-purification-whats-the-difference/]
- 61. EasySep™ Magnetic Cell Separation—The Easy Choice [https://www.stemcell.com/products/brands/easysep-cell-separation.html]
- 62. Video: Isolating Murine Primary Oligodendrocytes Using ... [https://www.jove.com/v/31117/isolating-murine-primary-oligodendrocytes-using-immunomagnetic-beads]
- 63. Validation of a New High-Throughput Cell Separation ... [https://pmc.ncbi.nlm.nih.gov/articles/PMC12295580/]
- 64. A Survey of Flow Cytometry Data Analysis Methods - PMC [https://pmc.ncbi.nlm.nih.gov/articles/PMC2798157/]
- 65. Flow vs. Image Cytometry: Comparing Techniques to ... [https://evidentscientific.com/en/insights/flow-vs-image-cytometry-comparing-techniques-to-evaluate-large-cell-populations]
- 66. Ion Channels and the Electrical Properties of Membranes - NCBI [https://www.ncbi.nlm.nih.gov/books/NBK26910/]
- 67. Rapid purification of glial cells using immunomagnetic ... [https://pubmed.ncbi.nlm.nih.gov/9210573/]
- 68. Voltage-gated ion channels: Structure, types and function [https://www.kenhub.com/en/library/physiology/voltage-gated-ion-channels]
- 69. Activation and closed-state inactivation mechanisms of the ... [https://www.sciencedirect.com/science/article/pii/S1097276522003951]
- 70. Current trends and future opportunities for ion channel ... [https://www.ddw-online.com/the-current-trends-and-future-opportunities-for-ion-channel-drug-discovery-34155-202503/]
- 71. Assessment of Cell Isolation From Human Milk Using ... [https://pmc.ncbi.nlm.nih.gov/articles/PMC11992638/]
- 72. Evaluating cell viability assessment techniques [https://pmc.ncbi.nlm.nih.gov/articles/PMC12492793/]
- 73. Preamplification and Maximizing qPCR Data Generation | Bio-Radiations [https://www.bioradiations.com/preamplification-and-how-it-can-be-used-to-maximize-qpcr-data-generation-from-limited-samples/]
- 74. Verify Transfer & Normalize Western Blots for Reliable Data [https://azurebiosystems.com/blog/the-key-to-consistent-western-blots-totalstain-q-for-reliable-data/]
- 75. Immunomagnetic separation is a suitable method for ... [https://pubmed.ncbi.nlm.nih.gov/33356811/]
- 76. Dynabeads Magnetic Bead Separation Technology [https://www.thermofisher.com/us/en/home/brands/product-brand/dynal.html]