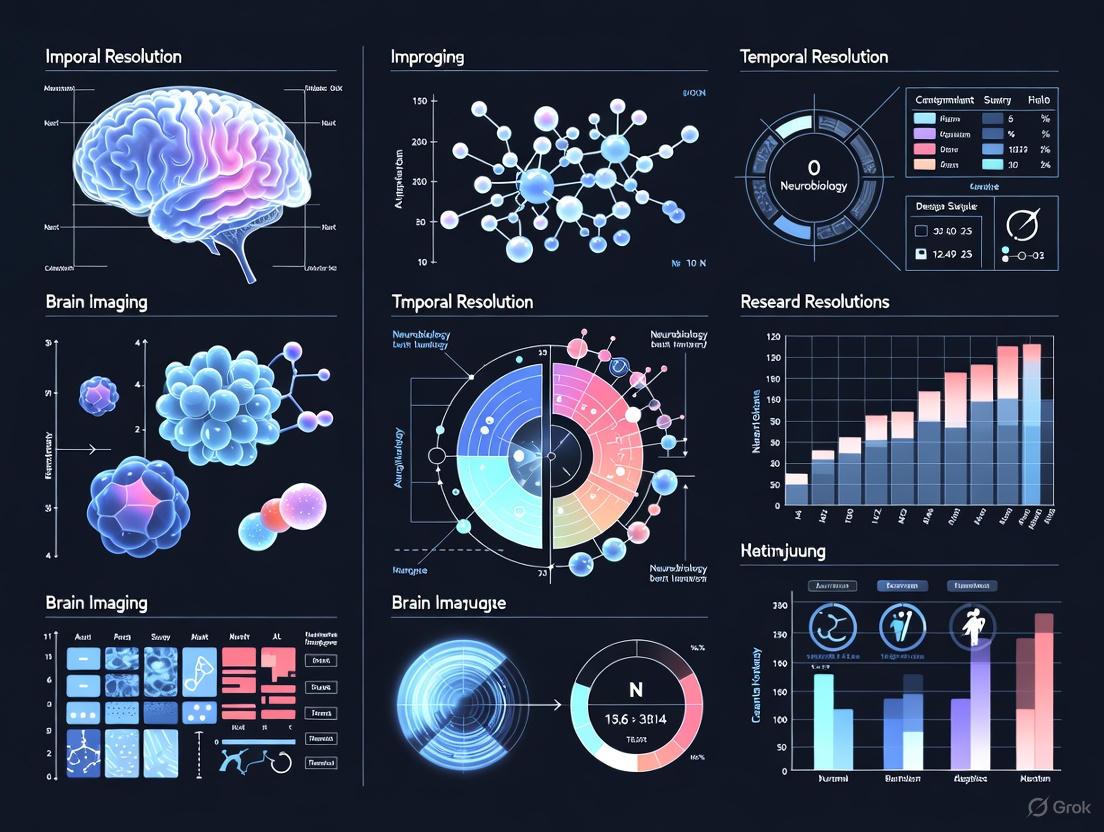
Breaking the Time Barrier: Advanced Methods for Improving Temporal Resolution in Functional Brain Imaging
This article provides a comprehensive overview of the latest technological and methodological advancements aimed at improving temporal resolution in functional brain imaging.
Breaking the Time Barrier: Advanced Methods for Improving Temporal Resolution in Functional Brain Imaging
Abstract
This article provides a comprehensive overview of the latest technological and methodological advancements aimed at improving temporal resolution in functional brain imaging. Tailored for researchers, scientists, and drug development professionals, it explores the fundamental importance of high-speed sampling, details cutting-edge acquisition sequences and analytical models, addresses key challenges in implementation and optimization, and validates performance through comparative analysis and real-world applications in cognitive and clinical neuroscience. The synthesis of current evidence highlights how enhanced temporal resolution is revolutionizing our ability to decode dynamic brain networks and cognitive processes.
Why Time Matters: The Critical Role of Temporal Resolution in Unlocking Dynamic Brain Function
FAQs: Core Principles of Temporal Resolution
What exactly is temporal resolution in fMRI? Temporal resolution refers to the accuracy with which an fMRI scan can measure changes in brain activity over time. It determines how precisely researchers can track the sequence of neural events. In practice, it is limited by the sluggish nature of the hemodynamic response, which is the delay and dispersion of the blood-oxygen-level-dependent (BOLD) signal relative to the underlying neural activity. The BOLD signal typically peaks 5–6 seconds after a neural event, fundamentally constraining the technique's ability to resolve rapid neural processes [1] [2].
How is temporal resolution quantitatively defined in an experiment? Temporal resolution is primarily defined by two key parameters:
- Repetition Time (TR): The time required to acquire one full set of data (volume) for the entire brain. A shorter TR allows for more frequent sampling of the BOLD signal [3].
- Sampling Rate: The inverse of the TR (e.g., a TR of 2 seconds equals a sampling rate of 0.5 Hz). Advanced methods can achieve effective sampling rates much higher than 1/TR [4].
The table below summarizes typical and advanced temporal resolution parameters in fMRI studies.
Table 1: Quantitative Parameters of Temporal Resolution in fMRI
| Parameter | Typical/Conventional Range | Advanced/High-Performance Range | Key Influencing Factors |
|---|---|---|---|
| Repetition Time (TR) | 2 - 3 seconds [3] [5] | 0.5 - 1.5 seconds [6] [4] | Gradient performance, parallel imaging, number of slices |
| BOLD Signal Sampling Rate | 0.33 - 0.5 Hz [5] | Up to ~13.3 Hz (e.g., 75-ms sampling) [4] | Acquisition sequence (e.g., HiHi reshuffling), multiband acceleration |
| Hemynamic Response Peak Delay | 4 - 6 seconds [5] [1] | (A biological constant, but measurement precision improves) | Biological variability, field strength |
| Minimum Resolvable Interval | ~2 - 3 seconds [7] | Sub-seconds [8] | Signal-to-noise ratio, hemodynamic blurring |
What is the fundamental difference between the temporal resolution of the BOLD signal and the image acquisition rate? It is critical to distinguish between the acquisition rate (governed by TR) and the biological temporal resolution (governed by the hemodynamic response function). Even with a very fast TR, the BOLD signal itself is a temporally smoothed and delayed representation of neural activity. Think of an fMRI time-course as a "long exposure photograph" rather than a high-speed snapshot of brain activity [2]. Therefore, the effective temporal resolution is a combination of how fast you can sample (TR) and the inherent blurring of the neurovascular coupling.
Troubleshooting Guides
Problem 1: Poor Signal-to-Noise Ratio (SNR) at Short TR
Problem: Attempts to increase temporal resolution by shortening the TR result in a poor functional contrast-to-noise ratio (fCNR), making it difficult to detect the BOLD signal.
Background: Shortening the TR often reduces the signal-to-noise ratio (SNR) because longitudinal magnetization (T1 relaxation) does not have sufficient time to recover fully between excitations [4]. The fCNR is formally defined as: fCNR = (ΔS/S) * tSNR, where ΔS/S is the fractional BOLD signal change and tSNR is the temporal SNR [9].
Solution Checklist:
- Increase Magnetic Field Strength: Move to ultra-high fields (7T or above). The BOLD contrast (ΔS/S) increases supra-linearly with field strength, boosting fCNR even at short TRs [9].
- Use High-Performance Gradients: Employ scanners with high-performance gradient coils (high slew rates and strength) to minimize echo time (TE) and acquisition time, preserving SNR [9].
- Optimize RF Coils: Use multi-channel array coils or cryogenic coils. Cryogenically cooled radiofrequency (RF) coils can reduce electronic noise, with studies reporting SNR gains of ~3 and tSNR improvements of ~1.8 [9].
- Apply Multiband Acceleration: Use simultaneous multi-slice (multiband) imaging to achieve a shorter TR for whole-brain coverage without the proportional SNR penalty associated with simply reducing TR [4].
- Consider Advanced Sequences: Explore data reordering methods like HiHi reshuffling, which can achieve a high temporal sampling rate decoupled from the TR, thereby preserving SNR [4].
Problem 2: Inability to Resolve Fast Neural Dynamics
Problem: The experimental design requires tracking brain dynamics that unfold over hundreds of milliseconds, but the hemodynamic response appears too sluggish.
Background: The canonical hemodynamic response peaks 5-6 seconds post-stimulus, blurring rapid neural sequences [1]. However, recent evidence shows that the BOLD signal contains higher-frequency information than previously assumed [8].
Solution Checklist:
- Employ Ultra-Fast fMRI: Implement highly accelerated acquisition protocols to achieve sub-second whole-brain TRs (e.g., 500 ms or less). This allows for better sampling of the hemodynamic response's finer temporal features [6] [8].
- Update Hemodynamic Response Models: Move beyond the canonical gamma model. Use temporal derivatives or more flexible models during analysis to capture variability in latency and shape, which is better revealed by fast sampling [8] [1].
- Use Event-Related Designs: Opt for jittered event-related designs over block designs. The random timing of brief events helps to sample the hemodynamic response at higher density and reduces anticipatory effects, improving the estimation of timing and amplitude [3].
- Leverage Spatial Information: Analyze signals from multiple distinct brain areas simultaneously. Time courses can be distinguished even with small differences in delay (as little as 2 seconds) when compared against each other, providing a way to study serial processing [7].
Problem 3: Confounding Physiological Noise and Artifacts
Problem: At high temporal resolutions, the data becomes increasingly contaminated by non-neural physiological noise (e.g., from cardiac and respiratory cycles), leading to spurious results.
Background: As spatial voxel size decreases and temporal sampling increases, the relative contribution of physiological noise to the total signal increases [8] [9]. In resting-state fMRI, standard preprocessing filters can artificially inflate correlation estimates and increase false-positive rates [10].
Solution Checklist:
- Implement Physiological Monitoring and Modeling: Record cardiac and respiratory cycles during the scan. Use these recordings as nuisance regressors in a general linear model (GLM) to remove these artifacts from the BOLD time series [3] [1].
- Apply Data-Driven Denoising: Use tools like Independent Component Analysis (ICA) to identify and remove noise components related to physiology and head motion [3] [1].
- Carefully Design Filtering Pipelines: Be cautious with band-pass filtering in resting-state analyses. Ensure the sampling rate is aligned with the analyzed frequency band to avoid distorting correlation coefficients [10].
- Validate with Surrogate Data: Use surrogate data methods to test and account for the statistical properties of rsfMRI signals, which helps control for autocorrelation-driven false positives [10].
The Scientist's Toolkit
Table 2: Essential Research Reagent Solutions for High-Temporal Resolution fMRI
| Item Category | Specific Examples & Specifications | Primary Function in Experiment |
|---|---|---|
| High-Performance Scanner Hardware | Ultra-high field systems (7T, 9.4T, 11.7T); Gradient systems (400-1000 mT/m, slew rates >1000 T/m/s) [9] | Increases fundamental BOLD contrast (ΔS/S) and enables rapid image encoding for short TRs. |
| Advanced RF Coils | Multi-channel phased arrays; Cryogenically cooled coils; Implantable figure-8 coils (up to 500% SNR increase) [9] | Enhances signal-to-noise ratio (SNR) and temporal SNR (tSNR), crucial for detecting weak, fast signals. |
| Accelerated Acquisition Sequences | Multiband (SMS) EPI; Echo-Planar Imaging (EPI) variants; HiHi reshuffling techniques [8] [4] | Enables sub-second whole-brain coverage or very high temporal sampling rates without severe SNR loss. |
| Physiological Monitoring Equipment | Peripheral pulse oximeter; Respiratory belt; Eye-tracker [9] | Provides data for modeling and removing cardiac, respiratory, and motion-related noise from the BOLD signal. |
| Specialized Analysis Software | FSL, SPM, AFNI; Custom scripts for advanced HRF modeling (e.g., with temporal/dispersion derivatives) [8] [1] | Allows for flexible statistical modeling, denoising, and accurate characterization of the hemodynamic response. |
Visualizing Key Concepts and Workflows
Diagram 1: Neural activity triggers a delayed hemodynamic response, which is then sampled by the MRI scanner. This cascade fundamentally limits fMRI's temporal resolution.
Diagram 2: A workflow for planning and executing an fMRI study where high temporal resolution is a primary objective, highlighting the necessary hardware, acquisition, and design considerations.
Welcome to the Technical Support Center
This resource is designed for researchers navigating the core challenges in functional brain imaging. The following guides and FAQs address common experimental issues, with a focus on methodologies that push the boundaries of temporal and spatial resolution.
Frequently Asked Questions (FAQs)
FAQ 1: What is the fundamental trade-off we face in functional neuroimaging? Current non-invasive neuroimaging techniques inherently trade off between spatial resolution and temporal resolution [11]. No single method can currently capture brain activity with both very high spatial (millimeter) and temporal (millisecond) precision, forcing researchers to choose a protocol based on their specific scientific question [12].
FAQ 2: How can I achieve high spatial resolution for studying small brain structures at 3T? Standard GE-EPI fMRI at 3T often has insufficient signal-to-noise ratio (tSNR) for sub-millimeter resolution and suffers from signal dropout in critical regions like the amygdala. Using a spin-echo based technique like generalized Slice Dithered Enhanced Resolution (gSLIDER) can enable ~1 mm³ resolution at 3T. It reduces large vein bias and susceptibility artifacts while more than doubling the tSNR compared to traditional spin-echo EPI [13].
FAQ 3: The high spatial resolution from gSLIDER comes with a very long TR (~18 s). How can I improve the temporal resolution for my paradigm? The inherently low temporal resolution of gSLIDER can be addressed with a novel reconstruction method called Sliding Window Accelerated Temporal resolution (SWAT). This method provides up to a five-fold increase in effective temporal resolution (TR ~3.5 s), making it compatible with a wider range of fMRI experimental designs without sacrificing spatial detail [13].
FAQ 4: Is it possible to combine the strengths of different imaging modalities to overcome this trade-off? Yes, one promising approach is to develop multi-modal encoding models. For instance, a transformer-based model can be trained using both MEG (high temporal resolution) and fMRI (high spatial resolution) data collected from subjects exposed to the same naturalistic stimuli. This model can then estimate latent cortical source responses that possess high fidelity in both spatial and temporal dimensions [11].
Troubleshooting Guides
Problem: Inaccurate tractography results due to poor protocol selection.
Issue: Diffusion tractography results are highly sensitive to acquisition parameters. Spending all your scan time on maximizing either spatial resolution or diffusion sampling (q-space) at the expense of the other can lead to anatomically inaccurate or inconsistent results [14].
Solution:
- Root Cause: Focusing on one domain (spatial or diffusion sampling) while neglecting the other is counterproductive. Complex fiber geometries (e.g., crossing, kissing) require a balanced approach [14].
- Actionable Steps:
- Do not maximize one parameter at the extreme cost of the other. A balanced protocol yields the most anatomically accurate results [14].
- Pilot different time-matched protocols. If total scan time is fixed, test different configurations that trade spatial resolution for diffusion directions/b-values, or vice-versa, to find the optimal balance for your specific tracking goals [14].
Problem: Signal dropout and distortions in limbic and frontal regions.
Issue: Standard Gradient-Echo (GE) EPI sequences are prone to susceptibility-induced signal dropout and geometric distortions, especially in regions near air-tissue interfaces like the orbitofrontal cortex and amygdala. This can preclude studying critical structures involved in emotion and reward [13].
Solution:
- Root Cause: Magnetic field inhomogeneities in these areas cause rapid dephasing of the GE signal [13].
- Actionable Steps:
- Switch to a spin-echo (SE) based sequence. Sequences like gSLIDER use spin-echoes, which are less susceptible to these static magnetic field inhomogeneities, thereby recovering signal in dropout-prone regions [13].
- Validate your sequence. Use a classic localizer task (e.g., a visual checkerboard) to confirm that the SE-based sequence with enhanced resolution (e.g., gSLIDER-SWAT) produces robust and expected activation patterns [13].
Experimental Protocols & Data
The table below summarizes key methodologies from recent studies that have successfully addressed the temporal-spatial trade-off.
| Technique / Model | Core Methodology | Key Outcome Metrics | Reported Performance |
|---|---|---|---|
| gSLIDER-SWAT fMRI [13] | Spin-echo acquisition with multiple thin-slab RF encodings and a sliding-window reconstruction. | Temporal Resolution (TR), Spatial Resolution, tSNR | TR: ~3.5 s (from ~18 s), Resolution: 1 mm³ isotropic, tSNR: ~2x gain over SE-EPI |
| Naturalistic MEG-fMRI Encoding Model [11] | Transformer-based model trained on MEG and fMRI data from narrative story listening to estimate latent cortical sources. | Spatial & Temporal Fidelity, Generalizability | Predicts MEG better than single-modality models; source estimates show higher spatiotemporal fidelity than minimum-norm solutions. |
| Balanced Diffusion Tractography [14] | Systematic comparison of six time-matched acquisition protocols with varying balance between spatial and angular resolution. | Anatomic Accuracy | A balanced consideration of spatial and diffusion sampling produces the most anatomically accurate and consistent tractography results. |
Detailed Protocol: gSLIDER-SWAT for High Resolution fMRI at 3T
This protocol enables whole-brain fMRI at 1 mm³ resolution with a practical TR [13].
- Equipment: 3T MRI scanner (e.g., Siemens Prisma or Skyra), 32-channel or 64-channel head coil.
- Sequence Parameters:
- Pulse Sequence: Spin-echo based gSLIDER.
- Field of View (FOV): 220 × 220 × 130 mm³.
- Spatial Resolution: 1 × 1 × 1 mm³ (isotropic).
- gSLIDER Factor: 5 (26 thin-slabs, 5 mm thick, each acquired 5x with different slice phase encoding).
- Echo Time (TE): 69 ms.
- Repetition Time (TR): 18 s (for the entire gSLIDER block, effective TR of 3.6 s per dithered volume after SWAT).
- Parallel Imaging: GRAPPA factor 3.
- SWAT Reconstruction: Employ the custom Sliding Window Accelerated Temporal resolution reconstruction to leverage temporal information within individual gSLIDER radio-frequency encodings, achieving an effective five-fold increase in temporal resolution.
- Validation: Run a classic block-design visual checkerboard paradigm at the Nyquist frequency of the sequence to confirm robust activation in the primary visual cortex.
The Scientist's Toolkit
| Research Reagent / Material | Function in the Experiment |
|---|---|
| 64-channel Head/Neck Coil | High-density radio-frequency receive array for improved signal-to-noise ratio and accelerated imaging [13]. |
| Spin-Echo gSLIDER Pulse Sequence | Specialized MRI sequence that uses slice-dithering to achieve sub-millimeter spatial resolution while reducing susceptibility artifacts [13]. |
| Naturalistic Stimuli (Narrative Stories) | Ecologically valid auditory stimuli used to engage complex brain networks during MEG and fMRI sessions for multi-modal model training [11]. |
| Transformer-Based Encoding Model | A machine learning architecture that integrates MEG and fMRI data to estimate brain activity with high spatiotemporal resolution [11]. |
Visualizing Solutions to the Trade-Off
The following diagram illustrates the core problem and the two primary technological solutions detailed in this guide.
The quest to overcome the inherent "hemodynamic lag" of traditional fMRI, where the blood-oxygen-level-dependent (BOLD) signal lards behind neural activity by seconds, is a central challenge in modern neuroscience. This temporal blurring obscures the rapid, millisecond-scale dynamics that underpin cognition, perception, and neural communication. For researchers and drug development professionals, bridging this gap is critical for de-risking clinical trials and understanding the precise mechanisms of novel therapeutics. This technical support center provides a foundational guide to methodologies and troubleshooting for experiments designed to capture neural dynamics at their true temporal scale.
Troubleshooting Guides
Guide 1: Resolving MEG Signal Quality Issues
Problem: Poor signal-to-noise ratio in Magnetoencephalography (MEG) data, obscuring subtle neural oscillatory patterns.
Symptoms:
- Inability to decode cognitive states (e.g., visual object categories) using machine learning algorithms.
- Weak or unidentifiable event-related fields.
- Excessive noise in source-localized data.
Potential Causes and Solutions:
| Potential Cause | Diagnostic Steps | Solution |
|---|---|---|
| Environmental Magnetic Noise | Check for unshielded equipment in the scanner room. Use empty-room recordings to quantify noise. | Ensure the magnetic shield is properly sealed. Activate the magnetically shielded room's active compensation system. |
| Poor Sensor Contact | Visually inspect the positioning between the participant's head and the helmet. | Reposition the participant to minimize the head-to-sensor distance. Use padding for secure and comfortable positioning. |
| Subject Motion | Plot head position data throughout the recording. | Use head-position indicator coils and correct for motion during preprocessing. Instruct the participant to minimize movement. |
| Biomagnetic Contaminants | Screen participants for dental work, implants, or recent consumption of magnetic particles. | Implement a rigorous participant screening questionnaire. Provide non-magnetic clothing for the session. |
Guide 2: Addressing Temporal Modeling Errors in fMRI
Problem: Standard General Linear Model (GLM) fails to predict fMRI responses to very brief or very long visual stimuli, leading to inaccurate characterization of high-level visual cortex temporal processing [15].
Symptoms:
- Stronger-than-expected BOLD responses to brief stimuli.
- Suppressed responses to long-duration stimuli due to adaptation.
- Inability to differentiate sustained from transient neural channels.
Solution: Implement an encoding model with separate sustained and transient temporal channels at millisecond resolution, rather than a standard GLM [15].
- Model Neural Responses: First, model the millisecond-precision neural responses to the stimulus, including nonlinearities like adaptation.
- Predict BOLD: Use the convolved neural response to predict the slower fMRI signal.
- Validate Model: Test the model's ability to predict fMRI data across a range of stimulus durations (e.g., 33 ms to 20 s).
Frequently Asked Questions (FAQs)
FAQ 1: What are the primary neuroimaging methods for achieving millisecond temporal resolution, and how do they compare?
The table below summarizes key techniques that bypass the hemodynamic lag.
| Method | Temporal Resolution | Spatial Resolution | Key Principle | Primary Use Cases |
|---|---|---|---|---|
| MEG [16] | ~1-10 ms | ~5-20 mm | Measures magnetic fields generated by neuronal electrical currents. | Tracking rapid cortical dynamics, brain rhythms, and functional connectivity. |
| EEG/ERP [17] | ~1 ms | ~10-20 mm | Measures electrical potentials on the scalp from synchronized neuronal firing. | Studying event-related potentials, cognitive processes, and sleep stages. |
| Ultrafast Optical Imaging [18] | <1 ms (kHz imaging) | Sub-cellular to micron-level | Uses voltage-sensitive dyes or genetically encoded indicators to directly image membrane potential changes. | Preclinical study of fast-spiking interneurons and cellular dynamics in animal models. |
| Electrocorticography (ECoG) | ~1-10 ms | ~1 cm (direct cortical surface) | Records electrical activity directly from the cerebral cortex. | Surgical planning for epilepsy, mapping of functional areas. |
FAQ 2: How can we integrate high temporal resolution techniques into pharmacodynamic studies for drug development?
Functional neuroimaging like EEG and fMRI can be used in Phase 1 trials to answer critical de-risking questions [17]:
- Brain Penetration: Does the drug affect clinically relevant brain systems?
- Functional Target Engagement: What is the impact on brain function (e.g., on cognition-related EEG signals)?
- Dose Selection: What is the dose-response relationship on brain function?
- Indication Selection: How do the brain effects inform the choice of clinical indication?
FAQ 3: Our lab has only an fMRI scanner. Can we still improve the temporal precision of our studies?
Yes. While fMRI is inherently limited by the hemodynamic response, you can employ advanced modeling approaches to infer millisecond-precision dynamics. One powerful method is MEG-fMRI fusion [16]. This computational approach combines the high spatial resolution of fMRI with the high temporal resolution of MEG by linking the similarity patterns of brain responses between the two modalities, offering a non-invasive view of brain activity with millisecond-millimeter accuracy.
Experimental Protocols
Protocol 1: Mapping Sustained and Transient Channels in High-Level Visual Cortex with fMRI
Objective: To characterize the differential temporal processing (sustained vs. transient) across ventral and lateral visual streams using modeled fMRI responses [15].
Materials: 3T or higher fMRI scanner, capable of multi-slice echo-planar imaging.
Stimuli: Images of faces, bodies, and control objects (e.g., pseudowords).
Procedure:
- Localizer Scan: Conduct a standard functional localizer to independently define category-selective regions of interest (ROIs) in ventral and lateral temporal cortex.
- Experimental Runs: Perform three main fMRI experiments in a blocked design, with trials of 3, 5, 10, and 20 s interleaved with 12-s blank periods:
- Experiment 1 (Sustained): A single image is presented for the entire trial duration.
- Experiment 2 (Transient): 30 brief (33 ms) images are presented per trial, with inter-stimulus intervals increasing with trial duration.
- Experiment 3 (Semi-Continuous): 30 images are presented per trial with a constant 33-ms blank between images; image duration increases with trial duration.
- Modeling and Analysis:
- Use an encoding framework that models neural responses with separate sustained and transient channels at millisecond precision.
- Convolve the modeled neural response with a hemodynamic response function to predict the BOLD signal.
- Fit the model to the actual fMRI data from each ROI to quantify the contribution of sustained and transient channels.
Protocol 2: Direct Imaging of Neuronal Activity with Ultrafast fMRI
Objective: To capture neuronal activity with high temporospatial resolution using advanced MRI acquisition sequences [19].
Materials: High-field MRI scanner (e.g., 9.4 T for animal studies), capable of fast line-scanning.
Procedure:
- Animal Preparation: Anesthetized and prepared mice (e.g., with whisker-pad stimulation or optogenetic setup).
- Data Acquisition: Implement a two-dimensional fast line-scan approach to achieve millisecond temporal resolution while retaining spatial resolution.
- Validation: Correlate the observed MRI signal with direct measures of neural activity, such as in vivo spike recordings or optogenetics.
- Data Analysis: Analyze the sequential and laminar-specific propagation of neuronal activity along target pathways (e.g., thalamocortical).
Research Reagent Solutions
Essential materials for experiments in millisecond-resolution neuroimaging.
| Item | Function | Example Application |
|---|---|---|
| Genetically Encoded Calcium Indicators (GECIs) [18] | Fluorescent proteins that change intensity upon binding calcium ions, indirectly reporting neural activity. | Monitoring population neural activity in preclinical models (e.g., using GCaMP6, jGCaMP7). |
| Genetically Encoded Voltage Indicators (GEVIs) [18] | Fluorescent proteins that report changes in membrane potential directly. | Directly imaging action potentials and subthreshold voltage dynamics at high speeds (e.g., >1000 fps). |
| Voltage-Sensitive Dyes (VSDs) [18] | Synthetic dyes that bind to cell membranes and fluoresce in response to voltage changes. | Large-scale mapping of neuronal population activity with high temporal resolution. |
| Optically Pumped Magnetometers (OPMs) [16] | New sensor technology that detects weak magnetic fields without cryogenic cooling. | Wearable MEG systems that can provide improved signal and spatial resolution. |
| Specific PET Radioligands [17] [20] | Radioactive molecules that bind to specific molecular targets in the brain (e.g., dopamine receptors). | Measuring target occupancy and brain penetration of drugs in development. |
Methodological Visualizations
MEG-fMRI Fusion Workflow
Sustained vs. Transient Channel Modeling
Pharmacodynamic Neuroimaging in Drug Development
The Impact of Sampling Rate on BOLD Sensitivity and Physiological Noise Aliasing
Frequently Asked Questions
What is the primary relationship between TR and physiological noise aliasing? A shorter TR (higher sampling rate) increases the Nyquist frequency, which is the maximum frequency that can be accurately represented in the data. When the sampling rate is too low, high-frequency physiological signals (e.g., from cardiac and respiratory cycles) are misrepresented as lower-frequency oscillations. This is called aliasing, and it can obscure the very low-frequency (VLF) BOLD signals of interest [21] [22].
I am designing a task-fMRI experiment. Should I always use the shortest TR possible? Not necessarily. While a shorter TR provides a more precise measurement of the Hemodynamic Response Function (HRF) and reduces aliasing, it also results in a larger data burden and lower temporal signal-to-noise ratio (tSNR) per volume. A practical solution is to acquire data with a short TR and then temporally average consecutive volumes. This approach has been shown to increase the measured BOLD signal change and tSNR, offering a favorable compromise [23].
My research focuses on the brainstem. Why is this region particularly problematic? The brainstem is located near major arteries and pulsatile cerebrospinal fluid (CSF)-filled spaces. Cardiac pulsations cause significant bulk motion and flow changes in this area, leading to a much higher magnitude of physiological noise. Consequently, the brainstem exhibits dramatically reduced tSNR compared to cortical areas, making functional imaging especially challenging [21] [24].
How does magnetic field strength (e.g., 3T vs. 7T) affect this issue? At higher field strengths (e.g., 7T), the overall signal-to-noise ratio (SNR) increases. However, physiological noise also increases proportionally more, even becoming the dominant noise source. This makes physiological noise correction methods particularly critical for high-field fMRI to realize the full benefits of the increased SNR [25] [24].
Are conventional resting-state metrics like Functional Connectivity (FC) and ICA affected by sampling rate? Studies using critically-sampled data have shown that conventional time and spatial domain metrics (e.g., FC and ICA) remain relatively stable across a range of TRs (0.1–3 s). However, faster sampling rates (TR < 1 s) are crucial for more advanced, dynamic analyses, such as detecting quasi-periodic patterns (QPPs) of VLF events, which benefit linearly from shorter TRs [22].
Troubleshooting Guides
Problem 1: Aliased Physiological Noise Contaminating the BOLD Signal
Issue: Cardiac and respiratory signals are aliased into the low-frequency range (<0.1 Hz), masking neuronally-driven BOLD fluctuations and leading to potentially false positive results in resting-state networks or task-based analyses [25].
Solution: Implement strategies to avoid or correct for aliasing.
Step 1: Increase Sampling Rate
- Action: Use acquisition sequences that allow for a shorter TR (< 1 s). Techniques include multi-band (Simultaneous Multi-Slice, SMS) imaging, shifted echo EPI, or 3D single-shot acquisitions like Magnetic Resonance Encephalography (MREG) [23] [22] [26].
- Rationale: A TR of < 0.25 s is needed to critically sample the cardiac signal (>1 Hz) according to the Nyquist theorem. While this can be challenging for whole-brain coverage, even a TR of 0.7-0.87 s can significantly reduce the overlap between aliased physiological noise and the VLF BOLD band [27] [22].
Step 2: Apply Advanced Physiological Noise Correction
- Action: Use model-based correction techniques on the acquired data. The gold standard is RETROICOR, which uses external measurements of cardiac and respiratory cycles [25] [24]. For fast fMRI data (TR < 1 s), consider newer methods like Harmonic Regression with Autoregressive Noise (HRAN), which can model cardiac and respiratory noise directly from the data without external recordings [27].
- Rationale: These methods mathematically model and remove the structured noise caused by physiology, leaving behind the BOLD signal of interest. At 7T, such corrections have been shown to improve tSNR by 25-70% [25].
Step 3: Leverage Multi-Echo Acquisitions
- Action: Acquire data at multiple echo times and use Multi-Echo Independent Component Analysis (ME-ICA) to separate BOLD from non-BOLD components [26].
- Rationale: BOLD signals scale linearly with echo time (TE), while many physiological artifacts do not. ME-ICA automatically classifies and removes non-BOLD components, significantly improving sensitivity and specificity [26].
Visual Guide: The Relationship Between TR and Noise Aliasing
The diagram below illustrates how the repetition time (TR) determines whether physiological noise aliases into the low-frequency BOLD band, and the corresponding strategies to mitigate it.
Problem 2: Low Temporal Signal-to-Noise Ratio (tSNR) in Fast fMRI
Issue: Acquiring data with a very short TR often results in a lower tSNR per individual volume, which can reduce the sensitivity to detect true BOLD activation [23].
Solution: Utilize post-acquisition temporal averaging to improve tSNR without sacrificing the benefits of a high sampling rate.
Step 1: Acquire Data with Short TR
- Action: Use a sequence that allows for a high sampling rate (e.g., TR = 700 ms) [23].
Step 2: Apply On-Scanner or Post-Processing Temporal Averaging
- Action: Average every two or four consecutively acquired volumes to create a new time series with an effective, longer TR (e.g., 1400 ms or 2800 ms) [23].
- Rationale: This averaging process smooths out random thermal noise, thereby increasing the tSNR of the final time series. Research has shown that averaging every two volumes (effective TR=1400 ms) can yield both increased tSNR and significantly higher BOLD signal change compared to a native sequence with a similar TR [23].
Experimental Protocol: Evaluating Temporal Averaging
- Reference: This method is adapted from a study that compared multiple EPI sequences on healthy subjects performing a visual-motor task [23].
- 1. Sequences:
- REF: A standard EPI sequence (e.g., TR = 1440 ms).
- SHORT: A shifted-echo EPI sequence with short TR (e.g., TR = 700 ms).
- AVG2: The SHORT sequence with on-scanner averaging of every 2 volumes (effective TR = 1400 ms).
- AVG4: The SHORT sequence with on-scanner averaging of every 4 volumes (effective TR = 2800 ms).
- 2. Analysis:
- Calculate the tSNR for each sequence.
- Compare the BOLD signal change (% ) and the resulting activation map statistics (e.g., number of activated voxels, t-scores) across the four sequence types.
Quantitative Data on Sampling Rate Effects
Table 1: Impact of Sampling Rate on Physiological Noise Power and Resting-State Metrics
This table summarizes key findings from a study that used critically-sampled MREG data (TR=0.1 s) subsampled to different TRs (sTR) to evaluate the effects on various metrics [22].
| Metric / Signal Type | Impact of Short TR (0.1 - 0.5 s) | Impact of Long TR (1 - 3 s) | Key Finding |
|---|---|---|---|
| Conventional FC & ICA | Minimal change | Minimal change | These spatial and time-domain metrics are robust across a wide TR range. |
| Cardiac Power (~1 Hz) | Accurately sampled in its native band. | Aliases over the respiratory frequency band, especially at sTR 1–2 s. | Strongest aliasing occurs in central brain regions. |
| Respiratory Power (~0.3 Hz) | Accurately sampled in its native band. | Shows aliasing in the VLF range. | |
| VLF Power (< 0.1 Hz) | Minimal contamination from cardiorespiratory signals. | Suffers from aliased cardiorespiratory power. | VLF fluctuations are a true physiological phenomenon, not solely a result of aliasing [28]. |
| Quasi-Periodic Patterns | High repeatability of VLF event detection. | Linear reduction in detection repeatability with increasing TR. | Dynamic FC analyses benefit linearly from shorter TRs. |
Table 2: Performance of Different EPI Sequences in a Task-fMRI Experiment
This table compares the performance of a standard EPI sequence against a short-TR sequence with and without temporal averaging, based on a visual-motor task study [23].
| Sequence Acronym | Description | Temporal SNR (tSNR) | BOLD Signal Change |
|---|---|---|---|
| REF | Standard EPI, TR = 1440 ms | Baseline | Baseline |
| SHORT | Shifted-echo EPI, TR = 700 ms | Lower than REF | Not reported as highest |
| AVG2 | SHORT, 2 vols averaged, TR=1400 ms | Increased over SHORT | Significantly increased over REF and SHORT |
| AVG4 | SHORT, 4 vols averaged, TR=2800 ms | Increased over SHORT | Decreased compared to other sequences |
The Scientist's Toolkit
Table 3: Essential Research Reagents and Methodologies
| Item / Methodology | Function / Purpose in the Context of Sampling Rate |
|---|---|
| Simultaneous Multi-Slice (SMS/Multi-band) EPI | Enables whole-brain coverage at very short TRs (< 1 s) by simultaneously exciting and acquiring multiple slices. This is a key hardware/sequence solution for high-temporal-resolution fMRI [26]. |
| Shifted Echo EPI Sequence | A pulse sequence technique that allows for a shorter TR with acceptable spatial resolution by storing and recalling magnetization from a previous TR interval. A more accessible alternative to SMS for some scanners [23]. |
| RETROICOR | A model-based physiological noise correction method. It uses external recordings of cardiac and respiratory cycles to create noise regressors that are removed from the fMRI data during analysis [25] [24]. |
| HRAN (Harmonic Regression with Autoregressive Noise) | A model-based noise removal method designed for fast fMRI. It estimates and removes cardiac and respiratory noise directly from the data without requiring external recordings, leveraging the full sampling of physiology at short TRs [27]. |
| ME-ICA (Multi-Echo ICA) | A data analysis pipeline that combines multi-echo fMRI acquisitions with Independent Component Analysis. It automatically distinguishes BOLD from non-BOLD (physiological, motion) components based on their linear dependence on echo time, improving sensitivity [26]. |
| External Physiological Monitors | Equipment (pulse oximeter, respiratory belt) required for RETROICOR and for validating data-driven noise correction methods. They provide the ground-truth cardiac and respiratory waveforms [25] [24]. |
FAQ: Addressing Common fMRI Sequence Challenges
Q1: What is the fundamental trade-off between Gradient-Echo (GE) and Spin-Echo (SE) EPI sequences? The core trade-off is sensitivity versus specificity [29] [30].
- GE-EPI offers high sensitivity, yielding a strong BOLD signal and high temporal signal-to-noise ratio (tSNR), making it excellent for detecting activation over large brain areas [29] [30]. However, its signal includes contributions from large draining veins (macrovessels), which can create signals distant from the actual neural activity site, thereby reducing spatial specificity [29] [31].
- SE-EPI uses a refocusing pulse to suppress signals from large veins, resulting in higher spatial specificity as it is more weighted toward the microvasculature closer to the neural activity [29] [31] [30]. The main disadvantage is its lower BOLD sensitivity and contrast-to-noise ratio (CNR) compared to GE-EPI, often requiring more trials or subjects to achieve robust results [29] [32] [30].
Q2: My fMRI study focuses on the inferior temporal lobe or orbitofrontal cortex, regions prone to signal dropout. Which sequence should I choose? For regions near air-tissue interfaces like the inferior temporal lobe or orbitofrontal cortex, SE-EPI is often superior [32] [13] [30]. GE-EPI is highly susceptible to magnetic field inhomogeneities in these areas, causing severe signal loss (dropout) that can lead to false negatives [32] [13]. The SE-EPI's refocusing pulse makes it robust against this type of signal loss, enabling the recovery of functional data from these critical regions involved in semantic cognition and emotion processing [32] [13] [30].
Q3: I am planning a laminar or columnar fMRI study at high resolution. How do I choose between GE and SE sequences? Your choice depends on the primary goal of your study [29]:
- For encoding/decoding analyses or large-scale mapping that benefits from high sensitivity and large coverage, GE-EPI is preferable, though its results may exhibit vascular biases across cortical depths [29].
- If high spatial specificity is required for submillimeter mapping of features like tonotopy or orientation columns, a T2-weighted SE-based sequence (like 3D GRASE) is recommended to minimize biases from macrovasculature [29]. A hybrid approach is also emerging: phase regression can be applied to GE-EPI data to create a microvasculature-weighted time series (GE-EPI-PR), which combines higher sensitivity than SE-EPI with improved specificity comparable to SE-EPI [33].
Q4: What are the often-overlooked drawbacks of using high multiband acceleration factors to achieve short TR? While multiband (MB) acceleration allows for shorter TRs and higher resolution, high acceleration factors come with significant trade-offs [34]:
- Increased Signal Dropout: Higher MB factors can cause pronounced signal dropout in medial and ventral brain regions, potentially compromising data from subcortical and medial-temporal structures [34].
- Lower SNR: Short TRs reduce T1 recovery time, leading to lower overall SNR. Small voxel sizes (e.g., 2 mm isotropic), often used with MB, have a much lower volume and thus lower SNR compared to standard 3 mm voxels [34].
- Introduction of Artefacts: MB sequences can introduce slice-leakage artifacts, structured noise, and motion-related artifacts that are less prevalent in single-band acquisitions [34].
Experimental Protocols & Methodologies
Protocol: Direct Comparison of GE-EPI and SE-EPI for a Cognitive Task
This protocol is adapted from a whole-brain, high-resolution study at 7T [30].
- Objective: To compare the sensitivity, specificity, and CNR of GE-EPI and SE-EPI sequences during a cognitive task (e.g., color-word Stroop task) known to activate a distributed network.
- Scanner: 7T MRI system with a 32-channel head coil.
- Pulse Sequences:
- Multiband GE-EPI: Resolution = 1.5 mm isotropic, TR = 1.5 s, TE = 22 ms.
- Multiband SE-EPI (using PINS refocusing pulses to manage SAR): Resolution = 1.5 mm isotropic, TR = 1.5 s, TE = 56 ms.
- Task Design: Blocked or event-related design with alternating conditions (e.g., congruent vs. incongruent trials in the Stroop task).
- Key Analysis Steps:
- Preprocessing: Standard pipeline including motion correction, distortion correction, and spatial smoothing with a small kernel (e.g., 2-3 mm FWHM).
- First-Level GLM: Model the task conditions for each subject and sequence separately.
- Quantitative Comparison:
- Calculate tSNR for each sequence across the brain.
- Compare the number of activated voxels and effect size (beta values) in key ROIs (e.g., visual cortex, prefrontal cortex, orbitofrontal cortex).
- Assess spatial specificity by examining activation overlap with known venous structures (from susceptibility-weighted images) and by comparing activation patterns in regions prone to dropout [30].
Protocol: High-Resolution Laminar fMRI with Phase Regression
This protocol details a method to enhance the spatial specificity of GE-EPI for high-resolution studies [33].
- Objective: To achieve microvascular-specific fMRI at submillimeter resolution using phase regression on GE-EPI data.
- Scanner: Neuro-optimized 7T system.
- Pulse Sequences:
- High-Resolution GE-EPI: Isotropic resolution (e.g., 0.8 mm), standard parameters.
- Anatomical Reference: MP2RAGE for precise surface segmentation.
- Venous Map: Multi-echo gradient echo sequence to identify large veins.
- Stimulus: A robust, simple stimulus such as an 8 Hz contrast-reversing checkerboard.
- Analysis Workflow:
- Cortical Surface Reconstruction: Segment the MP2RAGE to create pial and white matter surfaces.
- Laminar Segmentation: Divide the cortical ribbon into equi-volume layers (e.g., superficial, middle, deep).
- Phase Regression: Apply the phase regression algorithm to the GE-EPI time series to create a new, microvasculature-weighted time series (GE-EPI-PR) [33].
- Validation: Compare the laminar activation profiles of GE-EPI, GE-EPI-PR, and SE-EPI. A successful application will show GE-EPI-PR profiles that are more similar to the specific SE-EPI profiles than to the original GE-EPI [33].
Quantitative Data Comparison
Table 1: Performance Comparison of GE-EPI and SE-EPI Sequences
| Feature | Gradient-Echo (GE) EPI | Spin-Echo (SE) EPI | Notes & References |
|---|---|---|---|
| Spatial Specificity | Lower (sensitive to macrovasculature) | Higher (specific to microvasculature) | SE refocuses static dephasing around large veins [29] [31] [30] |
| BOLD Sensitivity / CNR | Higher | Lower (approx. 3-fold reduction at 3T) | GE provides superior detection power for whole-brain studies [29] [32] [30] |
| Signal in Dropout Regions | Poor (e.g., inferior temporal lobe) | Good / Recovered | SE enables fMRI in regions affected by magnetic susceptibility [32] [13] [30] |
| Typical tSNR | Higher | Lower | SE-EPI showed ~25% lower gray matter tSNR vs. GE-EPI at 7T [30] |
| SAR (Power Deposition) | Lower | Higher (due to refocusing pulse) | High SAR at UHF requires solutions like PINS pulses for whole-brain SE [30] |
| Ideal Application Scope | Whole-brain mapping, encoding/decoding | Laminar/columnar fMRI, regions with dropout | Choice depends on primary research question [29] |
Table 2: Impact of Key Acquisition Parameters on fMRI Data Quality
| Parameter | Impact on Data Quality | Recommendation |
|---|---|---|
| Voxel Size | SNR scales linearly with voxel volume. Reducing voxel size from 3mm to 2mm isotropic reduces volume and SNR by ~3.4x [34]. | Use the largest voxel size justified by your spatial resolution needs to preserve SNR, especially for smaller studies. |
| Multiband (MB) Factor | High MB factors can cause signal dropout in ventral brain regions and introduce noise/artefacts [34]. | Use the minimum MB factor needed to achieve your target TR. Avoid ultra-high factors (>8) for whole-brain studies. |
| Echo Train Length (ETL) | For SE-EPI, longer ETL (readout duration) increases macrovascular contamination, reducing spatial specificity [31]. | Minimize the ETL-duration as much as possible for SE-EPI to maintain its microvascular specificity [31]. |
| Repetition Time (TR) | Very short TRs (<1 s) reduce SNR due to insufficient T1 recovery. The HRF is a slow signal [34]. | A TR of ~1-1.5 seconds is often a good balance between temporal resolution and SNR for many studies [34]. |
Signaling Pathways and Experimental Workflows
fMRI Sequence Selection Guide
BOLD Signal Genesis and Specificity
The Scientist's Toolkit: Essential Research Reagents & Materials
Table 3: Key Solutions for Advanced fMRI Research
| Item / Solution | Function / Application | Technical Notes |
|---|---|---|
| Phase Regression Post-Processing | A technique to reduce macrovascular weighting in GE-EPI data, improving spatial specificity while retaining high sensitivity [33]. | Uses the phase information from the GE-EPI signal. Creates a microvasculature-weighted time series (GE-EPI-PR) that can rival SE-EPI specificity with higher CNR [33]. |
| PINS (Power Independent of Number of Slices) Pulses | Enables whole-brain, high-resolution SE-EPI at UHF by circumventing SAR limitations of standard multiband refocusing pulses [30]. | Makes the power deposition of the refocusing pulse independent of the number of simultaneously excited slices, overcoming a major barrier for SE-fMRI [30]. |
| gSLIDER-SWAT | A spin-echo based acquisition (gSLIDER) with a novel reconstruction (SWAT) that enables high spatial-temporal resolution fMRI at 3T [13]. | Reduces vein bias and signal dropout versus GE-EPI. Provides ~2x tSNR gain over traditional SE-EPI and a 5-fold increase in nominal temporal resolution [13]. |
| Dual-/Multi-echo GE-EPI | Acquires multiple echoes after a single excitation. The shorter echoes mitigate signal dropout, while longer echoes provide BOLD contrast [32]. | Helps recover signal in dropout-prone regions. Echoes can be combined (e.g., weighted CNR) to improve data quality and reduce dropout compared to standard single-echo GE [32]. |
| Hyperoxic Gas Challenge | Used as a validation method to induce a global, spatially homogeneous change in blood oxygenation (dHb), mimicking functional activation [31]. | Useful for characterizing sequence specificity (e.g., macrovascular contamination in SE-EPI vs. ETL) without the confound of localized vascular volume changes [31]. |
Next-Generation Acquisition and Analysis: A Technical Deep Dive into High-Temporal-Resolution fMRI
Core Technical Specifications
The following table summarizes the key technical specifications and performance metrics of the gSLIDER-SWAT method.
| Parameter | Specification | Performance Metric | Value |
|---|---|---|---|
| Spatial Resolution | 1 × 1 × 1 mm³ (isotropic) [13] | Temporal Resolution Gain | 5-fold (TR: ~18 s → ~3.5 s) [13] |
| gSLIDER Factor | 5 [13] | tSNR Gain | ~2× over traditional Spin-Echo EPI [13] |
| Acquisition Type | Spin-Echo (SE) based [13] | Effective TR | ~3.5 s (with SWAT) [13] |
| Thin-Slab Thickness | 5 mm [13] | Native gSLIDER TR | ~18 s [13] |
| Reconstruction | Tikhonov-regularized linear regression [35] | Key Improvement | Enhanced detection of functional networks at 3T [13] |
Implementation and Experimental Protocols
gSLIDER-SWAT Acquisition and Reconstruction Workflow
The following diagram illustrates the end-to-end process from data acquisition to high-resolution fMRI reconstruction.
Technical Foundations and Advantages
gSLIDER-SWAT addresses two major limitations in high-resolution fMRI: insufficient temporal signal-to-noise ratio (tSNR) at 3T and signal dropout in critical brain regions.
Super-Resolution Acquisition (gSLIDER): The core of gSLIDER involves acquiring multiple thicker "slabs" (e.g., 5 mm) that are each encoded with a different radiofrequency (RF) profile, introducing sub-voxel shifts in the slice direction [13]. These overlapping slabs are then combined to reconstruct images at a higher resolution (e.g., 1 mm) [36]. This technique provides a theoretical √5 SNR gain, dramatically improving signal quality for sub-millimeter imaging at 3T [36].
Temporal Super-Resolution (SWAT): The native gSLIDER acquisition has a long TR (~18 s), making it unsuitable for most fMRI tasks. The SWAT reconstruction algorithm solves this by utilizing the temporal information within individual gSLIDER RF encodings. Unlike simple interpolation, SWAT recaptures high-frequency information, providing a nominal 5-fold increase in temporal resolution (TR ~3.5 s) that is crucial for detecting rapid neural dynamics [13].
Spin-Echo Advantage: Unlike the standard Gradient-Echo Echo-Planar Imaging (GE-EPI), gSLIDER is based on a Spin-Echo (SE) sequence. This makes it less susceptible to large vein bias and susceptibility-induced signal dropout, which is particularly beneficial for studying regions near air-tissue interfaces like the amygdala and orbitofrontal cortex [13].
Troubleshooting Guide and FAQs
Frequently Asked Questions
Q1: Our gSLIDER reconstruction shows excessive blurring. What could be the cause? A1: Blurring is often related to the Tikhonov regularization parameter (λ). A value that is too high can over-smooth the data. Reconstruct a test dataset while varying λ to find an optimal balance between noise reduction and sharpness. Also, verify the accuracy of the forward model matrix (A) which contains the spatial RF-encoding information [35].
Q2: The achieved temporal resolution with SWAT is not as expected. How can we validate it? A2: Begin by validating the gSLIDER-SWAT sequence with a simple block-design paradigm whose frequency is at the Nyquist limit of the sequence. The study validated SWAT using a hemifield checkerboard paradigm with a block duration equal to the TR, demonstrating robust activation in the primary visual cortex, confirming the temporal resolution gain [13].
Q3: Why would we choose gSLIDER-SWAT over accelerated GE-EPI for emotion studies? A3: For emotion research targeting limbic regions such as the amygdala, gSLIDER-SWAT is superior. Standard GE-EPI suffers from signal dropout in these areas due to susceptibility artifacts. The Spin-Echo based gSLIDER-SWAT mitigates this dropout, providing more reliable signal from frontotemporal-limbic regions, as demonstrated by its ability to detect joy-related activation in the basolateral amygdala [13].
Q4: We are experiencing low tSNR in our final reconstructed data. What should we check? A4: First, ensure your acquisition parameters match the validated protocols (e.g., coil configuration, FOV, TE). The ~2x tSNR gain is achieved relative to traditional SE-EPI with matched parameters [13]. Second, confirm that the gSLIDER reconstruction is using the correct slab profiles and that the RF-encoding basis is properly orthogonalized to maximize the SNR benefit from the simultaneous slice acquisition [36].
Common Experimental Issues and Solutions
| Problem | Possible Causes | Recommended Solutions |
|---|---|---|
| Poor Activation Detection | 1. Head motion during long TR.2. Suboptimal task design for temporal resolution.3. Incorrect GLM model. | 1. Implement robust motion correction and real-time tracking.2. Design tasks with blocks/events compatible with a ~3.5s TR.3. Model the hemodynamic response using the effective SWAT TR. |
| Geometric Distortions | 1. Incorrect B0 field map.2. EPI readout inconsistencies. | 1. Acquire a matched B0 field map for distortion correction.2. Ensure system calibrations (e.g., GRAPPA) are performed correctly. |
| Reconstruction Failure | 1. Corrupted or missing raw data.2. Incorrect calibration data (B1 maps). | 1. Verify data integrity from the scanner.2. Ensure magnitude, phase, and B1 maps are acquired and loaded correctly in the custom MATLAB reconstruction code [35]. |
The Scientist's Toolkit: Essential Research Reagents
The table below lists the key "research reagents"—the materials, equipment, and software—required to implement the gSLIDER-SWAT methodology.
| Reagent / Solution | Function / Role in the Experiment |
|---|---|
| 3T MRI Scanner | Platform for data acquisition. The method has been validated on Siemens Prisma and Skyra models [13]. |
| Multi-Channel Head Coil | Signal reception. A 64-channel or 32-channel head coil is used to achieve the necessary SNR for high-resolution imaging [13]. |
| gSLIDER Pulse Sequence | The specialized MRI pulse sequence that performs the slab acquisition with RF encoding and sub-voxel shifts [13]. |
| Custom MATLAB Reconstruction Code | Implements the SWAT algorithm and Tikhonov-regularized linear regression to reconstruct high spatio-temporal resolution images from the raw slab data [35]. |
| B1 Mapping Sequence | Acquires coil sensitivity maps, which are critical inputs for the accurate reconstruction of the gSLIDER data [35]. |
| Naturalistic Video Stimuli | For probing complex emotional states like joy. These stimuli engage hierarchical temporal processing in the brain and are key for ecologically valid paradigms [13]. |
Multi-Slab Echo-Volumar Imaging (EVI) represents a groundbreaking advancement in functional magnetic resonance imaging (fMRI) technology, specifically engineered to achieve unprecedented temporal resolution for whole-brain scanning. This technique enables researchers to capture brain activity at sub-second intervals while maintaining millimeter-scale spatial precision, addressing a critical need in neuroscience for understanding rapid neural dynamics and functional connectivity. By combining the sampling efficiency of single-shot 3D encoding with the sensitivity advantage of multi-echo acquisitions, Multi-Slab EVI provides a powerful framework for investigating brain function at both high spatial and temporal dimensions [37].
The fundamental innovation of Multi-Slab EVI lies in its ability to overcome traditional limitations of conventional echo planar imaging (EPI), which typically requires 2-3 seconds for whole-brain coverage. Through sophisticated acceleration strategies including simultaneous multi-slab encoding, in-plane parallel imaging, and kz-segmentation, this approach reduces volume acquisition times to within 200 milliseconds while preserving blood oxygen level-dependent (BOLD) sensitivity. This technological leap opens new possibilities for studying high-frequency resting-state connectivity, capturing transient neural events, and monitoring rapid brain dynamics that were previously inaccessible to fMRI researchers [37].
Technical Specifications and Performance Metrics
Quantitative Performance of Multi-Slab EVI
| Parameter | Standard Range | Optimal Performance | Measurement Conditions |
|---|---|---|---|
| Temporal Resolution (TR) | 118-650 ms | 163 ms | 3 mm isotropic voxels [37] |
| Spatial Resolution | 1-3 mm isotropic | 1 mm isotropic | Whole-brain coverage [37] |
| Multi-Band Factor | Up to 6 slabs | 12 slabs | With CAIPI shifting [37] |
| In-plane Acceleration | Up to 4-fold GRAPPA | 4-fold GRAPPA + partial Fourier | Two phase-encoding dimensions [37] |
| BOLD Sensitivity | Comparable to MS-EVI | Enhanced with NORDIC | 2-3 mm spatial resolution [37] |
| High-Frequency Connectivity | Up to 0.3 Hz | Above 0.3 Hz | TR: 163 ms [37] |
| Scan Time for Task-Based Activation | Several minutes | 1 minute 13 seconds | 1 mm isotropic voxels [37] |
Comparison with Alternative fMRI Sequences
| Sequence Type | Temporal Resolution | Spatial Resolution | Key Advantages | Limitations |
|---|---|---|---|---|
| Multi-Slab EVI | 118-650 ms [37] | 1-3 mm isotropic [37] | High spatiotemporal resolution, minimal blurring | Complex reconstruction |
| Conventional EPI | 2-3 seconds [38] | 3 mm isotropic [38] | Established methods, simpler implementation | Limited temporal resolution |
| Multi-Band EPI (MB-EPI) | Sub-second to seconds [38] | 2-3 mm isotropic [38] | High acceleration factors | g-factor penalties at high acceleration |
| Multiplexed EPI (M-EPI) | Significant reduction vs standard EPI [38] | Similar to MB-EPI [38] | Combined SIR and multiband acceleration | Increased distortion with higher S factors |
Experimental Protocols and Methodologies
Pulse Sequence Implementation
The MB-EVI pulse sequence development involves a sophisticated integration of multiple acceleration techniques. The sequence begins with a multi-band RF pulse capable of simultaneously exciting up to 6 slabs, incorporating a highly selective numerically optimized excitation RF pulse shape with 24 sidelobes to ensure clean slab profiles. Following excitation, kz encoding gradient blips are placed in front of the EPI readout modules for each echo time to encode kz steps from -N/2-1 to N/2. The sequence employs blipped CAIPI (Controlled Aliasing in Parallel Imaging) shifting patterns to improve slice separation and reduce g-factor penalties [37].
For within-slab acceleration, the protocol utilizes up to 4-fold GRAPPA undersampling combined with up to 5/8 partial Fourier acquisition along both phase-encoding dimensions. The prescan protocol includes noise acquisition, auto-calibration signal line measurement, and single-band reference acquisition. For reconstruction, the raw data is processed using regularized "leak-block" slab-GRAPPA multiband reconstruction to limit slab cross-talk between excitation shots, followed by in-plane GRAPPA reconstruction and coil channel combination [37].
Online Signal Processing Workflow
Troubleshooting Guide: Frequently Encountered Issues
Image Quality and Reconstruction Problems
Issue: Poor Temporal Signal-to-Noise Ratio (tSNR)
- Potential Cause: Insufficient acceleration factors leading to T2* decay blurring
- Solution: Implement online exponential deconvolution of T2* signal decay to reduce spatial blurring [37]
- Prevention: Optimize multi-band factor and in-plane acceleration balance based on coil array capabilities
Issue: Slab Boundary Artifacts
- Potential Cause: Cross-talk between simultaneously excited slabs
- Solution: Apply regularized "leak-block" slab-GRAPPA reconstruction to limit inter-slab interference [37]
- Prevention: Use highly selective RF pulses with multiple sidelobes (e.g., TSE3D90-TB28OP2 pulse shape)
Issue: Reconstruction Failures with High Acceleration Factors
- Potential Cause: g-factor penalties exceeding coil array capabilities
- Solution: For accelerations >8, use S=2 (simultaneous echo refocusing) rather than relying solely on multiband factors [38]
- Prevention: Perform pre-scan calibration with noise acquisition and auto-calibration signals
Sequence Optimization Challenges
Issue: Inadequate BOLD Sensitivity at High Resolutions
- Potential Cause: Trade-off between spatial resolution and temporal resolution
- Solution: Implement NORDIC denoising to enhance fMRI sensitivity without introducing image blurring [37]
- Prevention: For 1 mm isotropic acquisitions, ensure adequate scan duration (>1 minute for task-based activation)
Issue: Geometrical Distortion and Signal Dropout
- Potential Cause: Prolonged echo train length
- Solution: Incorporate 2-shot kz-segmentation to reduce the duration of EVI readout within slabs [37]
- Prevention: Use partial Fourier acquisitions along both phase-encoding dimensions
The Scientist's Toolkit: Essential Research Reagents
| Research Component | Function | Implementation Example |
|---|---|---|
| Multi-Band RF Pulses | Simultaneous excitation of multiple slabs | Up to 6-slab excitation with CAIPI shifting [37] |
| CAIPIRINHA Encoding | Controlled aliasing to improve separation | Blipped gradient patterns for slice shifting [37] |
| Slab-GRAPPA Reconstruction | Separation of simultaneously acquired slabs | Regularized "leak-block" algorithm to limit cross-talk [37] |
| Exponential T2* Deconvolution | Reduction of spatial blurring | Online processing to improve image contrast [37] |
| NORDIC Denoising | Enhancement of fMRI sensitivity | Post-processing without introducing blurring [37] |
| Compressed Sensing | Additional acceleration | Up to 2.4-fold retrospective undersampling [37] |
Advanced Applications and Future Directions
Multi-Slab EVI enables several advanced research applications that leverage its unique combination of high spatial and temporal resolution. The technique has demonstrated particular utility for mapping high-frequency resting-state connectivity above 0.3 Hz, which is typically inaccessible with conventional fMRI sequences [37]. This capability opens new avenues for investigating rapid neural dynamics and frequency-specific functional networks that may be disrupted in neurological and psychiatric disorders.
The compatibility of Multi-Slab EVI with real-time processing frameworks supports emerging applications in neurofeedback and dynamic paradigm optimization. Researchers can monitor data quality during acquisition and adapt experimental parameters based on ongoing brain activity, particularly valuable for clinical populations and drug development studies where consistent data quality is essential. Furthermore, the combination with complementary acceleration approaches like compressed sensing provides additional flexibility for pushing spatial-temporal resolution limits while maintaining BOLD sensitivity [37].
Future developments in Multi-Slab EVI technology will likely focus on further integration with deep learning-based reconstruction methods, improved denoising techniques, and expanded compatibility with multi-modal imaging approaches. As the method becomes more widely adopted, standardized protocols for different research applications (task-based fMRI, resting-state connectivity, clinical populations) will enhance reproducibility and comparability across studies, ultimately advancing our understanding of brain function in health and disease.
Frequently Asked Questions (FAQs)
FAQ 1: What is the primary temporal limitation of conventional task fMRI (tfMRI) analysis that this deep learning approach addresses?
Most conventional tfMRI studies are constrained by the assumption of temporal stationarity in neural activity. This leads to predominantly block-wise analysis with limited temporal resolution, typically on the order of tens of seconds. This coarse resolution restricts the ability to decode cognitive functions in fine detail. The proposed deep neural network performs volume-wise identification of task states, substantially enhancing temporal resolution to enable a more detailed exploration of rapid cognitive processes [39].
FAQ 2: What are the key performance metrics of the described deep learning model on benchmark datasets?
When evaluated on the Human Connectome Project (HCP) datasets, the deep neural network achieved the following mean accuracy rates in classifying task states, demonstrating robust performance across different cognitive domains [39]:
| Dataset | Mean Accuracy |
|---|---|
| HCP Motor tfMRI | 94.0% |
| HCP Gambling tfMRI | 79.6% |
FAQ 3: Beyond improved decoding, what additional advantage does this methodology provide for neuroscience research?
The study employs visualization algorithms to investigate dynamic brain mappings during different tasks. This provides a significant step forward in frame-level tfMRI decoding, offering new methodologies and tools for examining dynamic changes in brain activities and understanding the underlying cognitive mechanisms. This helps in moving beyond the "black box" criticism often associated with deep learning models [39] [40].
FAQ 4: My fMRI dataset is small. Are there deep learning techniques to prevent overfitting and improve model generalization?
Yes, two prominent techniques are highly relevant for small sample sizes common in neuroimaging:
- Transfer Learning: This method applies knowledge gained from solving one problem (e.g., tfMRI data from one site or a large public dataset like the HCP) to a different but related problem (e.g., your smaller dataset). It can use a pre-trained network as a feature extractor or be fine-tuned on your target domain data [40].
- Data Augmentation (via Mixup): This is a self-supervised learning technique that creates "virtual" instances by combining existing data, effectively expanding the size and diversity of your training set and improving model robustness [40].
Troubleshooting Guide
Problem 1: Model Performance is Poor on My Specific Dataset
- Potential Cause: The model may be experiencing "batch" effects or domain shift because your data has a different distribution from the source data used for pre-training (e.g., different scanner, protocol, or population) [40].
- Solution: Implement Domain Adaptation strategies. This variant of transfer learning specifically handles cases where source and target domains have different distributions but the same prediction task. Techniques include mapping your high-dimensional data to a common, low-dimensional space shared with the source data [40].
Problem 2: The Model's Decisions are Not Interpretable
- Potential Cause: Deep learning models are often criticized as "black boxes" that provide predictions without revealing the basis for their decisions, which is crucial for scientific discovery [40].
- Solution: Integrate Explainable Artificial Intelligence (XAI) tools into your pipeline. XAI methods reveal what features (e.g., specific brain regions or voxels) and in what combinations the deep learner uses to make decisions, thereby opening the "black box" and helping to reveal neuronal mechanisms [40].
Problem 3: Inadequate Temporal Resolution in Acquired fMRI Data
- Potential Cause: The fundamental trade-off between spatial and temporal resolution in fMRI acquisition, or the use of sequences with inherently long repetition times (TR) [13] [41].
- Solution: Consider advanced acquisition sequences like gSLIDER-SWAT (generalized Slice Dithered Enhanced Resolution with Sliding Window Accelerated Temporal resolution). This method can provide a ~2x gain in temporal signal-to-noise ratio (tSNR) over traditional spin-echo EPI and has been shown to achieve a 5-fold increase in nominal temporal resolution (e.g., from TR ~18 s to TR ~3.5 s), making it compatible with a wider range of fMRI paradigms [13].
Experimental Protocols & Methodologies
Key Deep Learning Architecture for Volume-Wise Decoding
The following workflow outlines the core methodology for volume-wise tfMRI decoding as described in the search results.
Protocol Details:
- Network Input: Raw tfMRI volumes from the Human Connectome Project (HCP) for motor and gambling tasks [39] [42].
- Core Innovation: A deep neural network architecture designed for volume-wise identification of task states, moving beyond traditional block-wise analysis [39].
- Output: Frame-level classification of brain states with significantly enhanced temporal resolution [39].
- Validation: Quantitative accuracy assessment and use of visualization algorithms to investigate dynamic brain mappings [39].
High-Resolution fMRI Acquisition Protocol (gSLIDER-SWAT)
For researchers needing to acquire high-quality data, the following protocol validates the gSLIDER-SWAT technique.
Experimental Parameters:
- Field Strength: 3T [13]
- Spatial Resolution: 1.0 mm³ isotropic [13]
- Key Sequence: Spin-echo based generalized Slice Dithered Enhanced Resolution (gSLIDER) [13]
- Reconstruction: Sliding Window Accelerated Temporal resolution (SWAT) for 5-fold nominal temporal resolution increase [13]
- Validation Paradigm: Classic hemifield checkerboard and naturalistic video stimuli for joy [13]
The Scientist's Toolkit: Research Reagent Solutions
Table: Essential Resources for Deep Learning-based fMRI Decoding
| Item Name | Type/Function | Key Specification / Purpose |
|---|---|---|
| HCP Datasets | Benchmark Data | Publicly available tfMRI data (e.g., motor, gambling) for model training and validation [39]. |
| gSLIDER-SWAT | Acquisition Sequence | Enables high spatiotemporal resolution (≤1mm³) fMRI at 3T; reduces large vein bias and signal dropout [13]. |
| Transfer Learning | Computational Method | Leverages knowledge from a source domain (e.g., large public dataset) to improve learning in a target domain with scarce data [40]. |
| Data Augmentation (Mixup) | Computational Method | Creates "virtual" training instances to expand dataset size and improve model robustness, crucial for small samples [40]. |
| Explainable AI (XAI) | Analysis Tool | Reveals features and combinations used by deep learners for decisions, addressing the "black box" problem [40]. |
| Visualization Algorithms | Analysis Tool | Investigates dynamic brain mappings during tasks, enabling exploration of cognitive mechanisms [39]. |
Table: Performance Metrics of Advanced fMRI Methodologies
| Methodology | Key Performance Indicator | Result / Value | Context / Application |
|---|---|---|---|
| Volume-Wise DL Decoding [39] | Mean Classification Accuracy | 94.0% | HCP Motor tfMRI |
| Volume-Wise DL Decoding [39] | Mean Classification Accuracy | 79.6% | HCP Gambling tfMRI |
| gSLIDER-SWAT (3T) [13] | Temporal Resolution Gain | 5-fold increase | Nominal TR reduction (e.g., ~18s to ~3.5s) |
| gSLIDER-SWAT (3T) [13] | tSNR Improvement | ~2x gain | Compared to traditional Spin-Echo EPI |
| Cryogenic RF Coil (9.4T) [9] | tSNR Gain | ~1.8x | Preclinical BOLD response vs. room temperature coil |
Welcome to the Technical Support Center
This support center is designed for researchers, scientists, and drug development professionals working in the field of functional brain imaging. The following FAQs and troubleshooting guides address specific methodological challenges in paradigm-free imaging, with a particular focus on techniques that improve temporal resolution for analyzing both evoked and resting-state brain dynamics without pre-defined models. The guidance is framed within a broader thesis on advancing temporal resolution in functional brain imaging research.
Frequently Asked Questions (FAQs)
Q1: What is the core advantage of using naturalistic stimuli in paradigm-free fMRI? Naturalistic stimuli, such as movies or audio narratives, engage the brain across a rich spectrum of dynamic, real-world experiences. Unlike highly controlled, artificial classical tasks, they allow researchers to explore context-dependent neural processes across different timescales. The key advantage is the ability to drive reliable, stimulus-locked neural responses across different subjects, which enables the use of powerful inter-subject analytical methods to isolate stimulus-related brain dynamics from intrinsic noise [43].
Q2: How can I isolate stimulus-driven brain dynamics from intrinsic activity and physiological noise? Inter-subject analytical methods are particularly effective for this. When multiple subjects experience the same continuous naturalistic stimulus, their brain responses will show reliable, time-locked patterns. Inter-Subject Correlation (ISC) quantifies this across-subject reliability within brain regions. Inter-Subject Functional Correlation (ISFC) extends this to measure stimulus-induced inter-regional connectivity between different subjects. These techniques suppress intrinsic, task-unrelated neural dynamics (e.g., attentional variations) and subject-specific artifacts (e.g., head movement, respiratory fluctuations) that are unlikely to be correlated across individuals [43].
Q3: My high-temporal-resolution fMRI data has a low tSNR. What hardware and sequence improvements can help? Achieving high temporal resolution without sacrificing tSNR is a key challenge. Consider the following approaches:
- Magnetic Field Strength: Moving to ultra-high fields (e.g., 7T, 9.4T, or beyond) provides a supra-linear increase in the functional contrast-to-noise ratio (fCNR) [9].
- Specialized Sequences: Techniques like gSLIDER-SWAT (generalized Slice Dithered Enhanced Resolution with Sliding Window Accelerated Temporal resolution) have been developed specifically for high spatial–temporal resolution fMRI. This spin-echo based method can more than double the tSNR compared to traditional spin-echo EPI and provides a multi-fold increase in effective temporal resolution, making it feasible for use at 3T [13].
- Dedicated RF Coils: Using multi-channel array coils, cryogenically cooled coils, or even implantable coils can tremendously increase the SNR, which directly improves tSNR [9].
Q4: How does temporal resolution (TR) affect the reliability of functional connectivity fingerprints in resting-state fMRI? Recent research indicates that subject identifiability (a measure of fingerprinting reliability) is successful across a range of temporal resolutions (TR from 0.5s to 3s). However, the success rate is not linear; the highest identifiability is often observed at the shortest (TR = 0.5s) and longest (TR = 3s) values, which may be related to protocol-specific effects of physiological noise aliasing. Furthermore, the brain networks that contribute most to a subject's unique fingerprint change depending on whether you are using a fixed TR or integrating data across different TRs [6].
Q5: How can I model cognitive states from fMRI signals without a pre-defined paradigm? The key is to acquire continuous behavioral measures that correlate with the unfolding stimulus. For example, during a naturalistic movie, you can model multiple facets of cognitive function (e.g., episodic memory, emotional intensity, surprise) as they fluctuate over time. These continuously tracked cognitive states can then be correlated with simultaneously recorded fMRI dynamics (e.g., ISFC fluctuations) to elucidate the functional role of brain networks without a pre-designed task structure [43]. Alternatively, deep neural networks (DNNs) can be used as encoding models to learn how features of the naturalistic stimulus are translated into fMRI signals [43].
Troubleshooting Guides
Issue: Poor Inter-Subject Correlation (ISC) During Naturalistic Paradigms
Symptoms:
- Low or non-significant ISC values across your subject cohort.
- Inability to identify consistent, stimulus-locked activation patterns.
Possible Causes and Solutions:
| Cause | Diagnostic Steps | Solution |
|---|---|---|
| Stimulus is not engaging | Check if the stimulus reliably drives attention (e.g., via post-scan questionnaires). | Pre-test stimuli to ensure they are compelling and appropriately complex. Use engaging, narrative-driven content [43]. |
| Excessive subject motion | Inspect framewise displacement metrics from your fMRI preprocessing pipeline. | Implement rigorous real-time head stabilization and apply advanced motion correction algorithms during preprocessing [43]. |
| Physiological noise contamination | Correlate the fMRI time series with recorded physiological data (e.g., respiration, heart rate). | Record physiological data during the scan and use nuisance regression (e.g., with RETROICOR) or implement multi-echo sequences to isolate BOLD signals [43]. |
Issue: Low Temporal Signal-to-Noise Ratio (tSNR) in High-Resolution Acquisitions
Symptoms:
- Noisy time series that obscure the detection of BOLD signals.
- Failure to achieve significant results in GLM or connectivity analyses despite robust paradigms.
Possible Causes and Solutions:
| Cause | Diagnostic Steps | Solution |
|---|---|---|
| Insufficient SNR at acquisition | Check the mean signal intensity in your ROI versus the background noise standard deviation. | Upgrade to a higher-field scanner or use a dedicated high-channel-count or cryogenic RF coil to boost intrinsic SNR [9]. |
| Inefficient acquisition sequence | Compare your sequence's tSNR with values reported in the literature for similar protocols. | Implement advanced sequences like gSLIDER-SWAT, which provides high SNR efficiency and reduced vulnerability to signal dropout, especially in limbic regions [13]. |
| Suboptimal gradient performance | Verify that your EPI sequence uses the maximum feasible gradient strength and slew rate. | Ensure your scanner's gradient system is performing to specification. High-performance gradients (e.g., 400-1000 mT/m) are crucial for high-resolution EPI [9]. |
Experimental Protocols & Workflows
Protocol: Naturalistic fMRI with Inter-Subject Functional Correlation (ISFC)
Objective: To map stimulus-locked functional connectivity without a pre-defined task model, using a continuous auditory or visual narrative.
Methodology Details:
- Stimulus Selection: Choose a rich, engaging naturalistic stimulus (e.g., an audio story or a movie clip) that is 5-15 minutes long.
- Data Acquisition: Acquire fMRI data from a cohort of subjects (N > 20 for good reliability) while they experience the identical stimulus. For improved signal quality in regions like the amygdala, consider a high-temporal-resolution sequence like gSLIDER-SWAT [13].
- Preprocessing: Perform standard fMRI preprocessing (motion correction, normalization, smoothing) and high-pass filtering.
- ISC Analysis: For each brain region, compute the Pearson correlation between the time series of one subject and the average time series of all other subjects. This identifies regions with consistent stimulus-driven responses [43].
- ISFC Analysis:
- Extract time series from multiple ROIs or a whole-brain parcellation.
- For a given subject, compute the functional connectivity between all pairs of ROIs.
- Instead of correlating within a single subject, correlate one subject's ROI A time series with another subject's ROI B time series.
- Repeat this across all subject pairs and ROIs. The resulting ISFC matrix reveals connectivity patterns that are specifically driven by the common stimulus, suppressing subject-specific intrinsic connections [43].
- Validation: Correlate fluctuations in ISFC strength with behavioral measures (e.g., moment-to-moment ratings of memory encoding or emotional arousal) collected during the scan [43].
The following diagram illustrates the core logical workflow and value proposition of the ISFC method for isolating stimulus-driven connectivity.
Protocol: High-Resolution Functional Fingerprinting at Variable TRs
Objective: To assess the reliability of functional connectivity fingerprints from resting-state fMRI acquired at different temporal resolutions.
Methodology Details:
- Data Acquisition: Acquire multiple resting-state fMRI scans from the same group of subjects using different repetition times (TRs), for example, 0.5s, 1.0s, and 2.0s [6].
- Preprocessing: Process all data through a standardized pipeline (e.g., band-pass filtering, denoising with ICA-AROMA).
- Connectivity Matrix Generation: For each subject and each TR, calculate a whole-brain functional connectivity matrix (e.g., using a predefined atlas).
- Fingerprint Calculation (Identifiability):
- For a given TR, compare each subject's connectivity matrix to every other subject's matrix from the same TR session, creating a "self" similarity score.
- Compare it to matrices from different subjects to create "others" similarity scores.
- Subject identifiability is successful if the "self" similarity is significantly higher than the "others" similarity across the cohort [6].
- Analysis: Determine which TR yields the highest identifiability rate and identify which functional brain networks (e.g., Default Mode, Subcortical, Somato-Motor) contribute most strongly to the fingerprint at each TR [6].
The Scientist's Toolkit: Research Reagent Solutions
The following table details essential hardware, software, and methodological "reagents" for advanced paradigm-free imaging research.
| Item Name | Type | Function/Benefit |
|---|---|---|
| gSLIDER-SWAT Sequence | Pulse Sequence | Enables high spatial–temporal resolution (≤1mm³) fMRI at 3T. Reduces large vein bias and signal dropout, crucial for imaging limbic regions, and provides a ~2x gain in tSNR over standard SE-EPI [13]. |
| Ultra-High Field Scanner (≥7T) | Hardware | Increases the base signal-to-noise ratio (SNR) and functional contrast-to-noise ratio (fCNR), which is essential for detecting weak BOLD responses at high resolutions [9]. |
| Cryogenic RF Coil | Hardware | Cooling the RF coil to cryogenic temperatures reduces electronic noise, leading to gains of ~3x in SNR and ~1.8x in tSNR, dramatically improving data quality [9]. |
| High-Performance Gradients | Hardware | Gradient systems with high strength (e.g., 400-1000 mT/m) and slew rates are critical for achieving the high spatial and temporal resolutions required for EPI-based fMRI [9]. |
| Inter-Subject Functional Correlation (ISFC) | Analytical Method | A powerful analytical technique that isolates stimulus-induced functional connectivity by correlating time series across different subjects, effectively suppressing individual-specific noise and intrinsic activity [43]. |
| Deep Neural Network (DNN) Models | Analytical Method | Used as encoding models to map features of complex naturalistic stimuli onto fMRI signals, helping to decode cognitive states and understand hierarchical neural representations without a pre-defined paradigm [43]. |
| Physiological Monitoring System | Accessory Equipment | Essential for recording cardiac and respiratory signals during the fMRI scan. This data is used to model and remove physiological noise from the BOLD signal, improving specificity [43]. |
Signaling Pathway & Workflow Visualizations
The following diagram illustrates the multi-stage workflow for implementing and validating the gSLIDER-SWAT acquisition technique, a key enabler for high-resolution paradigm-free studies.
Frequently Asked Questions (FAQs)
FAQ 1: What is affective chronometry and why is it important for studying emotions like joy? A: Affective chronometry is the study of the temporal dynamics of emotional states. It describes emotions as time-varying internal states characterized by three key parameters: rise-time (the latency to peak response), amplitude (the peak intensity), and duration (how long the response lasts before returning to baseline) [44]. Understanding these dynamics is crucial because it reveals how the brain initiates, sustains, and terminates emotional experiences. Alterations in these dynamics, such as higher emotional inertia (resistance to change), are linked to psychopathology [45].
FAQ 2: How can we achieve both high spatial and temporal resolution when mapping emotional brain networks? A: Traditional fMRI often requires a trade-off. Advanced techniques like Multi-Band Echo-Volumar Imaging (MB-EVI) are now pushing these limits. MB-EVI combines multiple acceleration methods, including simultaneous multi-slab (multi-band) encoding and in-plane parallel imaging, to achieve full-brain coverage with millimeter spatial resolution and sub-second temporal resolution (TR can be as low as 118 ms) at 3 Tesla [37]. This allows for unaliased sampling of rapid emotional processes.
FAQ 3: My fMRI study under anesthesia shows suppressed emotional responses. What are my options? A: Anesthesia is a known confounder as it can impair neuronal transmission and hemodynamic function [9]. The recommended solution is to conduct awake animal fMRI. This requires specialized hardware setups and a period of animal habituation to the experimental conditions to minimize stress and motion. Using integrated body restraints or head fixation via non-invasive helmets are common approaches to enable data collection in awake, behaving subjects [9].
FAQ 4: Can deep learning models help us understand fundamental principles of emotional processing? A: Yes. Convolutional Neural Networks (CNNs) trained purely for visual object recognition have been found to spontaneously develop neurons selective for emotional categories (pleasant, neutral, unpleasant) [46]. This suggests that the ability to represent affective significance may be an intrinsic property of the visual system, emerging as a consequence of learning to recognize objects. Lesioning these selective neurons in the model degrades its emotion recognition performance, confirming their functional role [46].
FAQ 5: How does temporal resolution (TR) in resting-state fMRI affect my ability to identify individuals? A: Research shows that subject "fingerprinting" is possible across a range of temporal resolutions (TRs from 0.5s to 3s), but identifiability success rates vary [6]. The highest subject identifiability was observed at the shortest (TR=0.5s, 64%) and longest (TR=3s, 56%) TRs in one study, suggesting that protocol-specific effects like physiological noise aliasing play a critical role. Regardless of TR, associative brain networks like the Default Mode Network often contribute most to subject identification [6].
Troubleshooting Guides
Issue 1: Low Functional Contrast-to-Noise Ratio (fCNR) in Preclinical fMRI
A low fCNR jeopardizes the detection of weak BOLD signals from emotional stimuli.
- Problem: The evoked BOLD signal change (ΔS/S) is very small (a few percent) and is overwhelmed by noise.
- Solution: Optimize your hardware and acquisition protocol to maximize fCNR, which is the product of the fractional BOLD signal change and the temporal Signal-to-Noise Ratio (tSNR) [9].
- Actionable Steps:
- Increase Magnetic Field Strength (B₀): Move to ultra-high fields (e.g., 9.4T, 11.7T). The BOLD contrast and SNR increase supra-linearly with B₀, though physiological noise also increases [9].
- Use Cryogenic Radiofrequency (RF) Coils: Cooling RF coils to cryogenic temperatures reduces electronic noise. Gains of ~3x in SNR and ~1.8x in tSNR have been reported at 9.4T compared to room-temperature coils [9].
- Consider Implantable Coils: For the highest possible SNR in specific regions, implantable RF coils can be used. These offer dramatic SNR increases (100-500%) but require surgery, which may induce tissue damage or image artifacts [9].
- Upgrade Gradient Systems: Ensure your scanner has high-performance gradients. Modern preclinical systems offer gradient strengths of 400-1000 mT/m and slew rates of 1000-9000 T/m/s, which are essential for high-resolution, rapid EPI acquisitions [9].
Issue 2: Inadequate Temporal Resolution for Tracking Rapid Emotion Dynamics
The standard HRF may be too slow to capture the fast onset and decay of brief emotional states.
- Problem: The repetition time (TR) is too long, leading to an undersampled and aliased signal of emotional brain dynamics.
- Solution: Implement highly accelerated fMRI acquisition sequences.
- Actionable Steps:
- Adopt Multi-Band EVI (MB-EVI): This hybrid approach combines multi-band (simultaneous multi-slab) encoding with accelerated 3D Echo-Volumar Imaging within slabs. It uses techniques like CAIPI shifting, in-plane GRAPPA, and multi-shot segmentation to dramatically shorten TRs to below 200 ms while maintaining millimeter spatial resolution [37].
- Apply NORDIC Denoising: Post-processing with the NORDIC denoising algorithm can significantly enhance fMRI sensitivity after acquisition without introducing spatial blurring, making it compatible with accelerated MB-EVI data [37].
- Explore Compressed Sensing: For further acceleration, retrospective compressed sensing reconstruction can be applied to MB-EVI data, though this may cause region-specific losses in BOLD sensitivity and requires careful validation [37].
Issue 3: Interpreting "Black Box" Deep Learning Models in Affective Neuroscience
A high-performing emotion classifier is of limited scientific value if its decision process cannot be understood.
- Problem: A complex neural network model classifies emotions from EEG or fMRI data accurately, but the contributing brain regions and features are unknown.
- Solution: Implement a post-hoc explainable AI (XAI) framework.
- Actionable Steps:
- Adapt LIME for Structured Data: Use a model-agnostic method like Local Interpretable Model-Agnostic Explanations (LIME). For bi-hemispheric models, adapt LIME to handle the dual-input structure (left and right hemisphere channels separately) [47].
- Generate Relevance Maps: The adapted LIME framework perturbs the input features (e.g., EEG spectral power from different channels) and observes the change in prediction. This quantifies the contribution (relevance) of each feature to the final emotion classification [47].
- Validate with Neuroscience: Map the resulting feature importance scores back to brain anatomy. The model's decisions should align with known neurophysiological phenomena, such as frontal lateralization for joy, to ensure the model is learning biologically plausible patterns [47].
Experimental Protocols & Data
Protocol 1: Mapping Emotion-Selective Neurons in a Deep Neural Network
This in silico protocol investigates whether emotion selectivity is an emergent property of vision systems [46].
- Model Selection: Use a pre-trained CNN (e.g., VGG-16 or AlexNet) as a model of the ventral visual stream.
- Stimuli: Present images from standardized affective picture sets (IAPS, NAPS) spanning pleasant, neutral, and unpleasant categories.
- Analysis:
- Calculate each artificial neuron's normalized mean response to each emotion category to create a tuning curve.
- Compute a Selectivity Index (SI) to quantify how selectively a neuron responds to one emotion over others.
- To test causal function, perform lesioning (setting output to zero) or feature attention enhancement (increasing gain) on emotion-selective neurons and observe the change in the network's emotion recognition performance.
Table 1: Key Metrics from CNN Emotion-Selectivity Experiments
| Metric | Description | Finding in Pre-trained VGG-16 |
|---|---|---|
| Emotion Selectivity | Presence of neurons that respond robustly to one emotion category | Observed in all convolutional layers [46] |
| Layer-wise Progression | Change in selectivity from early to deep layers | Emotion differentiability increases in deeper layers [46] |
| Functional Role | Effect of manipulating selective neurons on task performance | Lesioning decreases, and enhancement increases, emotion recognition accuracy [46] |
| Generalizability | Selectivity across different stimulus datasets (IAPS vs. NAPS) | Many neurons are tuned to the same emotion across datasets [46] |
Protocol 2: Tracking Intrinsic Emotional Brain Dynamics with Resting-State fMRI
This protocol decodes spontaneous emotional states from resting-state fMRI data to model their temporal dynamics [45].
- Classifier Training: Train a machine learning classifier (e.g., a pattern classifier) to decode six discrete emotions (anger, contentment, fear, happiness, sadness, surprise) and a neutral state using fMRI data from participants watching emotionally evocative films or music.
- Resting-State Decoding: Apply the trained classifier to each time point (TR) in a subsequent resting-state fMRI scan to generate a time series of predicted emotional states.
- Dynamic Modeling: Model the sequence of emotional states as a discrete-time Markov process. This model calculates:
- Self-transition Probabilities: The likelihood of remaining in the same emotional state from one TR to the next (related to emotional inertia).
- Other-transition Probabilities: The likelihood of transitioning from one specific emotional state to another.
Table 2: Markov Model Parameters for Emotional Brain Dynamics
| Parameter | Description | Finding in Healthy Populations |
|---|---|---|
| Self-Transition Probability | Probability of staying in the same emotional state | Lower self-transition probability indicates healthier, less rigid emotion dynamics [45] |
| Neutral State Hub | Centrality of the neutral state in the transition network | The neutral state acts as a central hub, with frequent returns to neutral [45] |
| Emotional Inertia | Resistance of an emotional state to change (high self-transition) | Increased inertia for negative states is linked to psychopathology [45] |
| State Recovery | Frequency of resetting from an emotional state back to neutral | Disrupted recovery in psychopathology, with less frequent resets to neutral [45] |
Diagram 1: The affective chronometry framework models emotional dynamics.
Diagram 2: MB-EVI workflow for high-resolution fMRI.
The Scientist's Toolkit: Research Reagent Solutions
Table 3: Essential Tools for High-Resolution Emotion Mapping Research
| Item | Function/Application | Key Details |
|---|---|---|
| Ultra-High Field MRI Scanner | Provides the foundational magnetic field (B₀) for high Signal-to-Noise Ratio (SNR) and BOLD contrast. | Preclinical studies often use 7T to 18T; higher fields provide supra-linear gains in functional CNR [9]. |
| Cryogenic RF Coils | Significantly reduces electronic noise at the signal reception stage to boost SNR and tSNR. | Liquid nitrogen or helium-cooled coils; can provide ~3x gain in SNR compared to room-temperature coils [9]. |
| High-Performance Gradients | Enables rapid switching of magnetic fields for fast imaging sequences like EPI and EVI. | Modern systems: 400-1000 mT/m strength, 1000-9000 T/m/s slew rates. Essential for high spatial resolution and short TRs [9]. |
| MB-EVI Pulse Sequence | Pulse sequence for fMRI that achieves sub-second temporal and millimeter spatial resolution. | Combines multi-band slab excitation with accelerated 3D echo-volumar readouts. Compatible with denoising (NORDIC) and CS [37]. |
| Explainable AI (XAI) Framework | Interprets complex deep learning models to identify brain features critical for emotion classification. | Adapted LIME framework for bi-hemispheric EEG/fMRI models reveals channel/region importance per emotion [47]. |
| NiPy Software Ecosystem | Python-based tools for reproducible neuroimaging data analysis. | Includes nibabel (data I/O), Nilearn (fMRI ML), DIPY (dMRI), MNE (EEG/MEG), and Nipype (pipeline integration) [48]. |
| BIDS Standard | Organizes neuroimaging data in a consistent, machine- and human-readable directory structure. | Critical for reproducibility, data sharing, and using automated analysis pipelines like those built with Nipype [48]. |
Navigating Practical Hurdles: Strategies for Optimizing Temporal Resolution and Data Quality
Physiological noise is a significant challenge in functional brain imaging, as it can obscure the neural signals of interest and compromise data integrity. This technical support guide addresses advanced strategies to combat these artifacts, with a specific focus on how these techniques contribute to the overarching goal of improving temporal resolution in research. Enhanced temporal resolution allows for a more precise understanding of rapid brain dynamics, which is crucial for cognitive neuroscience and the development of neuro-pharmaceuticals. The following sections provide a structured troubleshooting guide, detailed protocols, and resource lists to help researchers optimize their data quality.
Troubleshooting Guide: FAQs on Physiological Noise
Q1: My resting-state fMRI data shows unexplained signal fluctuations that correlate with subject motion. What denoising strategies are most effective?
Motion artifacts remain a primary confound in fMRI. A multi-metric comparison of denoising pipelines has demonstrated that a strategy combining the regression of mean signals from white matter (WM) and cerebrospinal fluid (CSF), along with the global signal, provides the best compromise between artifact removal and preservation of functional network information [49]. This pipeline achieved a high summary performance index in benchmarking studies, effectively mitigating motion-related fluctuations while maintaining the integrity of resting-state networks (RSNs) [49].
Q2: For high-temporal-resolution fMRI acquisitions, are standard denoising pipelines still sufficient?
High-temporal-resolution techniques, such as multi-band echo-volumar imaging (MB-EVI), push the boundaries of fMRI by achieving sub-second sampling. While these methods reduce sensitivity to rapid movement, they also benefit from advanced denoising. Research shows that NORDIC denoising is compatible with and enhances the sensitivity of MB-EVI data without introducing spatial blurring, making it a recommended post-processing step for accelerated acquisitions [37].
Q3: How can I validate the effectiveness of a denoising pipeline on my specific dataset?
Beyond qualitative inspection, quantitative validation is key. It is recommended to use a framework that computes multiple quality metrics which quantify:
- The degree of artifact removal (e.g., measuring residual motion parameters).
- Signal enhancement (e.g., temporal signal-to-noise ratio).
- Resting-state network (RSN) identifiability (e.g., using independent component analysis) [49]. A summary performance index that combines these metrics provides a robust measure of a pipeline's overall efficacy [49].
Q4: Our lab works with diverse MRI scanners and protocols. How can we maintain denoising efficacy across different sites?
Variability in equipment and acquisition parameters is a common challenge. A promising solution is the use of a two-stage denoising framework. This involves first pre-training a model on a large, public dataset, followed by test-time adaptation (TTA) to fine-tune the model on your specific clinical or experimental data. This approach has been successfully used for super-resolution tasks and shows excellent generalizability across different clinical scenarios [50].
Q5: What are the cutting-edge techniques for denoising data from novel optical imaging technologies like GEVIs?
Genetically Encoded Voltage Indicators (GEVIs) are prone to strong physiological noise from hemodynamics and motion. The novel uSMAART fiber recording system was specifically designed to overcome this. Its noise suppression capabilities include an optical decoherence module to eliminate fiber-jitter noise and high-frequency laser modulation to minimize detector electronic noise. This system has demonstrated a 100-fold improvement in sensitivity for recording high-frequency oscillations in specific neuron classes of behaving animals [51].
Table 1: Summary of Denoising Performance for Different fMRI Pipelines [49]
| Denoising Pipeline | Key Steps | Performance in Artifact Removal | Performance in RSN Preservation | Best Use-Case |
|---|---|---|---|---|
| WM + CSF + Global Signal Regression | Regression of noise signals from WM, CSF, and global mean | High | High | Best all-around compromise for standard rs-fMRI |
| ICA-AROMA | Automated Removal of Motion Artifacts via Independent Component Analysis | High | Medium-High | Rapid, automated removal of motion components |
| aCompCor | Anatomical Component-Based Noise Correction | Medium-High | Medium | When physiological recordings are unavailable |
| 24 Motion Parameters | Regression of 6 rigid-body parameters and their derivatives, plus squares | Medium | High | Task-based fMRI where global signal regression is undesirable |
Detailed Experimental Protocols
Protocol 1: Benchmarking an fMRI Denoising Pipeline using HALFpipe Software
This protocol outlines a robust method for comparing the performance of different denoising strategies on resting-state fMRI (rs-fMRI) data, aiding in the selection of an optimal pipeline for your specific research context [49].
1. Prerequisites & Data Acquisition:
- Acquire rs-fMRI data (e.g., 200 volumes, TR=2500ms, voxel size=2mm³) and a high-resolution 3D T1-weighted structural scan from your participant cohort [49].
- Ensure the HALFpipe software container is installed, as it includes all necessary tools (fMRIPrep, FSL, ANTs, etc.) in a reproducible environment [49].
2. Minimal Preprocessing:
- Process the raw fMRI data through a standardized minimal preprocessing workflow. This typically includes distortion correction, motion correction, co-registration to the structural scan, and spatial normalization [49].
3. Pipeline Application:
- Apply multiple denoising pipelines in parallel to the preprocessed data. Example pipelines to compare include:
- Pipeline A: Regression of mean WM, CSF, and global signals.
- Pipeline B: Regression of 24 motion parameters.
- Pipeline C: ICA-AROMA.
- Pipeline D: aCompCor [49].
4. Quantitative Metric Computation:
- For each denoised dataset, compute a set of previously validated and novel metrics:
- Artifact Removal: Calculate the Framewise Displacement (FD) and DVARS to quantify residual motion.
- Signal Quality: Compute the temporal Signal-to-Noise Ratio (tSNR).
- RSN Identifiability: Use dual regression or a similar technique to quantify the spatial correlation of extracted components with canonical RSN templates [49].
5. Performance Evaluation:
- Propose a summary performance index that combines the scores from the different metrics into a single value. The pipeline with the highest composite score represents the optimal balance between noise removal and signal preservation for your data [49].
Protocol 2: Implementing the uSMAART System for High-Fidelity Optical Voltage Imaging
This protocol describes the setup and use of the uSMAART system for denoising GEVI signals in behaving mammals, a technique that provides unprecedented temporal resolution for cellular-level brain dynamics [51].
1. System Setup:
- GEVI Expression: Genetically deliver a sensitive GEVI (e.g., ASAP3) to specific neuronal populations (e.g., PV interneurons) in the target brain region of your animal model (e.g., mouse hippocampus) [51].
- uSMAART Hardware Configuration:
- Integrate the optical decoherence module (comprising double-layer diffusers) into the laser path before the optical fiber to eliminate mode-hopping noise caused by fiber movement.
- Set the laser to a high modulation frequency (50 or 75 kHz) to operate the photodetector in a low-noise regime [51].
- Reference Signal: Implement a separate reference channel to record the excitation light for subsequent noise cancellation in software [51].
2. Data Acquisition & Noise Cancellation:
- Record fluorescence signals from freely behaving animals (e.g., during exploration tasks) using the configured uSMAART system.
- Apply computational filtering to subtract the hemodynamic and movement artifacts. The system's high initial signal quality minimizes the need for aggressive post-processing that can distort neural signals [51].
3. Data Analysis:
- Analyze the denoised voltage signals for high-frequency oscillations (e.g., gamma waves) and cross-frequency coupling (e.g., theta-gamma coupling). The clean data allows for reliable analysis of single-trial events without the need for extensive averaging [51].
Table 2: Essential Research Reagents and Resources for Advanced Denoising
| Item Name | Type/Category | Primary Function | Example Use-Case |
|---|---|---|---|
| HALFpipe Software [49] | Software Toolbox | Standardized workflow for fMRI preprocessing and denoising pipeline comparison. | Benchmarking different confound regression strategies on rs-fMRI data. |
| NORDIC Denoising [37] | Software Algorithm | Enhances fMRI sensitivity by denoising magnitude data in the k-space domain. | Improving BOLD sensitivity in highly accelerated, high-temporal-resolution fMRI (e.g., MB-EVI). |
| TEMPO/uSMAART System [51] | Hardware & Software Platform | Ultra-sensitive fiber photometry system for recording voltage dynamics with minimal noise. | Recording high-frequency (gamma) oscillations from specific neuron classes in freely behaving mice. |
| ISG Network [50] | Deep Learning Model | Performs super-resolution on medical images using an implicit sampling and generation mechanism. | Enhancing the spatial resolution of low-resolution metabolic MRI (e.g., APTw) using a high-res structural scan as a reference. |
| CoSpine Database [52] | Open Database | Provides synchronized brain-spinal cord fMRI data for studying central nervous system interactions. | Developing and testing denoising methods that account for brain-stem and spinal cord physiological noise. |
Advanced Visualization & Analysis
Understanding the flow of information in the brain requires analyzing directed functional connectivity. Different computational methods can be applied to cleaned, high-temporal-resolution data to map these dynamics.
Key Methods for Analyzing Directional Information Flow:
- Granger Causality Analysis (GCA): A model-based method that determines if the past activity of one brain region can predict the current activity of another. It can be linear or non-linear (Kernel, NPMR) [53].
- Transfer Entropy (TE): An information-theoretic measure that quantifies the reduction in uncertainty about one region's activity given the past of another. It is model-free and can capture non-linear dependencies (binning, k-NN, permutation variants) [53].
- Convergent Cross Mapping (CCM): A method designed for non-linear deterministic systems that tests for causality by measuring how well the historical record of one variable can reconstruct the state of another [53].
Research utilizing these methods on high-temporal-resolution data has revealed a key finding: information flow in the brain is frequency-dependent. In the low-frequency band (0.01-0.08 Hz), information tends to flow from subcortical and frontal areas towards occipital and parietal regions. In contrast, this direction is often reversed in higher frequency bands [53]. This underscores the critical importance of high-quality denoising for accurately capturing the brain's complex, time-varying dynamics.
FAQs: Addressing Common Experimental Challenges
Q1: What are the most effective strategies to minimize stress and motion in awake rodent fMRI?
Effective mitigation is a multi-stage process, combining proper animal preparation with specialized hardware. Key strategies include:
- Gradual Acclimation: Implement a multi-day habituation protocol to familiarize animals with the restraint and the scanner environment (e.g., loud noises, vibrations). Studies have successfully used protocols ranging from 9 to 13 days, involving gradual exposure to manual handling, mock scanner sounds, and periods of head-fixation [54].
- Appropriate Restraint: Choose a restraint system based on experimental needs. Surgically implanted headposts provide excellent motion control and are often used with implantable RF coils for ultra-high-resolution studies [55] [56]. For longitudinal studies or vulnerable transgenic lines where surgery is undesirable, novel non-invasive restraints have been developed that do not require anesthesia for setup [54].
- Physiological Monitoring: Monitor physiological signs of stress, such as corticosterone (CORT) levels, and behavioral indicators like pupillary dilation, to validate the effectiveness of the acclimation protocol and confirm the awake state [54] [57].
Q2: How does acoustic noise from traditional fMRI sequences interfere with studies, and what are the solutions?
The loud acoustic noise generated by rapidly switching gradients in conventional GRE-EPI sequences is a major confound in awake studies.
- Impact: The noise can induce stress, alter neural responses, and trigger motion in awake subjects, compromising data quality and validity [58].
- Software Solution: Prospective motion correction strategies can be used to readjust the MRI field of view in real-time to compensate for subject motion [59].
- Hardware/Sequence Solution: Novel pulse sequences like SORDINO maintain a constant gradient amplitude while continuously changing gradient direction. This approach is inherently "silent," drastically reducing acoustic noise and making it ideal for awake animal studies and experiments requiring a quiet environment [58].
Q3: Our lab uses a 3T scanner. Can we still achieve high spatial-temporal resolution for studying small subcortical structures?
Yes, advancements in sequence design now enable high-resolution fMRI at clinical field strengths.
- Sequence Solution: Techniques like Spin-Echo based generalized Slice Dithered Enhanced Resolution (gSLIDER) increase SNR efficiency and reduce susceptibility-induced signal dropout compared to GE-EPI. When combined with a reconstruction method like Sliding Window Accelerated Temporal resolution (gSLIDER-SWAT), the effective temporal resolution can be improved approximately five-fold (e.g., from TR ~18 s to TR ~3.5 s), making it suitable for capturing the hemodynamic response in regions prone to dropout, such as the amygdala [13].
Troubleshooting Guides
Problem: Excessive Head Motion in Awake Mouse fMRI
Issue: Blurring and artifacts in images from an awake mouse study, despite using a head-fixation setup.
Solution: Implement a combination of hardware and acclimation improvements.
| Step | Procedure | Rationale & Details |
|---|---|---|
| 1. Verify Hardware | Ensure the headpost or non-invasive restraint is secure and comfortable. | For maximum stability and SNR, consider an implantable RF surface coil that also serves as a headpost. This minimizes the air-tissue interface, reducing distortion and motion [55] [56]. |
| 2. Refine Acclimation | Extend and systematize the habituation protocol. | A 5-week training scheme has been shown to reduce struggling and freezing behavior, leading to calmer mice and less motion [56]. |
| 3. Integrate Motion Tracking | Use an MR-compatible camera and computer vision algorithm. | Track user-defined body parts in real-time to quantify motion. This data can be used for prospective gating, where k-space lines are only acquired during motion-consistent periods [59]. |
Problem: Susceptibility Artifacts and Signal Dropout in Limbic Regions
Issue: Loss of signal in critical areas like the prefrontal cortex or amygdala due to magnetic field inhomogeneity.
Solution: Choose sequences and hardware that minimize T2* sensitivity.
| Step | Procedure | Rationale & Details |
|---|---|---|
| 1. Sequence Switch | Replace standard GRE-EPI with a spin-echo or quiet sequence. | gSLIDER-SWAT (SE-based) reduces vein bias and dropout [13]. SORDINO, a "zero-acquisition-delay" technique, is highly resistant to susceptibility artifacts, providing robust signal in regions near air cavities [58]. |
| 2. Hardware Upgrade | Use an implantable or cryogenic coil. | Implantable coils placed directly on the skull significantly improve B0 homogeneity and Signal-to-Noise Ratio (SNR) [55] [9]. Cryogenic coils reduce electronic noise, boosting SNR and tSNR [9]. |
Table 1: Impact of Temporal Resolution (TR) on Subject Identifiability in Resting-State fMRI
This table summarizes key findings on how the sampling rate affects the reliability of functional brain fingerprinting [6].
| Temporal Resolution (TR in seconds) | Subject Identifiability Success Rate (%) |
|---|---|
| 0.5 s | 64% |
| 0.7 s | 47% |
| 1.0 s | 44% |
| 2.0 s | 44% |
| 3.0 s | 56% |
Table 2: Performance Comparison of Advanced fMRI Sequences
This table compares novel imaging sequences against the conventional gold standard for mitigating common artifacts [13] [58].
| Sequence Type | Key Technical Feature | Primary Benefit for Awake Imaging | Example Application |
|---|---|---|---|
| GRE-EPI (Gold Standard) | Rapid gradient switching | High speed | Widely used but noisy |
| gSLIDER-SWAT | Spin-echo; Slice-dithering | High SNR at 3T; Reduces dropout | Mapping joy networks in limbic regions [13] |
| SORDINO | Data acquisition during gradient ramps; Constant gradient amplitude | Silent operation; Motion-resistant | Brain-wide connectivity in awake, behaving mice [58] |
Experimental Protocol: Awake Rodent fMRI with Head-Fixation
Objective: To acquire high-quality fMRI data from an awake, head-fixed rodent using an implantable RF coil [55] [56].
Procedure:
Animal Preparation:
- Surgery: Under anesthesia, perform a sterile surgery to affix a custom implantable RF surface coil directly onto the mouse skull. This coil acts as both the signal receiver and the headpost for fixation.
- Recovery: Allow a minimum of 1 week for surgical recovery before beginning habituation.
Habituation and Acclimation:
- Handling: Habituate animals to human handling for several days.
- Mock Scanner: Expose mice to the scanner environment in sessions of increasing duration. This includes being placed in a mock scanner cradle with reproduced gradient acoustic noises and vibrations.
- Head-Fixation: Gradually increase the duration of head-fixation within the mock setup until animals remain calm for periods exceeding the planned scan time.
Data Acquisition:
- Setup: Secure the awake animal in the MRI cradle using the implanted coil/headpost.
- Sequence Parameters: For high-resolution mapping, use parameters such as:
- Motion Monitoring: Employ an MR-compatible camera to monitor behavior and track motion in real-time [59].
Experimental Workflow and Hardware Decision Diagram
The Scientist's Toolkit: Essential Research Reagents and Materials
Table 3: Key Materials for Advanced Awake Rodent fMRI Studies
| Item | Function | Example Application in Context |
|---|---|---|
| Implantable RF Coil | Serves as both a headpost for fixation and a receiver coil, providing high SNR and reducing susceptibility artifacts by minimizing the air-tissue interface. | Essential for achieving ultra-high spatial resolution (e.g., 100x100x200 µm) in awake mouse fMRI at high magnetic fields [55] [56]. |
| Non-Invasive Restraint | A head-fixation apparatus that does not require surgery, ideal for longitudinal studies or transgenic lines vulnerable to anesthesia. | Allows for repeated awake imaging sessions without the confounding effects of surgery or repeated anesthesia [54]. |
| SORDINO Sequence | A transformative fMRI sequence that is silent, sensitive, and resistant to motion and susceptibility artifacts. | Enables fMRI in awake, behaving mice during tasks where acoustic noise would normally be a confound, such as social interaction experiments [58]. |
| gSLIDER-SWAT Sequence | A high spatial-temporal resolution spin-echo sequence that reduces signal dropout and improves SNR at 3T. | Critical for mapping BOLD responses in subcortical and limbic regions (e.g., amygdala) prone to artifacts with standard EPI [13]. |
| MR-Compatible Optical Camera | Provides real-time video feedback and motion tracking of the subject inside the magnet bore. | Enables prospective motion gating and behavioral monitoring, allowing data acquisition only during periods of minimal movement [59]. |
Frequently Asked Questions
1. How does the choice of TR directly impact subject identifiability in functional connectivity fingerprinting? The repetition time (TR) significantly influences the temporal resolution of your fMRI data, which in turn affects the reliability of functional connectivity fingerprints. Research shows that subject identifiability—the ability to correctly match a functional connectivity profile to a specific individual—varies with TR. One study found that while identifiability was successful across a range of TRs (from 0.5s to 3s), the highest rates were observed at the shortest (TR=0.5s, 64% identifiability) and longest (TR=3s, 56% identifiability) values tested [6]. This suggests a complex, non-linear relationship where both very high and lower temporal resolutions can be beneficial, potentially due to how different TRs handle physiological noise aliasing.
2. Is it better to have a larger sample size or a longer scan time per participant? This is a fundamental trade-off in study design. Evidence indicates that for a fixed total scanning resource (e.g., total minutes on a scanner), prediction accuracy in brain-wide association studies increases with the total scan duration, calculated as sample size multiplied by scan time per participant [60]. Initially, sample size and scan time are somewhat interchangeable; however, diminishing returns are observed for longer scan times (e.g., beyond 20-30 minutes) [60]. When accounting for overhead costs like participant recruitment, longer scans (e.g., 30 minutes) can be more cost-effective for achieving a given prediction accuracy than simply scanning more people for shorter durations [60].
3. Which brain networks contribute most to a reliable functional connectivity fingerprint? The contribution of brain networks to a person's unique fingerprint can depend on your acquisition protocol. Analysis reveals that when using a fixed TR, associative networks like the default mode network (DMN) and subcortical (SUB) network tend to provide the most identifiable connections [6]. However, when integrating data acquired from different TRs, the networks that contribute most to identifiability shift, with sensory-motor regions (e.g., somato-motor, visual) becoming more influential [6]. This highlights that the "ideal" network for fingerprinting may be context-dependent.
4. What are the practical lower limits for TR in a fingerprinting study? Choosing a very short TR requires careful consideration of technical and physical constraints. To achieve whole-brain coverage with a TR of 3.5 seconds or less, you will likely need to employ advanced accelerated acquisition techniques, such as multiband (simultaneous multi-slice) imaging and in-plane acceleration (e.g., GRAPPA) [13]. These methods allow you to acquire multiple slices simultaneously, dramatically reducing the TR needed to cover the entire brain. Remember that a shorter TR also leads to a higher number of data points per unit time, which can improve the statistical power of connectivity estimates but may come at the cost of lower signal-to-noise ratio per volume.
Troubleshooting Guides
Problem: Low Subject Identifiability Score
- Symptoms: Your model fails to reliably match functional connectivity profiles to the correct individuals across scanning sessions.
- Potential Causes & Solutions:
- Cause 1: Suboptimal Temporal Resolution. Your chosen TR may not be capturing the dynamic information needed for a unique fingerprint.
- Solution: If you are using a medium-length TR (e.g., 1-2s), consider piloting a protocol with a shorter TR (e.g., 0.5s) or a longer TR (e.g., 3s), as these extremes have shown higher identifiability in some studies [6].
- Cause 2: Insufficient Total Scan Duration. The functional connectivity estimates may be too noisy.
- Solution: Increase the total scan duration. For resting-state scans, evidence strongly suggests that scan times of at least 20-30 minutes are more cost-effective for achieving high prediction performance than shorter (e.g., 10-minute) scans [60].
- Cause 3: Over-reliance on a Single Network.
- Solution: Ensure your analysis incorporates connectivity from multiple brain networks. Specifically, check the contribution of both associative (e.g., DMN, fronto-parietal) and sensory-motor networks, as their identifiability strength can vary [6].
- Cause 1: Suboptimal Temporal Resolution. Your chosen TR may not be capturing the dynamic information needed for a unique fingerprint.
Problem: Poor Functional Connectivity Measurement reliability
- Symptoms: High variability in connectivity strength between the same two regions across repeated scans of the same individual.
- Potential Causes & Solutions:
- Cause 1: Low Signal-to-Noise Ratio (SNR).
- Solution: Use a sequence optimized for SNR. Consider sequences like gSLIDER, which can more than double the SNR efficiency compared to traditional spin-echo EPI [13]. Furthermore, ensure your voxel size is as small as feasible without sacrificing too much SNR, and consider increasing the number of excitations (NEX) if your sequence allows it, as SNR is proportional to √NEX [61].
- Cause 2: Physiological Noise.
- Solution: The effect of physiological noise (e.g., from heartbeat and respiration) is aliased into your fMRI signal and is highly dependent on TR. If you are observing unexpected identifiability patterns across TRs, this may be a contributing factor [6]. Employ physiological monitoring and use tools for noise correction (e.g., RETROICOR, COMPCOR) during preprocessing.
- Cause 1: Low Signal-to-Noise Ratio (SNR).
Experimental Data & Protocols
Table 1: Impact of Temporal Resolution (TR) on Subject Identifiability
Data derived from a resting-state fMRI fingerprinting study on 20 healthy volunteers [6].
| TR (seconds) | Subject Identifiability (%) | Key Contributing Networks (at this TR) |
|---|---|---|
| 0.5 | 64% | Subcortical (SUB), Default Mode (DMN) |
| 0.7 | 47% | Not Specified |
| 1.0 | 44% | Not Specified |
| 2.0 | 44% | Not Specified |
| 3.0 | 56% | Fronto-Parietal, Dorsal Attention, Visual (when integrating across TRs) |
Table 2: Trade-off Analysis: Sample Size vs. Scan Time
Summary of findings on the interchangeability of sample size and scan duration for phenotypic prediction accuracy in BWAS [60].
| Scenario | Impact on Prediction Accuracy | Cost-Efficiency Implication |
|---|---|---|
| Double Sample Size (Fixed scan time) | Increases, but with diminishing returns | High upfront cost per additional participant |
| Double Scan Time (Fixed sample size) | Increases, but with strong diminishing returns beyond ~30 minutes | More efficient use of a small, hard-to-recruit cohort |
| Increase Total Scan Duration (N × T) | Logarithmic increase; most effective initial strategy | Allows flexibility in design |
| Recommended Optimal Resting-State Scan Time | ~30 minutes | Can yield ~22% cost savings over 10-minute scans |
Detailed Methodology: gSLIDER-SWAT for High-Resolution fMRI
This protocol enables high spatial-temporal resolution fMRI at 3T, addressing SNR and dropout issues in limbic regions relevant to fingerprinting [13].
- Background: Standard GE-EPI fMRI suffers from signal dropout in regions like the amygdala and orbitofrontal cortex. The gSLIDER sequence uses a spin-echo basis and slice-dithered acquisitions to boost SNR efficiency and reduce dropout.
- Acquisition Parameters:
- Sequence: Spin-echo based gSLIDER.
- Spatial Resolution: 1.0 mm³ isotropic.
- Original TR: 18 s (incompatible with most paradigms).
- Reconstruction: Sliding Window Accelerated Temporal resolution (SWAT).
- Effective TR after SWAT: ~3.5 s.
- Key Outcome: gSLIDER provided an approximate 2x gain in temporal SNR (tSNR) over traditional spin-echo EPI, facilitating robust detection of subcortical activity in regions typically affected by signal dropout [13].
Detailed Methodology: Establishing Identifiability Across TRs
This protocol describes the analysis workflow for assessing how TR affects functional connectivity fingerprinting [6].
- Data Acquisition: Acquire resting-state fMRI data from participants (N=20 in the source study) using a sequence capable of varying TRs (e.g., 0.5s, 0.7s, 1s, 2s, 3s).
- Preprocessing: Standard pipeline including realignment, normalization, and nuisance regression (e.g., for motion, white matter, and CSF signals).
- Connectivity Matrix Calculation: Extract time series from a predefined brain atlas and compute a functional connectivity matrix for each subject at each TR (e.g., using Pearson correlation).
- Identifiability Analysis:
- In a "test-retest" framework, try to match a subject's connectivity profile from one session (or TR) against a database of profiles from another session (or TR).
- Identifiability is calculated as the percentage of correct subject matches across the entire sample.
- Network Contribution: Use intraclass correlation (ICC) to determine which functional connections or networks are most stable and identifiable for a given TR.
The Scientist's Toolkit: Essential Research Reagents & Materials
Table 3: Key Solutions for Functional Connectivity Fingerprinting
| Item | Function / Rationale |
|---|---|
| High-Temporal Resolution fMRI Sequence | Enables shorter TRs for capturing rapid brain dynamics. Often requires multiband acceleration. |
| High-SNR fMRI Sequence (e.g., gSLIDER, SE) | Improves data quality in subcortical and limbic regions prone to signal dropout, crucial for capturing full network fingerprints [13]. |
| Physiological Monitoring System (pulse oximeter, respiratory belt) | Records cardiac and respiratory signals, allowing for retrospective correction of physiological noise in the BOLD signal. |
| Multiband Acceleration | Allows simultaneous acquisition of multiple slices, dramatically reducing TR for whole-brain coverage. |
| Field Map Scans | Measures magnetic field inhomogeneities, enabling correction of geometric distortions in echo-planar imaging (EPI) data. |
| T1-Weighted Anatomical Scan (e.g., MPRAGE) | Provides high-resolution structural reference for co-registration and anatomical localization of functional data. |
Visual Workflows and Relationships
Diagram 1: Factors influencing identifiability.
Diagram 2: The sample size vs. scan time decision tree.
FAQ: Why does increasing speed reduce my SNR?
Increasing acquisition speed in fMRI is typically achieved by accelerating the sampling of k-space data, for example, through techniques like parallel imaging or simultaneous multi-slice (SMS) imaging. These methods undersample k-space, which reduces the amount of data collected per image. Since the signal is a product of the data collected from the entire imaging volume, less data directly translates to a lower signal intensity. The noise, originating from the subject's body and the scanner's electronics, remains relatively constant. The result is a lower Signal-to-Noise Ratio (SNR), a fundamental trade-off known as the SNR penalty [37] [62].
FAQ: What is the difference between SNR and CNR?
It is crucial to distinguish between these two metrics, as a high SNR does not guarantee a successful experiment.
- Signal-to-Noise Ratio (SNR) is a measure of the strength of your acquired signal relative to the background noise. A high SNR means a clear, low-noise image [63].
- Contrast-to-Noise Ratio (CNR) is a measure of the difference in signal between two relevant tissue states (e.g., active vs. resting brain tissue) relative to the background noise. For fMRI, the functional CNR (fCNR) is defined as the product of the evoked fractional BOLD signal change (ΔS/S) and the temporal SNR (tSNR) [9]. A high CNR means you can reliably detect the physiological change you are trying to measure.
The Critical Insight: Your effective temporal resolution (ETR)—the smallest time delay you can reliably discern between neural events—is determined by your CNR, not just your sampling rate (TR). A study using a dynamic phantom demonstrated that even with a fast TR of 600 ms, a low CNR could result in an ETR longer than the TR itself. In other words, you might be sampling quickly, but the data is too noisy to detect rapid, small changes [64].
Strategies for Mitigating the SNR Penalty
A multi-faceted approach is required to overcome the SNR challenge at high speeds. The following table summarizes key optimization areas.
| Optimization Strategy | Key Parameters & Techniques | Primary Effect |
|---|---|---|
| Magnetic Field Strength [9] | Use of ultra-high fields (≥7T) | Supra-linear increase in BOLD contrast and SNR |
| Gradient Performance [9] | High gradient strength (mT/m) and slew rate (T/m/s) | Enables faster k-space traversal, reducing TE and TR |
| Radiofrequency Coils [9] | Multi-channel arrays, cryogenic cooling, implantable coils | Directly increases local SNR and tSNR |
| Sequence Acceleration [37] [62] | Multi-band (SMS), GRAPPA, Compressed Sensing, CAIPIRINHA | Increases speed without a √R SNR penalty (ideal) |
| Sequence Design [13] [37] | Multi-echo acquisition, SE-EPI vs. GE-EPI, TR optimization | Improves signal specificity and maximizes sampling rate |
Hardware and System Optimization
The foundation for high-SNR, high-speed imaging is built on the scanner hardware.
- Ultra-High Magnetic Fields: Moving from 3T to 7T and beyond provides a more than linear increase in the functional CNR (fCNR), directly countering the inherent weakness of the BOLD signal [9].
- High-Performance Gradients: Modern gradients with high peak strength and slew rates allow for extremely rapid encoding, which shortens the echo time (TE) and repetition time (TR). This minimizes signal loss due to T2* decay and enables more averages per unit time [9].
- Advanced RF Coils: The choice of the receive coil is critical.
- Multi-channel array coils provide high sensitivity and enable parallel imaging acceleration [9].
- Cryogenic coils significantly reduce electronic noise, with reports of ~3x gains in SNR and ~1.8x gains in tSNR at 9.4T [9].
- Implantable coils offer the highest possible SNR for preclinical applications by placing the detector directly on the region of interest [9].
Acquisition Protocol and Sequence Design
The following diagram illustrates the strategic decision workflow for optimizing acquisition protocols.
Advanced Acceleration Sequences:
- Multi-Band Echo-Volumar Imaging (MB-EVI): This hybrid sequence combines simultaneous multi-slab (multi-band) encoding with fast 3D echo-volumar readouts (EVI). It achieves very high acceleration factors by exploiting acceleration in both the slice and in-plane dimensions, enabling sub-second temporal resolution with millimeter spatial resolution at 3T [37].
- gSLIDER-SWAT: This spin-echo based technique uses a generalized Slice Dithered Enhanced Resolution (gSLIDER) acquisition to increase SNR efficiency. Its Sliding Window Accelerated Temporal resolution (SWAT) reconstruction then recaptures high-frequency information, providing a nominal 5-fold increase in temporal resolution without the full SNR penalty of a physically shorter TR [13].
- Compressed Sensing (CS) and Low-Rank Methods: These techniques allow for prospective undersampling of k-space beyond what parallel imaging alone can achieve. Reconstruction algorithms like Low-Rank Plus Sparse (L+S) can then recover the images, providing another path to higher speeds [62].
Parameter Optimization:
- Multi-echo fMRI: Acquiring multiple echoes after a single excitation and combining them (e.g., via weighted averaging) has been shown to improve CNR and the Effective Temporal Resolution (ETR), particularly in regions with short T2* like the basal ganglia [64].
- Echo Time (TE): TE should be optimized to approximate the T2* of the tissue of interest to maximize BOLD contrast.
- Voxel Size: Reducing voxel size improves spatial resolution but directly reduces SNR. The choice is a balance between the spatial and temporal resolution requirements of the experiment.
Post-Processing and Reconstruction
The final line of defense against the SNR penalty is advanced reconstruction and processing.
- Denoising Algorithms: Techniques like NORDIC denoising can be applied to already-acquired data to suppress noise without introducing significant image blurring, thereby enhancing functional sensitivity [37].
- Advanced Reconstruction for Accelerated Data: As mentioned, methods like L+S decomposition are highly effective for reconstructing prospectively undersampled data. The model separates the dynamic image series into a low-rank background (L) and a sparse component (S) containing the dynamic changes, enabling clean recovery of the BOLD signal from highly accelerated acquisitions [62].
The Scientist's Toolkit: Essential Reagents & Materials
Table: Key Experimental Components for High-Speed fMRI
| Item | Function in the Experiment |
|---|---|
| High-Performance Gradients | Enable ultra-fast k-space traversal, minimizing TE and TR for a given resolution [9]. |
| Multi-Channel RF Array Coil | Provides high sensitivity for signal reception and is a prerequisite for parallel imaging acceleration [9]. |
| Cryogenic Cooling System | Cools the RF coil electronics to reduce thermal noise, providing a direct boost to SNR and tSNR [9]. |
| Dynamic Phantom | Provides a "ground-truth" signal with controllable onset delays, allowing for precise quantification of a sequence's Effective Temporal Resolution (ETR) under different SNR/CNR conditions [64]. |
| Multi-Echo EPI Sequence | A pulse sequence that acquires data at several T2*-weighted echoes, allowing for optimal echo combination or TE analysis to maximize BOLD CNR [64]. |
| Compressed Sensing Reconstruction Software | Computational tools that implement algorithms (e.g., L+S, k-t SPARSE) to reconstruct images from highly undersampled k-space data [62]. |
Success in high-temporal-resolution fMRI requires a holistic strategy that moves beyond simply making the TR shorter. The key is to recognize that the Effective Temporal Resolution (ETR) is governed by the Contrast-to-Noise Ratio (CNR). By strategically leveraging ultra-high field magnets, advanced RF coils, innovative pulse sequences like MB-EVI and gSLIDER-SWAT, and powerful reconstruction algorithms, researchers can overcome the inherent SNR penalty and unlock the brain's dynamic processes at unprecedented speeds.
Frequently Asked Questions (FAQs)
FAQ 1: What are the primary computational bottlenecks when moving from conventional to high temporal resolution fMRI? The shift to high temporal resolution dramatically increases data velocity (the speed of data generation) and volume (the total amount of data) [65]. The main bottlenecks are:
- Real-time Data Ingestion: The scanner generates data streams at rates that can overwhelm traditional storage and transfer systems [66] [65].
- Stream Processing Demands: Reconstruction algorithms must process these continuous data streams with low latency to be useful for real-time analysis [66].
- Scalable Storage: High-resolution time-series produce massive datasets that require distributed, fault-tolerant storage systems for efficient access and management [66] [65].
FAQ 2: How can we overcome the inherent trade-off between high spatial and high temporal resolution in fMRI? Advanced acquisition and reconstruction techniques are key. For example, the gSLIDER-SWAT method uses a spin-echo based sequence (gSLIDER) to achieve high spatial resolution with improved signal-to-noise ratio. To address its initially long repetition time (TR), a novel Sliding Window Accelerated Temporal resolution (SWAT) reconstruction is applied, providing up to a five-fold increase in temporal resolution without sacrificing spatial detail [13]. This demonstrates how innovative computational reconstruction can push beyond traditional hardware limits.
FAQ 3: What are common data integrity issues in real-time processing, and how can they be mitigated? The veracity, or reliability, of data is a major challenge [65]. Issues include:
- Incomplete Data: Missing data points due to transmission errors.
- Data Format Inconsistencies: The variety of data types from different sources can lead to integration problems [65].
- Solution: Implement rigorous data validation and cleaning processes as part of the streaming data pipeline. Techniques like parallel processing and automated data quality checks are essential before analysis [65].
Troubleshooting Guide: Common Scenarios and Solutions
Scenario 1: Real-Time Processing Latency During fMRI Acquisition
- Problem: Delays in data reconstruction and processing prevent real-time feedback.
- Diagnosis: The data ingestion and stream processing framework cannot keep up with the velocity of incoming data [66] [65].
- Solution: Implement a dedicated stream processing engine.
- Technology: Utilize frameworks like Apache Flink or Apache Storm, which are designed for low-latency, distributed processing of continuous data streams [66].
- Protocol: Integrate these engines into a pipeline that directly consumes data from the scanner. Flink's "shared-nothing" architecture, for instance, can significantly reduce memory consumption and improve processing speed [66].
Scenario 2: Inability to Handle Massive Reconstructed Datasets
- Problem: Storing and managing the large volumes of reconstructed fMRI data is slow and unreliable.
- Diagnosis: Traditional storage systems are not designed for the volume and horizontal scalability required by modern high-resolution fMRI [66] [65].
- Solution: Adopt a distributed NoSQL database.
Scenario 3: Poor Temporal Resolution Despite Fast Acquisition
- Problem: Even with accelerated acquisition protocols, the effective temporal resolution for analysis remains low.
- Diagnosis: The reconstruction and analysis workflow may not be capturing high-frequency information present in the signal [8] [13].
- Solution: Employ advanced reconstruction models that leverage high-frequency data.
- Technology: Custom reconstruction algorithms like SWAT or updated hemodynamic response models [8] [13].
- Protocol: As demonstrated in gSLIDER-SWAT, use a sliding-window reconstruction technique on the acquired data encodings to synthetically increase the temporal sampling rate, thereby recapturing high-frequency information for analysis [13].
Experimental Protocols & Data
Protocol: Validating a High Spatiotemporal Resolution fMRI Technique
This protocol is adapted from a study that implemented and validated the gSLIDER-SWAT method at 3T [13].
Data Acquisition:
- Sequence: Spin-echo (SE) based generalized Slice Dithered Enhanced Resolution (gSLIDER).
- Parameters: FOV = 220 × 220 × 130 mm³; resolution = 1 × 1 × 1 mm³; TR = 18 s (effective TR of 3.6 s after SWAT reconstruction).
- Comparison Scans: Acquire standard SE-EPI and GE-EPI scans with matched parameters for quality comparison.
Computational Reconstruction (gSLIDER-SWAT):
- Process: Apply the Sliding Window Accelerated Temporal resolution (SWAT) reconstruction algorithm to the raw gSLIDER data.
- Output: This generates a time-series with a nominal 5-fold higher temporal resolution (TR ~3.6 s).
Validation Experiment:
- Paradigm: Use a classic hemifield checkerboard visual stimulus.
- Procedure: Increase the stimulus presentation frequency to the Nyquist frequency of the gSLIDER sequence to rigorously test the temporal resolution.
- Analysis: Perform a General Linear Model (GLM) analysis and Independent Component Analysis (ICA) on the reconstructed data to demonstrate robust activation in the primary visual cortex and improved signal detection.
The table below summarizes key technologies for managing large, real-time datasets, as identified in the literature [66].
Table 1: Technologies for Real-Time Big Data Management in Research
| Technology Category | Specific Tool | Primary Function | Key Advantage |
|---|---|---|---|
| Data Flow Management | Apache Kafka | Distributed message passing for continuous data | High fault tolerance and scalable data ingestion [66] |
| Real-Time Processing | Apache Flink | Stream processing engine | Reliable low-latency analysis and high availability [66] |
| Real-Time Processing | Apache Storm | Distributed real-time processing | Effective for anomaly detection in live data streams [66] |
| Real-Time Analysis | Apache Spark Streaming | Processing continuous data streams | High-performance distributed computing engine [66] |
| Database | Cassandra | Distributed NoSQL storage | Horizontal scalability and efficient handling of data flows [66] |
Workflow Diagrams
gSLIDER-SWAT Reconstruction Pipeline
Real-Time fMRI Data Processing Architecture
The Scientist's Toolkit
Table 2: Essential Research Reagents & Computational Solutions
| Item / Solution | Function / Purpose |
|---|---|
| gSLIDER-SWAT Sequence | An acquisition and reconstruction protocol to achieve high spatiotemporal resolution (≤1mm³, TR~3.6s) fMRI at 3T, reducing large vein bias and signal dropout [13]. |
| Apache Kafka | A distributed platform for handling real-time data feeds; acts as a reliable, scalable "central nervous system" for ingesting high-velocity fMRI data streams [66]. |
| Apache Flink | A stream processing engine that performs low-latency, complex computations (like real-time reconstruction or analysis) on continuous data flows [66]. |
| Cassandra Database | A NoSQL distributed storage system that provides fault-tolerant, scalable storage for the massive volumes of data produced by high-resolution fMRI studies [66]. |
| Incremental Learning Models | Machine learning frameworks that update their models with new data in real-time without full retraining, crucial for adapting to changing data during long experiments [66]. |
Benchmarking Performance: Validating New Methods Against Established Standards and Clinical Applications
Frequently Asked Questions (FAQs)
Q1: What is temporal Signal-to-Noise Ratio (tSNR) and why is it critical for my fMRI experiment? Temporal Signal-to-Noise Ratio (tSNR) is a measure of the stability of an fMRI time series, calculated as the mean of the signal divided by its standard deviation over time [67]. It is critical because it directly determines your experiment's statistical power. A higher tSNR allows for more reliable detection of smaller BOLD signal changes. For instance, with a tSNR of 50, detecting a 2% signal change requires about 350 scan volumes, but detecting a finer 1% change requires about 860 volumes [67]. Its reproducibility can be poor across sessions, so it may not be a reliable standalone quality metric [68].
Q2: How does BOLD sensitivity differ from tSNR? While tSNR measures pure time-series stability, BOLD sensitivity specifically quantifies an experiment's ability to detect the task-related BOLD signal change. It is influenced by tSNR but also depends on other factors like the echo time (TE) and the magnitude of the underlying physiological response [69]. A sequence can have good tSNR but suboptimal BOLD sensitivity if the TE is not matched to the T2* of the tissue [3] [69].
Q3: What is subject identifiability (or fingerprinting) and can it interfere with my group analysis? Subject identifiability, or fingerprinting, is the ability to correctly identify the same subject from different fMRI scans based on their unique functional connectivity (FC) patterns [70]. It is a powerful demonstration of individual brain uniqueness. However, it can unintentionally inflate results in machine learning studies if different scans from the same subject are treated as independent data points in training and test sets, allowing the algorithm to "memorize" subjects rather than learn generalizable features [70].
Q4: What is the relationship between voxel size, tSNR, and required scan duration? tSNR decreases as voxel volume decreases [67]. This relationship is highly non-linear. To maintain detection power at higher spatial resolutions, you must significantly increase your scan duration. For example, imaging at columnar resolution (~1mm) with a 1% effect size at 3T can require 40 minutes for a tSNR of 30, but only 10 minutes for a tSNR of 60 [67].
Q5: Does parallel imaging (e.g., SENSE, GRAPPA) help or hurt my tSNR and BOLD sensitivity? Parallel imaging shortens the readout time, reducing susceptibility artifacts and signal dropout [69]. While it causes a penalty in image SNR, the loss in temporal SNR (tSNR) and BOLD sensitivity is often less severe than predicted because physiological noise becomes a dominant factor [71] [69]. For single-echo acquisitions, BOLD sensitivity may drop with acceleration, but when combined with multi-echo sequences (ME-EPI), the optimized combination of echoes can recover this loss, maintaining robust detection power [69].
Troubleshooting Guides
Low tSNR and BOLD Sensitivity
Problem: Your activation maps are weak or non-existent despite a seemingly valid experimental design.
| Possible Cause | Diagnostic Checks | Corrective Actions |
|---|---|---|
| Excessive Physiological Noise | Check time series for strong periodic fluctuations. Use tools like RETROICOR for retrospective correction [3]. | Implement physiological noise monitoring (cardiac, respiratory) during acquisition for retrospective correction [71]. |
| Suboptimal Acquisition Parameters | Verify that TE is close to the T2* of target tissue (~30ms for 3T GM) [3] [72]. | Use a multi-echo EPI (ME-EPI) sequence to combine echoes for optimal T2* weighting and denoising [69]. |
| Insufficient Scan Duration | Calculate your current tSNR and the expected effect size. | Increase the number of scan volumes/time points. Reference the tSNR/scan duration relationship to estimate needed time [67]. |
| Hardware Limitations | Compare tSNR in central vs. peripheral brain regions. Low SNR with standard head coils. | Use a multi-channel array coil (e.g., 32-channel) for a fundamental boost in intrinsic SNR [67] [68]. |
Inflated Classification Results in Predictive Modeling
Problem: Your machine learning model achieves surprisingly high accuracy in predicting phenotypes or clinical status from fMRI data.
| Possible Cause | Diagnostic Checks | Corrective Actions |
|---|---|---|
| Data Leakage via Identifiability | Audit your training and test splits. Ensure no subject has scans in both sets. | Strictly ensure all scans from a single subject are contained entirely within either the training set or the test set [70]. |
| Use of Dynamic FC (dFC) without Proper Care | Check if multiple FC matrices from a single subject's scan are treated as independent. | If using dFC, ensure all windows from one subject reside in the same data split (train or test) to prevent leakage [70]. |
Poor Reproducibility of tSNR Measurements
Problem: Your tSNR values vary widely across repeated scans on the same subject, making it an unreliable QA metric.
| Possible Cause | Diagnostic Checks | Corrective Actions |
|---|---|---|
| Scanner Instability & Subject Factors | Check for gradient heating effects over long sessions. Monitor subject positioning and movement. | Standardize subject positioning in the coil, especially with multi-channel arrays whose SNR profile is highly variable [68]. |
| Confounding from Post-processing | Note the timing between B0 field map and fMRI acquisition; greater delays increase variability. | Acquire B0 field maps immediately before or after each fMRI run, rather than once per session [68]. |
Quantitative Data Reference
Table 1: Relationship Between tSNR, Effect Size, and Required Scan Duration
This table summarizes the theoretical and experimental relationships between temporal SNR, the magnitude of the BOLD signal change, and the number of time points required for detection at two different statistical thresholds. Data adapted from [67].
| Temporal SNR (tSNR) | BOLD Effect Size | Required Time Points (N) for P < 0.05 | Required Time Points (N) for P < 5e-10 |
|---|---|---|---|
| 30 | 2% | ~100 | ~350 |
| 50 | 2% | < 50 | ~250 |
| 50 | 1% | ~200 | ~860 |
| 60 | 1% | ~140 | ~600 |
| 75 | 0.5% | ~110 (P=0.05) | N/A |
Table 2: Subject Identifiability Accuracy with Different FC Methods
This table compares the fingerprinting accuracy of different functional connectivity methods across datasets, highlighting the performance of edge-centric FC. Data synthesized from [70] [73].
| Analysis Method | Dataset | Identifiability (Fingerprinting) Accuracy |
|---|---|---|
| Nodal FC (nFC) | PNC (3,843 subjects) | 62.5% |
| Nodal FC (nFC) with Preprocessing | PNC (3,843 subjects) | 97.3% |
| Edge-Centric FC (eFC) | Multiple Datasets | Improved over nFC |
| Edge-Centric FC (eFC) with Principal Components | Multiple Datasets | Further Improved |
Key Experimental Protocols
Protocol: Estimating Required Scan Duration
Objective: To determine the minimum scan duration needed to detect a specific BOLD effect size in your experiment.
Methodology:
- Estimate Baseline tSNR: Calculate the temporal SNR from a pilot resting-state or task-based scan using the formula: tSNR = μ / σ, where μ is the mean signal and σ is the standard deviation of the time series in a relevant brain region [67].
- Define Effect Size: Based on prior literature or pilot data, estimate the expected percent BOLD signal change (
eff). - Set Statistical Threshold: Choose your desired significance level (P-value).
- Apply Theoretical Model: The required number of time points (N) can be derived from the correlation coefficient (
cc) relationship [67]:cc = tSNR * (eff / 2)- The significance of the correlation coefficient is then given by converting
ccto a t-statistic:t = cc * √(N-2) / √(1-cc²), which can be solved for N given the critical t-value for your chosen P-value [67].
Protocol: Conducting a Subject Identifiability Analysis
Objective: To validate the uniqueness of functional connectivity maps and test for potential data leakage.
Methodology:
- Data Preprocessing: Process 4D fMRI volumes. This includes motion correction, spatial normalization to a standard space (e.g., MNI), and bandpass filtering (typically 0.01-0.15 Hz) to reduce low-frequency drift and high-frequency noise [70].
- Extract Timeseries: Using a predefined atlas (e.g., Power264), extract the mean BOLD timeseries from each Region of Interest (ROI) [70].
- Compute Connectivity: Calculate the Pearson correlation between the timeseries of every pair of ROIs to create a subject-specific Functional Connectivity (FC) matrix. Vectorize the upper triangle of this symmetric matrix for analysis [70].
- Calculate Similarity: For every pair of scans in the dataset, compute the cosine similarity between their vectorized FC matrices using the formula: sim(a,b) = (aᵀb) / (||a||₂ ||b||₂) [70].
- Assess Identifiability: A scan pair from the same subject is correctly identified if their cosine similarity is higher than the similarity with all other scans from other subjects. The overall identifiability accuracy is the percentage of subjects correctly identified in this manner [70].
Visualizations
fMRI Quality Metric Relationships
Subject Identifiability Analysis Workflow
The Scientist's Toolkit: Essential Research Reagents & Materials
Table 3: Key Solutions for fMRI Research
| Item | Function & Purpose in Research |
|---|---|
| Multi-Channel Array Coils | Increases the intrinsic Signal-to-Noise Ratio (SNR) by using multiple, specialized receiver elements. This provides a fundamental boost to tSNR, especially at higher field strengths [67] [68]. |
| Multi-Echo EPI (ME-EPI) Sequence | Acquires multiple images at different echo times (TEs) after a single radiofrequency excitation. This allows for optimized combination of echoes to maximize BOLD contrast and mitigate signal dropout, protecting tSNR and BOLD sensitivity [69]. |
| Physiological Monitoring Equipment | Records cardiac and respiratory rhythms during fMRI acquisition. This data is crucial for post-processing tools (e.g., RETROICOR) that model and remove physiological noise from the BOLD time series, thereby improving tSNR [3] [71]. |
| Parallel Imaging (SENSE/GRAPPA) | Accelerates image acquisition by undersampling k-space, shortening the readout duration. This reduces geometric distortions and signal dropout from susceptibility artifacts, though it introduces a trade-off with thermal noise [71] [69]. |
| High-Level Brain Atlases | Provides predefined parcellations of the brain into Regions of Interest (ROIs). Essential for extracting BOLD timeseries for functional connectivity analysis and calculating metrics like identifiability [70] [74]. |
| Processing Software (SPM, FSL, AFNI) | Comprehensive software suites for preprocessing (motion correction, normalization) and statistical analysis of fMRI data. They implement general linear models (GLM) and connectivity analyses central to the field [70] [68]. |
Technical Support Center
Frequently Asked Questions (FAQs)
Q1: What is the primary technological advantage of gSLIDER-SWAT over traditional SE-EPI for high-resolution fMRI?
gSLIDER-SWAT combines two innovative technologies to overcome fundamental limitations of traditional Spin-Echo Echo Planar Imaging (SE-EPI). The generalized Slice Dithered Enhanced Resolution (gSLIDER) component increases signal-to-noise ratio (SNR) efficiency by utilizing sub-voxel shifts along the slice direction, while the Sliding Window Accelerated Temporal resolution (SWAT) reconstruction provides up to a five-fold improvement in effective temporal resolution. This combined approach enables high spatial-temporal resolution fMRI (≤1mm³) at 3T field strength, which is particularly valuable for imaging subcortical structures prone to signal dropout with conventional methods [13] [35].
Q2: In which brain regions does gSLIDER-SWAT demonstrate the most significant imaging improvements?
gSLIDER-SWAT shows particularly notable benefits in frontotemporal-limbic regions such as the amygdala, hippocampus, and ventral striatum. These areas are especially vulnerable to susceptibility-induced signal dropout and geometric distortions with standard Gradient Echo (GE) techniques due to their proximity to air-tissue interfaces. The spin-echo based approach of gSLIDER reduces these artifacts, enabling more reliable functional imaging of structures essential for emotion processing, memory, and reward [13] [35].
Q3: What are the practical trade-offs when implementing high multiband acceleration factors in fMRI sequences?
While multiband acceleration enables shorter TRs and higher resolution, excessive acceleration factors introduce several challenges:
- Increased signal dropout in medial and ventral brain regions
- Slice-leakage effects where signal from one slice appears in another
- Reduced temporal SNR due to shorter TRs limiting T1 recovery
- Motion-sensitive artefacts that may interact non-linearly with head movement Optimal multiband factors balance acceleration gains with these potential drawbacks, and should be determined through pilot studies for specific research applications [34].
Q4: How does gSLIDER-SWAT address the temporal resolution limitations of basic gSLIDER acquisition?
The standard gSLIDER acquisition requires a long repetition time (~18 seconds) for spins to properly relax between shots, making it incompatible with most fMRI paradigms. gSLIDER-SWAT incorporates a novel reconstruction method that utilizes temporal information within individual gSLIDER RF encodings through a sliding window approach, effectively reducing the TR to approximately 3.5 seconds while maintaining the high spatial resolution benefits of gSLIDER [13] [35].
Troubleshooting Guides
Issue: Poor Signal in Medial Temporal Lobe Regions
Problem: Despite using high-resolution protocols, signal dropout persists in amygdala and hippocampal regions.
Solution:
- Confirm sequence parameters: Ensure TE is optimized for T2 weighting at your field strength (approximately 69 ms for 3T) [13]
- Verify coil positioning: Use dedicated multi-channel array coils (64-channel provides better SNR than 32-channel) [13] [9]
- Consider B0 shimming: Implement higher-order shimming specifically optimized for medial temporal regions
- Evaluate gSLIDER factors: Higher gSLIDER factors (e.g., factor 5) provide better slice encoding but require longer acquisition; balance based on your resolution needs [13]
Issue: Inadequate Temporal Resolution for Event-Related Designs
Problem: The native gSLIDER TR of ~18 seconds is too slow for capturing rapid cognitive processes.
Solution:
- Activate SWAT reconstruction: Implement the sliding window reconstruction to achieve effective TR of ~3.5 seconds [13]
- Validate with simple paradigms: First test with basic visual or motor paradigms to confirm temporal response characteristics
- Optimize stimulus timing: Design event-related paradigms with ISIs that account for the hemodynamic response function while maximizing detection power [75]
Performance Comparison Data
Table 1: Quantitative Performance Metrics: gSLIDER-SWAT vs. Traditional Sequences
| Performance Metric | gSLIDER-SWAT | Traditional SE-EPI | Standard GE-EPI | Measurement Context |
|---|---|---|---|---|
| Spatial Resolution | ≤1 mm³ isotropic | ~2-3 mm³ | ~2-3 mm³ | High-resolution mapping of cortical layers and subnuclei [13] |
| Temporal Resolution (TR) | ~3.5 s (with SWAT) | ~3+ s | ~2-3 s | Whole-brain coverage [13] |
| tSNR Gain | ~2× improvement | Baseline | Variable (often lower than SE) | Compared to SE-EPI at matched parameters [13] |
| Susceptibility Artifacts | Significantly reduced | Moderate | Pronounced in inferior brain regions | Qualitative assessment in frontotemporal-limbic regions [13] [35] |
| Large Vein Bias | Reduced | Moderate | Pronounced | Microvasculature specificity [13] |
Table 2: Application-Specific Performance Comparison
| Research Application | gSLIDER-SWAT Advantages | Traditional SE-EPI Limitations |
|---|---|---|
| Amygdala Subnuclei Imaging | Capable of discriminating basolateral subnuclei activation [13] | Limited spatial resolution and signal dropout |
| Laminar fMRI | Enables differentiation of cortical layers | Insufficient resolution for reliable layer separation |
| Emotion Processing Studies | Robust signal in limbic regions including amygdala [13] | Signal dropout in critical emotion processing regions |
| Default Mode Network | Improved functional connectivity estimates | Susceptibility artifacts in medial prefrontal regions |
Experimental Protocols
Protocol 1: gSLIDER-SWAT fMRI Acquisition for Cognitive Neuroscience
Sequence Parameters:
- Field Strength: 3T (Siemens Prisma/Skyra)
- Resolution: 1×1×1 mm³ isotropic
- FOV: 220×220×130 mm³
- TR: 18 s (3.6 s per dithered volume with SWAT reconstruction)
- TE: 69 ms
- Parallel Imaging: GRAPPA factor 3
- Partial Fourier: 6/8
- gSLIDER Factor: 5 (26 thin-slabs, 5 mm thick, each acquired 5× with different slice phase) [13]
Reconstruction Pipeline:
- Data Collection: Acquire multiple RF-encoded slab data
- Forward Model: Use Bloch-simulated slab profiles to create transformation matrix
- Linear Regression: Apply Tikhonov regularization (λ=0.1) in MATLAB reconstruction
- SWAT Processing: Implement sliding window temporal acceleration [35]
Validation Approach:
- Begin with classic block-design paradigms (e.g., hemifield checkerboard)
- Progress to naturalistic stimuli for complex cognitive states
- Compare activation patterns with traditional sequences in same subjects [13]
The Scientist's Toolkit
Table 3: Essential Research Reagents and Materials
| Item | Specification | Research Function |
|---|---|---|
| MRI Scanner | 3T with high-performance gradients (Siemens Prisma/Skyra) | High SNR image acquisition with multiband capabilities [13] |
| RF Head Coil | 64-channel or 32-channel head array | Signal reception with optimized spatial sensitivity [13] [9] |
| gSLIDER Sequence | Custom implementation with SWAT reconstruction | High spatial-temporal resolution fMRI acquisition [13] |
| Stimulus Presentation System | Software compatible with fMRI triggering (e.g., Presentation) | Precise timing of experimental paradigms [76] |
| Reconstruction Software | MATLAB with custom reconstruction code | gSLIDER-SWAT image reconstruction and temporal acceleration [35] |
Methodological Workflows
Quantitative Performance Comparison: Multi-Slab EVI vs. EPI
FAQ: What are the documented performance gains of Multi-Slab EVI compared to conventional EPI for task-based fMRI?
Based on controlled experiments, Multi-Slab Echo-Volumar Imaging (EVI) demonstrates significant improvements in key statistical and signal parameters over conventional Echo-Planar Imaging (EPI). The table below summarizes the quantitative gains measured during visual and motor task experiments [77] [78].
Table 1: Documented Improvements of Multi-Slab EVI vs. Conventional EPI
| Performance Metric | Visual Task Improvement | Motor Task Improvement | Experimental Conditions |
|---|---|---|---|
| Mean t-score | +96% | +66% | 4-slab EVI, whole brain, 4 mm isotropic voxel, TR=286 ms [77] |
| Maximum t-score | +263% | +124% | 4-slab EVI, whole brain, 4 mm isotropic voxel, TR=286 ms [77] |
| Mean BOLD Signal Amplitude | +59% | +131% | 4-slab EVI, whole brain, 4 mm isotropic voxel, TR=286 ms [77] |
| Maximum BOLD Signal Amplitude | +29% | +67% | 4-slab EVI, whole brain, 4 mm isotropic voxel, TR=286 ms [77] |
| Activation Extent | +73% | +70% | After 2s moving average filtering for physiological noise suppression [77] |
Further sensitivity enhancement was also measured in the auditory cortex, indicating the benefit extends across multiple functional networks [77]. The high temporal resolution of Multi-Slab EVI enables the use of a time-domain moving average filter (e.g., 2 s width) to suppress physiological noise from cardiac and respiratory fluctuations. Applying this filter yielded even greater gains in statistical significance, with mean t-scores increasing by 196% for visual tasks and 140% for motor tasks compared to EPI [77].
Experimental Protocols for Sensitivity Comparison
FAQ: How were the comparative data between Multi-Slab EVI and EPI acquired?
The following methodology details the key experiments that documented the performance gains of Multi-Slab EVI [77] [78].
Pulse Sequence and Data Acquisition
- Pulse Sequence: The Multi-Slab EVI sequence was based on a multi-echo EPI (MEPI) sequence with flyback along the kz-direction. It used multiple adjacent slabs excited sequentially and encoded in a single TR using repeated EPI modules with interleaved phase encoding gradients [77].
- Spatial Encoding: The sequence employed 4-fold accelerated GRAPPA reconstruction. Encoding of 8 slices per slab with a 64x64 in-plane matrix was performed using 6/8 partial phase encoding, a readout bandwidth of 2790 Hz/pixel, and trapezoidal readout gradients with ramp sampling [77].
- Imaging Parameters: Experiments were conducted on a clinical 3T Siemens Trio scanner with a 12-channel head coil. Key parameters included:
- Whole-Brain 4-Slab EVI: 4 mm isotropic voxel size, Temporal Resolution (TR) = 286 ms.
- Partial-Brain 2-Slab EVI: 4x4x6 mm³ voxel size, Temporal Resolution (TR) = 136 ms.
- The minimum effective echo time (TE) was 28 ms to minimize frontal lobe signal drop-out [77].
- Comparative Method: Conventional multi-slice EPI was acquired for performance comparison against Multi-Slab EVI across visual, motor, and auditory tasks [77].
Real-Time Processing and Analysis
- Image Reconstruction: Real-time reconstruction was implemented in two stages. In-plane reconstruction with GRAPPA was performed on the scanner reconstruction computer. The resulting 2D images were then exported to an external workstation for reconstruction of the 3rd spatial dimension, enabling real-time fMRI analysis with time delays of less than 500 ms [77] [78].
- Physiological Monitoring: Pulse and respiration waveforms were recorded with a high temporal resolution of 20 ms to facilitate the correction of physiological noise [77].
- Statistical Analysis: BOLD sensitivity was quantified by comparing mean and maximum percent signal change, mean and maximum t-scores, the spatial extent of activation, and temporal signal-to-noise ratio (tSNR) between Multi-Slab EVI and EPI [77].
Figure 1: Experimental workflow for comparing Multi-Slab EVI and EPI.
The Scientist's Toolkit: Essential Research Reagents & Materials
FAQ: What are the essential hardware and software components required to implement Multi-Slab EVI?*
The following table lists the key "research reagents" — the critical hardware, software, and methodological components — needed for successful Multi-Slab EVI experimentation [77] [37].
Table 2: Essential Research Reagents and Materials for Multi-Slab EVI
| Item | Function/Description | Example/Note |
|---|---|---|
| 3T MRI Scanner | Primary imaging platform. Requires strong, stable gradients. | Siemens Trio or Prisma systems were used in cited studies [77] [37]. |
| Multi-Channel Head Coil | Signal reception; enables parallel imaging acceleration. | 12-channel or 32-channel array receive-only head coil [77]. |
| GRAPPA Algorithm | Parallel imaging technique for in-plane acceleration. | 4-fold acceleration used to shorten the EVI readout [77]. |
| Multi-Slab EVI Pulse Sequence | Custom sequence for high-speed 3D volumetric acquisition. | Based on modified multi-echo EPI with flyback along kz [77]. |
| Real-Time Reconstruction Software | Processes large EVI data volumes with low latency. | e.g., TurboFIRE; enables analysis delay <500 ms [77]. |
| Physiological Monitoring System | Records cardiac/respiratory waveforms for noise correction. | 20 ms temporal resolution recommended [77]. |
| Moving Average Filter | Time-domain filter to suppress physiological noise. | 2 s width effective for improving t-scores [77]. |
Troubleshooting Common Experimental Challenges
FAQ: We are considering Multi-Slab EVI but are concerned about image distortion and data handling. What are the solutions to these known challenges?
Multi-Slab EVI was developed specifically to address limitations of single-shot EVI. The following troubleshooting guide covers common concerns and their documented solutions [77] [78] [37].
Challenge #1: Geometrical Distortion and Spatial Blurring
- Problem: Single-shot EVI is prone to significant geometrical image distortion, signal dropouts, and spatially-varying blurring due to long readout times and T2* decay [77] [78].
- Solution: The Multi-Slab approach partitions the volume into several slabs, drastically shortening the readout duration within each slab. This minimization of T2* decay during encoding "strongly reduce[s] geometrical distortion and blurring" [77]. Furthermore, integration of in-plane parallel imaging (GRAPPA) further accelerates k-space traversal, improving image fidelity [77].
Challenge #2: Handling Massive Data Volumes and Real-Time Processing
- Problem: The high temporal resolution of EVI generates very large datasets quickly, making real-time processing computationally intensive [77].
- Solution: A split reconstruction pipeline is effective. In-plane GRAPPA reconstruction is performed on the scanner's built-in computer. The partially reconstructed data is then transferred to an external, high-performance workstation (e.g., Intel Xeon multi-core) dedicated to reconstructing the 3rd spatial dimension and performing real-time fMRI analysis. This division of labor enables a total processing delay of less than 500 ms [77].
Challenge #3: Physiological Noise Contamination
- Problem: Physiological fluctuations (cardiac, respiratory) can alias into the BOLD signal and reduce detection sensitivity, especially at standard EPI sampling rates [77] [79].
- Solution: The ultra-high sampling rate of Multi-Slab EVI (e.g., TR=136 ms) enables "nonaliased sampling of physiological signal fluctuation" [77]. This allows for effective post-processing separation of these noise components using a simple time-domain moving average filter (e.g., 2 s width), which has been shown to dramatically improve t-scores and activation extent [77].
Challenge #4: Inadequate BOLD Sensitivity for Resting-State Networks (RSNs)
- Problem: Detecting RSNs in individual subjects with short scan times can be challenging due to low sensitivity [77] [79].
- Solution: The combined effect of high sampling rate and longer sampling of the BOLD effect in the echo-time domain in Multi-Slab EVI "significantly improves sensitivity" [77]. Studies show that with a TR of 136 ms, major RSNs (bilateral sensorimotor, default mode, occipital) can be detected in individual subjects in time frames as short as 75 seconds [77].
Figure 2: Troubleshooting common challenges in Multi-Slab EVI.
FAQs and Troubleshooting Guides
Discrepancies often arise from the fundamental differences in what each modality measures and their inherent biases.
- Responsiveness vs. Selectivity: Direct comparisons under standardized conditions show that electrophysiology typically identifies a larger fraction of responsive neurons, while calcium imaging suggests that responsive neurons show a higher degree of stimulus selectivity [80]. This is because calcium indicators sparsify neural responses and supralinearly amplify spike bursts [80].
- Temporal Resolution: Electrophysiology pinpoints neural activity with sub-millisecond resolution, enabling the study of fine-timescale synchronization. In contrast, calcium imaging is limited by indicator kinetics and photon collection, typically operating at 1-30 Hz, which temporally blurs the neural signals [80] [81].
- Spatial Sampling: Calcium imaging, especially two-photon methods, is often limited to superficial cortical layers in a single plane. Electrophysiology, using linear probes, can sample from both cortical and subcortical structures but may poorly sample neurons within the same layer [80].
Troubleshooting Guide: If you observe mismatches in population responses:
- Apply a Forward Model: To reconcile data, consider applying a spikes-to-calcium forward model to your electrophysiology data. This can help determine if differences are due to the calcium indicator's nonlinear dynamics [80].
- Filter by Event Rate: Restrict analysis to neurons with an event rate above a minimum threshold, as electrophysiology can miss or merge low-firing-rate units [80].
FAQ 2: How can I improve the temporal resolution of high-resolution fMRI for better correlation with fast modalities?
Standard high-resolution fMRI often requires long repetition times (TR), crippling its temporal resolution. Advanced sequences and reconstruction methods are now addressing this.
- Use Advanced Acquisition Sequences: Spin-echo based techniques like generalized Slice Dithered Enhanced Resolution (gSLIDER) can more than double the SNR efficiency compared to traditional spin-echo fMRI at 3T. This allows for high spatial-resolution (≤1 mm³) acquisitions [13] [82].
- Implement Novel Reconstruction: The inherently long TR of gSLIDER can be mitigated with reconstruction techniques like Sliding Window Accelerated Temporal resolution (SWAT). gSLIDER-SWAT can provide a nominal 5-fold increase in temporal resolution (e.g., from TR ~18 s to TR ~3.5 s), enabling the detection of faster neural dynamics without simple interpolation [13] [82].
Troubleshooting Guide: If your fMRI temporal resolution is insufficient for your experimental paradigm:
- Validate with a High-Frequency Paradigm: Test your high temporal-resolution fMRI method with a classic block design paradigm where the stimulus frequency is increased to the sequence's Nyquist limit. Robust activation under these conditions validates the improved temporal resolution [13].
- Quantify SNR Gains: Compare the temporal Signal-to-Noise Ratio (tSNR) of the new method against traditional sequences like SE-EPI. A demonstrated ~2x gain in tSNR confirms the quality of the high-speed acquisition [13].
FAQ 3: What are gas-free methods for calibrating the fMRI BOLD signal to improve quantitative comparisons?
Traditional calibrated fMRI uses gas challenges (e.g., CO₂) which can be problematic, especially in rodent studies. Gas-free relaxometry-based methods are a robust alternative.
- Relaxometry-Based Calibrated fMRI (rcfMRI): This method uses the BOLD-sensitive magnetic relaxation component, R2′ (calculated as R2* - R2), together with a measurement of cerebral blood flow (CBF) to calculate the cerebral metabolic rate of oxygen (CMRO₂) without gas challenges [83].
- Protocol Summary: Data is recorded in two brain states (e.g., awake vs. anesthetized). Quantitative R2* and R2 maps are acquired to derive R2′. Simultaneously, CBF is measured (e.g., with pCASL). These parameters are then used to compute relative CMRO₂ (rCMRO₂) changes between the two states [83].
Troubleshooting Guide: If your calibrated fMRI results are noisy:
- Use a Global Paradigm: Instead of a local sensory stimulus, use a global state change (e.g., anesthesia with dexmedetomidine) to induce a robust, whole-brain change in CMRO₂. This provides a stronger signal for calibration [83].
- Corroborate with an Independent Method: Validate your rCMRO₂ findings with an established global CMRO₂ measurement technique, such as T2 relaxation under spin-tagging (TRUST) MRI [83].
Experimental Protocols for Key Techniques
Protocol 1: Implementing gSLIDER-SWAT for High Spatial-Temporal Resolution fMRI at 3T
This protocol enables sub-millimeter fMRI at a temporal resolution compatible with many cognitive paradigms [13] [82].
Equipment Setup:
- A 3T MRI scanner (e.g., Siemens Prisma or Skyra).
- A high-channel head coil (e.g., 32ch or 64ch).
Sequence Parameters:
- Sequence: Spin-echo based gSLIDER.
- Resolution: 1 x 1 x 1 mm³ isotropic.
- FOV: 220 x 220 x 130 mm³.
- TE: 69 ms.
- Nominal TR: ~18 s (for gSLIDER factor 5).
- k-space Acceleration: Use GRAPPA (e.g., factor 3) and partial Fourier (e.g., 6/8).
- gSLIDER Acquisition: To achieve 1 mm slices, 26 thin-slabs (5 mm thick) are acquired, each acquired 5 times with a different slice phase encoding.
SWAT Reconstruction:
- Utilize a sliding window reconstruction algorithm on the individual gSLIDER radiofrequency encodings to improve the effective temporal resolution.
- This reconstruction is performed offline after data acquisition.
Validation:
- Task Paradigm: Run a block-design visual checkerboard task with stimulus frequencies pushed towards the Nyquist limit of the sequence.
- Analysis: Use GLM and ICA to confirm robust activation in the primary visual cortex and improved signal detection compared to temporally interpolated data.
Protocol 2: Gas-Free, Relaxometry-Based Calibrated fMRI (rcfMRI) in Rodents
This protocol allows for voxel-wise mapping of CMRO₂ changes without gas challenges, suitable for both anesthetized and awake animal studies [83].
Animal Preparation: Conduct experiments in the same subject in two different states (e.g., awake and anesthetized with dexmedetomidine).
Data Acquisition in Both States:
- R2* Mapping: Acquire a multi-echo gradient-echo (MEGE) sequence to calculate quantitative R2* maps.
- R2 Mapping: Acquire a multi-echo spin-echo (MESE) sequence to calculate quantitative R2 maps.
- CBF Measurement: Acquire a pulsed or pseudo-continuous arterial spin labeling (pCASL) sequence to generate quantitative CBF maps.
Data Processing:
- Compute the R2′ map using the formula: R2′ = R2* - R2 [83].
- Coregister all quantitative maps (R2′, CBF) to the same space.
CMRO₂ Calculation:
- Use the derived parameters to calculate relative CMRO₂ (rCMRO₂) between the two states (P and Q) with the formula [83]:
- rCMRO₂ = CMRO₂P / CMRO₂Q = [ (R2′P / R2′Q)^(1/β) ] * [ (CBFP / CBFQ)^(1 - α/β) ]
- Where α is Grubb's constant (typically ~0.38) and β is the power-law exponent for the BOLD-[dHb] relationship (often assumed to be ~1.3) [83].
- Use the derived parameters to calculate relative CMRO₂ (rCMRO₂) between the two states (P and Q) with the formula [83]:
Table 1: Performance Comparison of Functional Imaging Techniques
| Technique | Spatial Resolution | Temporal Resolution | Key Metric / Advantage | Primary Use Case |
|---|---|---|---|---|
| gSLIDER-SWAT fMRI [13] [82] | ≤ 1 mm³ isotropic | ~3.5 s (effective TR) | ~2x tSNR gain over SE-EPI; 5x temporal resolution gain | High-resolution cognitive & clinical neuroscience at 3T |
| rcfMRI [83] | Voxel-wise mapping | Limited by R2*, R2, & CBF acquisition | Provides quantitative CMRO₂ maps without gas challenge | Preclinical studies of brain metabolism and anesthesia effects |
| Two-Photon Ca²⁺ Imaging [80] | Single-cell | ~1-30 Hz (limited by kinetics) | High stimulus selectivity in responsive neurons | Cortical layer-specific activity in superficial layers |
| Dense Electrophysiology [80] | Single-cell | >1 kHz (sub-millisecond) | Higher fraction of responsive neurons detected | Fine-timescale synchronization across brain regions |
Table 2: Essential Research Reagent Solutions
| Reagent / Material | Function / Description | Example Application |
|---|---|---|
| GCaMP6f/GCaMP8 [80] [84] | Genetically encoded calcium indicator (GECI) | Monitoring population-level neuronal activity in transgenic mice [80] [84] |
| gSLIDER Sequence [13] | MRI pulse sequence for high-SNR, sub-mm resolution | Achieving high spatial-temporal resolution fMRI at 3T field strength [13] |
| Cre Driver Mouse Lines [80] | Enables cell-type-specific expression of indicators | Targeting specific neuronal populations (e.g., excitatory vs. inhibitory) for imaging [80] |
| Dexmedetomidine [83] | Anesthetic used in global CMRO₂ change paradigms | Inducing a controlled, whole-brain state change for rcfMRI calibration [83] |
Technical Workflow and Signaling Pathways
Diagram 1: Workflow for Multi-Modal Functional Data Correlation
Workflow for Multi-Modal Data Correlation
Diagram 2: Relaxometry-Based Calibrated fMRI (rcfMRI) Pathway
rcfMRI Pathway
This technical support center is designed for researchers and scientists investigating emotion processing in the limbic system. A primary technical challenge in this field is the inherent trade-off between spatial resolution, temporal resolution, and signal-to-noise ratio (SNR), particularly when using standard Gradient-Echo Echo-Planar Imaging (GE-EPI) sequences on widely available 3T scanners. This resource provides targeted troubleshooting guidance to overcome these limitations, framed within the broader thesis that advances in acquisition and reconstruction techniques are crucial for improving temporal resolution without sacrificing spatial detail in functional brain imaging research.
A common obstacle reported by researchers is the failure to detect significant subcortical limbic activity during emotion tasks. This is frequently not a negative result but a technical limitation. Standard GE-EPI is highly susceptible to susceptibility-induced signal dropout and geometric distortions in regions near air-tissue interfaces, such as the amygdala and orbitofrontal cortex [13] [35]. Furthermore, achieving high spatial resolution (e.g., ≤1 mm³) for studying small limbic subnuclei often necessitates long repetition times (TR), severely degrading temporal resolution and complicating the interpretation of hemodynamic responses [13]. The following sections offer detailed solutions to these specific problems.
Troubleshooting Guides
Guide 1: Addressing Signal Dropout in Limbic Regions
Reported Problem: "Loss of signal or severe distortion in amygdala, ventral striatum, and orbitofrontal cortex during emotion paradigms."
Root Cause: Standard GE-EPI sequences are vulnerable to magnetic field inhomogeneities caused by proximity to sinus cavities. This leads to signal dropout and distortions, masking true BOLD activation in key limbic structures [13] [35].
Solution: Implement Spin-Echo (SE) based acquisition sequences.
- Recommended Technique: Adopt a spin-echo based generalized Slice Dithered Enhanced Resolution (gSLIDER) sequence.
- Why it Works: SE-based sequences are significantly less sensitive to the static magnetic field inhomogeneities that cause signal dropout with GE-EPI. The gSLIDER technique further enhances SNR efficiency by acquiring multiple thin slabs with sub-voxel shifts along the slice direction, which are then reconstructed into high-resolution images [13] [35].
- Validation: A study using gSLIDER to investigate the emotion "joy" demonstrated robust activation in the left amygdala (including basolateral subnuclei) and striatum—regions often missed by standard GE-EPI due to signal dropout [13].
Guide 2: Improving Temporal Resolution in High-Resolution Acquisitions
Reported Problem: "High spatial resolution scans require long TRs (>5-10 s), blurring the hemodynamic response and reducing statistical power for event-related designs."
Root Cause: Allowing for full spin relaxation between high-resolution volume acquisitions inherently limits temporal resolution.
Solution: Utilize advanced acceleration techniques and reconstruction algorithms.
Technique A: gSLIDER with Sliding Window Accelerated Temporal resolution (gSLIDER-SWAT)
- Methodology: This novel reconstruction method leverages the temporal information within individual gSLIDER radiofrequency (RF) encodings. Instead of waiting for the full TR, a sliding window approach reconstructs images from overlapping subsets of the acquired data.
- Outcome: Provides up to a five-fold increase in temporal resolution, reducing the effective TR from ~18 seconds to ~3.5 seconds while maintaining 1 mm³ isotropic resolution, thus preserving the ability to resolve faster event-related paradigms [13].
Technique B: Multi-Band Echo-Volumar Imaging (MB-EVI)
- Methodology: This approach combines multi-band (simultaneous multi-slab) encoding with accelerated 3D readouts (EVI). It uses CAIPI shifting, GRAPPA acceleration, and partial Fourier sampling to achieve extreme acceleration.
- Outcome: Enables sub-second temporal resolution (TR ~118-650 ms) with millimeter spatial resolution at 3T, facilitating real-time fMRI and the detection of high-frequency resting-state fluctuations [85].
Guide 3: Correcting for Reconstruction Artifacts in Accelerated fMRI
Reported Problem: "Accelerated reconstructions (e.g., SWAT, CS) introduce spatial blurring or undersampling artifacts."
Root Cause: Imperfect point spread function from regularization in inverse problems or insufficient calibration data for parallel imaging.
Solution:
- For gSLIDER-SWAT: The reconstruction using Tikhonov regularization (λ=0.1) is a linear process. Artifacts can be minimized by ensuring the accuracy of the forward model (matrix A), which should be generated using Bloch-simulated slab profiles to account for cross-talk [35].
- For Compressed Sensing (CS): Use controlled aliasing techniques (e.g., CAIPIRINHA) to create a more incoherent undersampling pattern, which improves the performance of sparse reconstruction algorithms [85].
- General Solution: Integrate NORDIC denoising as a post-processing step. This approach has been shown to significantly enhance fMRI sensitivity in accelerated acquisitions like MB-EVI without introducing spatial blurring [85].
Frequently Asked Questions (FAQs)
Q1: Our lab has a standard 3T scanner. Can we really achieve sub-millimeter resolution for the amygdala without a 7T system?
A: Yes, it is feasible with optimized sequences. The gSLIDER-SWAT technique has been successfully implemented on clinical 3T Siemens Prisma and Skyra systems, achieving 1 mm³ isotropic resolution and reliably detecting amygdala subnuclei activity. The key is the SNR-efficient gSLIDER acquisition and the temporal resolution recovery of the SWAT reconstruction [13] [35].
Q2: How does improved temporal resolution directly benefit the study of emotions?
A: Higher temporal resolution allows for more precise mapping of the hemodynamic response function (HRF), which is critical for disentangling rapid, overlapping neural events in emotion processing. It also improves the detection power for event-related designs and enables the study of dynamic functional connectivity within limbic-cortical networks at shorter timescales [13] [85].
Q3: Are there specific quality control (QC) metrics we should monitor for high-resolution limbic fMRI?
A: Beyond standard QC, prioritize:
- Temporal SNR (tSNR): gSLIDER has been shown to provide a ~2x gain in tSNR over traditional SE-EPI, which is critical for detecting weak BOLD signals in small limbic structures [13].
- Signal Dropout Assessment: Visually inspect mean functional images for signal voids in the amygdala/ventral striatum and compare between GE-EPI and SE-based sequences.
- Temporal Stability: Check for excessive drift or spike artifacts in the time series from limbic Regions of Interest (ROIs), which can be exacerbated by some acceleration techniques.
Experimental Protocols & Data
Detailed Protocol: gSLIDER-SWAT for Imaging Joy
This protocol is adapted from a published study that successfully detected limbic activity using naturalistic video stimuli to evoke joy [13] [35].
- Hypothesis: gSLIDER-SWAT will improve the detection of functional networks underlying joy in subcortical limbic regions at high resolutions at 3T.
- Scanner Hardware: Siemens 3T Prisma or Skyra fit.
- Radiofrequency Coil: Use a 64-channel or 32-channel head coil for high SNR.
- Pulse Sequence: Spin-echo based gSLIDER (factor 5).
- Key Acquisition Parameters:
- FOV: 220 × 220 × 130 mm³
- Resolution: 1 × 1 × 1 mm³ (isotropic)
- TE/TR: 69 ms / 18 s (effective TR with SWAT: ~3.5 s)
- Acceleration: GRAPPA factor 3, Partial Fourier 6/8
- Reconstruction:
- Software: Custom MATLAB code.
- Method: Standard linear regression with Tikhonov regularization (λ = 0.1) is used to reconstruct high-resolution slices from five acquired RF-encoded slabs. The forward model (matrix A) is created using Bloch-simulated slab profiles.
- SWAT: A sliding window is applied to the individual gSLIDER encodings to reconstruct volumes at a higher temporal rate.
- fMRI Paradigm:
- Stimuli: Naturalistic videos known to induce joy, interspersed with neutral videos.
- Design: Blocked or event-related design.
- Analysis: Standard GLM and ICA can be used. The improved tSNR and temporal resolution should enhance signal detection in limbic ROIs.
Quantitative Performance Data
The following table summarizes key performance metrics from recent high-resolution techniques as reported in the literature.
Table 1: Performance Comparison of High-Resolution fMRI Techniques
| Technique | Spatial Resolution | Temporal Resolution (TR) | Key Performance Advantage | Best For |
|---|---|---|---|---|
| gSLIDER-SWAT [13] [35] | 1.0 mm³ isotropic | ~3.5 s (from 18 s) | ~2x tSNR gain over SE-EPI; Reduces signal dropout. | Studying subcortical limbic subnuclei at 3T. |
| MB-EVI [85] | 1.0 - 3.0 mm³ isotropic | 118 - 650 ms | Sub-second whole-brain fMRI; Maps high-frequency (>0.3 Hz) resting-state networks. | Real-time fMRI, dynamic connectivity, capturing rapid neural dynamics. |
| Simultaneous EEG-fMRI at 7T [86] | Sub-millimeter | Millisecond (EEG) | Combines millisecond temporal (EEG) with sub-millimeter spatial (fMRI) precision. | Linking electrophysiological events to BOLD activity in laminar/ subcortical structures. |
Table 2: Key Reagent Solutions for High-Resolution fMRI
| Item / Reagent | Function / Role | Technical Specification / Application |
|---|---|---|
| High-Channel Count Head Coil | Signal Reception | 32-channel or 64-channel arrays provide the high SNR required for accelerated parallel imaging. |
| Spin-Echo (SE) Sequence | Image Acquisition | Reduces susceptibility artifacts vs. GE-EPI; foundation for gSLIDER. |
| Tikhonov Regularization | Image Reconstruction | Stabilizes the inverse problem in gSLIDER reconstruction (λ = 0.1). |
| NORDIC Denoising | Data Post-processing | Enhances fMRI sensitivity in accelerated data without introducing spatial blurring. |
| CAIPIRINHA Sampling | Data Acquisition | Creates incoherent undersampling patterns for improved compressed sensing reconstruction. |
Signaling Pathways & Workflow Diagrams
gSLIDER-SWAT Acquisition and Reconstruction Workflow
Technical Decision Pathway for Limbic fMRI
Conclusion
The concerted advancement of acquisition sequences, such as gSLIDER-SWAT and multi-slab EVI, coupled with sophisticated analytical frameworks like deep learning, is decisively breaking the temporal resolution barriers that have long constrained functional brain imaging. These innovations provide unprecedented access to the brain's millisecond-scale dynamics, enhancing the detection of subtle neural events, improving the accuracy of functional connectivity fingerprinting, and enabling the study of complex, paradigm-free cognitive phenomena. For biomedical and clinical research, this progress paves the way for more sensitive biomarkers of neurological and psychiatric disorders, a deeper understanding of drug effects on neural circuitry, and ultimately, the development of more targeted and effective therapeutic interventions. Future efforts must focus on making these advanced techniques more accessible, further validating their biological specificity through multi-modal integration, and exploring their full potential in personalized medicine and large-scale translational studies.
References
- 1. A Hitchhiker's Guide to Functional Magnetic Resonance ... [https://www.frontiersin.org/journals/neuroscience/articles/10.3389/fnins.2016.00515/full]
- 2. What does fMRI measure? | Brain Metrics [https://www.nature.com/scitable/blog/brain-metrics/what_does_fmri_measure/]
- 3. Overview of Functional Magnetic Resonance Imaging - PMC [https://pmc.ncbi.nlm.nih.gov/articles/PMC3073717/]
- 4. fMRI with whole-brain coverage, 75-ms temporal resolution ... [https://www.sciencedirect.com/science/article/pii/S0730725X2300111X]
- 5. Applications and advances of combined fMRI-fNIRs ... [https://www.frontiersin.org/journals/neurology/articles/10.3389/fneur.2025.1542075/full]
- 6. TR(Acking) Individuals Down: Exploring the Effect of ... [https://pubmed.ncbi.nlm.nih.gov/39887794/]
- 7. Limitations of temporal resolution in functional MRI - PubMed [https://pubmed.ncbi.nlm.nih.gov/9094089/]
- 8. How pushing the spatiotemporal resolution of fMRI can ... [https://www.sciencedirect.com/science/article/abs/pii/S0301008221001982]
- 9. Advanced preclinical functional magnetic resonance ... [https://www.nature.com/articles/s44303-025-00085-z]
- 10. The diagnostic potential of resting state functional MRI [https://www.sciencedirect.com/science/article/pii/S1053811925003374]
- 11. Estimating Brain Activity with High Spatial and Temporal ... [https://arxiv.org/abs/2510.09415]
- 12. Spatiotemporal Precision of Neuroimaging in Psychiatry [https://www.sciencedirect.com/science/article/pii/S0006322322015256]
- 13. 3T high spatial–temporal resolution fMRI [https://www.frontiersin.org/journals/neuroimaging/articles/10.3389/fnimg.2025.1537440/full]
- 14. Investigating the tradeoffs between spatial resolution and ... [https://pmc.ncbi.nlm.nih.gov/articles/PMC4206697/]
- 15. Differential sustained and transient temporal processing across visual... [https://journals.plos.org/ploscompbiol/article?id=10.1371/journal.pcbi.1007011]
- 16. MEG Neuroimaging: The Magnetic Might... | Technology Networks [https://www.technologynetworks.com/neuroscience/blog/meg-neuroimaging-the-magnetic-might-keeping-time-on-the-brains-hidden-secrets-354263]
- 17. Opportunities for use of neuroimaging in de-risking drug ... [https://www.nature.com/articles/s41386-024-01970-8]
- 18. Ultrafast optical imaging techniques for exploring rapid ... [https://pmc.ncbi.nlm.nih.gov/articles/PMC11867703/]
- 19. RETRACTED: In vivo direct imaging of neuronal activity at high... [https://pubmed.ncbi.nlm.nih.gov/36227975/]
- 20. Laboratory of Neuroimaging [https://www.niaaa.nih.gov/es/research/intramural-research/laboratories/laboratory-neuroimaging]
- 21. Characterization and Reduction of Cardiac- and Respiratory-Induced Noise as a Function of the Sampling Rate (TR) in fMRI - PMC [https://www.ncbi.nlm.nih.gov/pmc/articles/PMC4209749/]
- 22. Frontiers | Sampling Rate Effects on Resting State fMRI Metrics [https://www.frontiersin.org/articles/10.3389/fnins.2019.00279/full]
- 23. Increased fMRI Sensitivity at Equal Data Burden Using ... [https://pmc.ncbi.nlm.nih.gov/articles/PMC5120083/]
- 24. Frontiers | Physiological Noise in Brainstem fMRI [https://www.frontiersin.org/journals/human-neuroscience/articles/10.3389/fnhum.2013.00623/full]
- 25. The impact of physiological noise correction on fMRI at 7 T [https://pmc.ncbi.nlm.nih.gov/articles/PMC3115139/]
- 26. Enhanced Identification of BOLD-like Components with Multi-Echo ... [https://ncbi.nlm.nih.gov/pmc/articles/PMC4408238]
- 27. Model-based physiological noise removal in fast fMRI [https://www.sciencedirect.com/science/article/pii/S1053811919308225]
- 28. Separation of physiological very low frequency fluctuation from aliasing by switched sampling interval fMRI scans - PubMed [https://pubmed.ncbi.nlm.nih.gov/15733787/]
- 29. Sensitivity and specificity considerations for fMRI encoding ... [https://pmc.ncbi.nlm.nih.gov/articles/PMC5623610/]
- 30. Whole brain, high resolution multiband spin-echo EPI fMRI ... [https://www.sciencedirect.com/science/article/abs/pii/S1053811914002663]
- 31. Microvascular Specificity of Spin Echo BOLD fMRI [https://pmc.ncbi.nlm.nih.gov/articles/PMC10516014/]
- 32. A comparison of dual gradient‐echo and spin‐echo fMRI ... [https://pmc.ncbi.nlm.nih.gov/articles/PMC6869502/]
- 33. Effects of phase regression on high-resolution functional ... [https://www.sciencedirect.com/science/article/pii/S1053811920311162]
- 34. Multiband acquisition sequences for fMRI: Proceed with ... [https://apertureneuro.org/article/91292-multiband-acquisition-sequences-for-fmri-proceed-with-caution]
- 35. 3T high spatial–temporal resolution fMRI - PubMed Central - NIH [https://pmc.ncbi.nlm.nih.gov/articles/PMC12170577/]
- 36. In this work, we propose generalized Slider (gSlider) ... [https://cds.ismrm.org/protected/16MProceedings/PDFfiles/0607.html]
- 37. Real-time fMRI using multi-band echo-volumar imaging ... [https://www.frontiersin.org/journals/neuroscience/articles/10.3389/fnins.2025.1543206/full]
- 38. Evaluation of highly accelerated simultaneous multi-slice ... [https://www.sciencedirect.com/science/article/abs/pii/S1053811914008520]
- 39. Volume-Wise Task fMRI Decoding with Deep Learning ... [https://arxiv.org/abs/2503.01925]
- 40. Deep Learning in Neuroimaging: Overcoming Challenges ... [https://pmc.ncbi.nlm.nih.gov/articles/PMC9200984/]
- 41. Editorial: Chasing brain dynamics at their speed: what can ... [https://www.frontiersin.org/journals/neuroscience/articles/10.3389/fnins.2023.1223955/full]
- 42. Volume-Wise Task fMRI Decoding with Deep Learning ... [https://www.semanticscholar.org/paper/Volume-Wise-Task-fMRI-Decoding-with-Deep-Temporal-Wu-Yang/123909b60f444cdedb69caf5f75ce962036081b9]
- 43. Analysis of stimulus-induced brain dynamics during ... [https://pmc.ncbi.nlm.nih.gov/articles/PMC7418522/]
- 44. Temporal Dynamics of Affect in the Brain - PubMed Central - NIH [https://pmc.ncbi.nlm.nih.gov/articles/PMC8792368/]
- 45. The Temporal Dynamics of Spontaneous Emotional Brain ... [https://pmc.ncbi.nlm.nih.gov/articles/PMC9026845/]
- 46. Emergence of Emotion Selectivity in Deep Neural ... [https://pmc.ncbi.nlm.nih.gov/articles/PMC10168209/]
- 47. Mapping Emotions in the Brain: A Bi-Hemispheric Neural ... [https://arxiv.org/html/2507.12625v1]
- 48. 11. Data science tools for neuroimaging [https://neuroimaging-data-science.org/content/005-nipy/001-nipy.html]
- 49. Multi‐Metric Approach for the Comparison of Denoising ... [https://pmc.ncbi.nlm.nih.gov/articles/PMC12044599/]
- 50. 生医工程学院宋小磊课题组实现多对比度超分辨磁共振成像 ... [https://www.tsinghua.edu.cn/info/1175/122468.htm]
- 51. Cell:开启脑科学“高保真”时代!从模糊混响到清晰合奏,我们 ... [https://news.bioon.com/article/180e88e9125b.html]
- 52. 脑–脊髓同步功能磁共振开放数据库发布 [https://www.cas.cn/syky/202510/t20251031_5086836.shtml]
- 53. 多种有效连接方法分析静息态功能磁共振频率依赖的人脑信息流 ... [https://pmc.ncbi.nlm.nih.gov/articles/PMC12439644/]
- 54. A non-invasive approach to awake mouse fMRI compatible ... [https://pmc.ncbi.nlm.nih.gov/articles/PMC12511802/]
- 55. High-resolution awake mouse fMRI at 14 tesla [https://elifesciences.org/articles/95528]
- 56. High-resolution awake mouse fMRI at 14 Tesla [https://elifesciences.org/reviewed-preprints/95528v2]
- 57. Longitudinal awake imaging of mouse deep brain ... [https://elifesciences.org/articles/95168]
- 58. SORDINO for Silent, Sensitive, Specific, and Artifact-Resisting ... [https://pmc.ncbi.nlm.nih.gov/articles/PMC11952411/]
- 59. Motion compensated magnetic resonance imaging of an ... [https://www.nature.com/articles/s41598-025-27800-5]
- 60. Longer scans boost prediction and cut costs in brain-wide ... [https://www.nature.com/articles/s41586-025-09250-1]
- 61. Questions and Answers in MRI [https://mriquestions.com/choice-of-trteetc.html]
- 62. Improving temporal resolution in fMRI using a 3D spiral ... [https://www.sciencedirect.com/science/article/abs/pii/S1053811917304731]
- 63. Signal-to-noise ratio [https://en.wikipedia.org/wiki/Signal-to-noise_ratio]
- 64. Investigating the effective temporal resolution in a task- ... [https://pmc.ncbi.nlm.nih.gov/articles/PMC12290576/]
- 65. Big Data and Data Mining: How to Handle Large Datasets [https://blog.workday.com/en-us/big-data-and-data-mining.html]
- 66. The Evolution and Challenges of Real-Time Big Data [https://www.mdpi.com/2813-0324/10/1/11]
- 67. How long to scan? The relationship between fMRI temporal ... [https://pmc.ncbi.nlm.nih.gov/articles/PMC2223273/]
- 68. Temporal signal-to-noise ratio (tSNR) is commonly used ... [https://cds.ismrm.org/protected/19MProceedings/PDFfiles/3953.html]
- 69. BOLD sensitivity and SNR characteristics of parallel ... [https://www.sciencedirect.com/science/article/abs/pii/S1053811913008616]
- 70. Identifiability in Functional Connectivity May Unintentionally ... [https://pmc.ncbi.nlm.nih.gov/articles/PMC10418521/]
- 71. SNR and functional sensitivity of BOLD and perfusion ... [https://pmc.ncbi.nlm.nih.gov/articles/PMC2396944/]
- 72. What is BOLD fMRI? [https://www.asfnr.org/what-is-bold-fmri]
- 73. Subject identification using edge-centric functional ... [https://www.sciencedirect.com/science/article/pii/S105381192100481X]
- 74. Identification of functional white matter networks in BOLD ... [https://www.vanderbilt.edu/valiant/2024/06/20/identification-of-functional-white-matter-networks-in-bold-fmri/]
- 75. related fMRI BOLD responses in non-randomized ... [https://www.frontiersin.org/journals/neuroimaging/articles/10.3389/fnimg.2023.1068616/full]
- 76. Fast spin echo sequences for BOLD functional MRI - PMC [https://pmc.ncbi.nlm.nih.gov/articles/PMC2798036/]
- 77. Enhancement of Temporal Resolution and BOLD Sensitivity in ... [https://pmc.ncbi.nlm.nih.gov/articles/PMC3342442/]
- 78. Enhancement of temporal resolution and BOLD sensitivity ... [https://www.sciencedirect.com/science/article/abs/pii/S1053811912002376]
- 79. High-Speed Real-Time Resting-State fMRI Using Multi-Slab ... [https://pmc.ncbi.nlm.nih.gov/articles/PMC3752525/]
- 80. Reconciling functional differences in populations of ... [https://pmc.ncbi.nlm.nih.gov/articles/PMC8285106/]
- 81. Calcium imaging: Unraveling the neurobiological ... [https://www.sciencedirect.com/science/article/abs/pii/S0143416025000636]
- 82. 3T high spatial-temporal resolution fMRI [https://pubmed.ncbi.nlm.nih.gov/40529161/]
- 83. High-resolution relaxometry-based calibrated fMRI in ... [https://pmc.ncbi.nlm.nih.gov/articles/PMC9014688/]
- 84. Wide-field calcium imaging of cortical activation and ... [https://www.nature.com/articles/s41467-024-51816-6]
- 85. Real-time fMRI using multi-band echo-volumar imaging ... [https://pubmed.ncbi.nlm.nih.gov/40143844/]
- 86. An optimized framework for simultaneous EEG-fMRI at 7T ... [https://pubmed.ncbi.nlm.nih.gov/41200234/]