A Step-by-Step Guide to Ca2+-Activated Split-TurboID (CaST): Protocol, Applications, and Optimization
Ca2+-activated split-TurboID (CaST) is a groundbreaking enzyme-catalyzed method for rapid, biochemical tagging of cells with elevated intracellular calcium in vivo.
A Step-by-Step Guide to Ca2+-Activated Split-TurboID (CaST): Protocol, Applications, and Optimization
Abstract
Ca2+-activated split-TurboID (CaST) is a groundbreaking enzyme-catalyzed method for rapid, biochemical tagging of cells with elevated intracellular calcium in vivo. This protocol details the use of CaST, which labels activated cells within 10 minutes using exogenously delivered biotin, acting as a time-gated integrator of total Ca2+ activity. Unlike transcriptional reporters that require hours for signal development, the CaST readout can be performed immediately after activity labeling. This article provides a comprehensive guide for researchers and drug development professionals, covering the foundational principles of CaST, a step-by-step methodological protocol, essential troubleshooting and optimization strategies, and a comparative analysis with existing technologies. Its application in tagging neurons activated by psilocybin in untethered mice demonstrates its significant potential for mapping cellular activity history in freely behaving animals.
Understanding CaST: The Next Generation of Calcium-Dependent Cellular Tagging
The Critical Need for Non-Invasive Cellular Activity Recording
Understanding the intricate activity of neural circuits is fundamental to neuroscience and the development of neurological therapeutics. Intracellular calcium (Ca²⁺) serves as a ubiquitous secondary messenger in cell signaling across biology, with dynamic changes in its concentration providing a direct proxy for neuronal firing [1]. While traditional methods like genetically encodable Ca²⁺ indicators have transformed our ability to record neural activity, they face a significant limitation: their readout is transient and typically requires invasive implants to deliver light to deep brain structures, precluding their noninvasive use in freely behaving animals [1]. This technical constraint has hampered researchers' ability to correlate the activity history of specific neurons with their other cellular properties, such as spatial localization, RNA expression, or protein expression [1].
Existing solutions for stable activity tagging implement light-sensitive proteins requiring blue or ultraviolet light activation, which limits scalability in deep brain regions, or transcriptional reporters that require hours (~6-18 hours) to produce detectable signals [1]. There exists a critical unmet need for technology that enables noninvasive, rapid activity-dependent labeling of cells in their natural behavioral state—a need addressed by the novel Ca²⁺-activated split-TurboID (CaST) platform described in this application note.
Comparative Analysis of Neural Recording Technologies
The table below summarizes the key methodological approaches for recording cellular activity, highlighting their respective limitations and advantages.
Table 1: Comparison of Cellular Activity Recording Technologies
| Method | Principle | Temporal Resolution | Spatial Resolution | Invasiveness | Key Limitations |
|---|---|---|---|---|---|
| Fluorescent Ca²⁺ Sensors [1] | Fluorescence changes with Ca²⁺ binding | Milliseconds to seconds | Single cell to network | High (requires fiber implants for deep structures) | Transient readout; requires optical access; limited to tethered animals |
| Transcriptional Reporters (e.g., TRAP2) [1] | Immediate early gene promoter-driven expression | Hours (6-18h for protein detection) | Cell-type specific | Variable (can be non-invasive) | Slow onset; not a universal activity readout; indirect activity measure |
| Light-Gated Tools (e.g., Cal-Light, CaMPARI) [1] | Light-dependent protein reconstitution or tagging | Minutes | Cell-type specific | High (requires light delivery) | Requires invasive fiber implantation; not scalable for deep structures |
| Electrobulbogram (EBG) [2] | Scalp EEG recordings from olfactory bulb | Millisecond precision | Regional (olfactory bulb) | Non-invasive | Limited to olfactory bulb; signal contamination from facial muscles |
| Endovascular EEG [3] | Intravenous electrode recording | High-fidelity | Cortical and deep veins | Minimally invasive | Requires catheterization; still investigational |
| CaST (This Work) [1] [4] | Enzyme-catalyzed biotinylation | 10-30 minutes | Cell-type specific | Non-invasive (biotin crosses BBB) | Requires viral vector delivery; optimization needed for new cell types |
CaST Technology: Mechanism and Workflow
Molecular Mechanism of Ca²⁺-Activated Split-TurboID
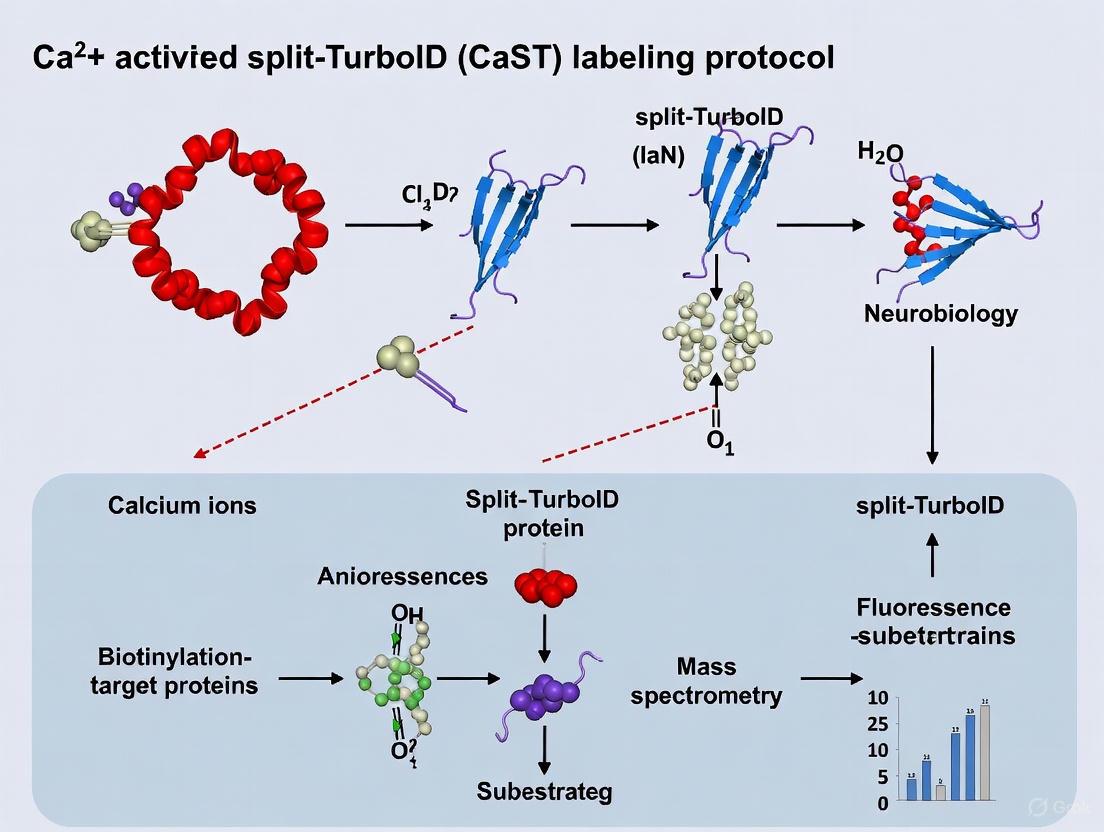
The CaST platform represents an engineered enzyme-catalyzed approach that rapidly and biochemically tags cells with elevated Ca²⁺ in vivo [1]. The system is built upon a reconstituted proximity-labeling enzyme, split-TurboID, which has been repurposed to report increased intracellular Ca²⁺ in living cells by tagging proteins with an exogenously delivered biotin molecule [1].
Diagram: Molecular Mechanism of CaST
The fundamental CaST design tethers the Ca²⁺-binding protein calmodulin (CaM) and a CaM-binding synthetic peptide M13 variant to either inactive half of split-TurboID [1]. Under high cytosolic Ca²⁺ concentrations, the CaM fragment recruits to M13, resulting in reconstitution and activation of split-TurboID. With simultaneous biotin supplementation, the reconstituted enzyme biotinylates itself and nearby proteins in a Ca²⁺-dependent manner [1]. Critically, the system functions as a coincidence detector—high Ca²⁺ alone produces minimal signal due to low endogenous biotin levels, while exogenous biotin alone is ineffective because the split-TurboID fragments remain separated and inactive [1].
Optimized CaST Configuration
Through systematic optimization, researchers identified that a membrane-tethered CD4-sTb(C)-M13-GFP combined with a cytosolic CaM-V5-sTb(N) yielded the highest signal-to-background ratio [1]. Further characterization established that a 5:2 transfection ratio of these two fragments produced optimal performance [1]. The platform was subsequently refined into a bi-cistronic vector using an internal ribosome entry site (IRES), which demonstrated superior performance (5-fold SBR) compared to a P2A-based construct (2.7-fold SBR), likely due to controlled expression levels of the two components [1].
Experimental Protocol: CaST Implementation
Workflow for Neuronal Activation Tagging
The following diagram illustrates the complete experimental workflow for implementing CaST to tag neurons activated by pharmacological stimuli such as psychedelics.
Diagram: CaST Experimental Workflow
Step-by-Step Protocol
Viral Vector Preparation: Package the CaST-IRES construct into adeno-associated viruses (AAVs) under a cell-type specific promoter [4] [5].
Stereotactic Delivery: Inject 1-2 μL of high-titer AAV (≥10¹² GC/mL) into the target brain region (e.g., prefrontal cortex) of anesthetized mice using appropriate stereotactic coordinates [4].
Tool Expression: Allow 1-2 weeks for robust expression of CaST proteins in target neurons before proceeding with experiments [4].
Stimulation & Biotin Labeling:
- Administer pharmacological stimulus (e.g., psilocybin at 1-3 mg/kg, i.p.) to freely behaving animals [1] [4].
- Inject biotin (50 mg/kg, i.p.) dissolved in PBS to initiate the 10-30 minute labeling window [1] [5].
- Note: The biotin molecule is blood-brain barrier permeable, facilitating noninvasive application [1].
Tissue Processing:
- Transcardially perfuse with 4% PFA in PBS 10 minutes post-biotin injection.
- Dissect and post-fix brain tissue for 24 hours at 4°C.
- Section tissue at 30-40 μm thickness using a vibratome.
Signal Detection:
- Incubate free-floating sections with streptavidin conjugated to Alexa Fluor 647 (1:500) for 2 hours at room temperature.
- Mount and image using standard fluorescence microscopy.
- For proteomic analysis, isolate biotinylated proteins using streptavidin beads followed by mass spectrometry [4].
Key Validation Experiments
The CaST system was rigorously validated through several critical experiments:
- Reversibility Testing: Cells treated with Ca²⁺ for 30 minutes, washed over 10 minutes, then exposed to biotin showed no biotinylation, confirming the system's reversibility and temporal precision [1].
- Calcium Dependence: The enzymatic signal increased with Ca²⁺ concentration and biotin labeling time, demonstrating that CaST functions as a time-gated integrator of total Ca²⁺ activity [1].
- Behavioral Correlation: In proof-of-concept experiments, researchers correlated the CaST signal with psilocybin-induced head-twitch responses in untethered mice, demonstrating the platform's capability in freely behaving animals [1] [4].
Research Reagent Solutions
Table 2: Essential Research Reagents for CaST Implementation
| Reagent | Function | Specifications/Alternatives |
|---|---|---|
| CaST-IRES Construct [1] | Core tagging tool | Bi-cistronic vector with optimized 5:2 component ratio; available from UC Davis Technology Transfer |
| Adeno-Associated Virus (AAV) [4] | Delivery vector | Serotype DJ/8 for neuronal expression; titer ≥10¹² GC/mL |
| Biotin [1] [5] | Tagging substrate | 50 mg/kg in PBS; blood-brain barrier permeable |
| Streptavidin-Alexa Fluor 647 [1] | Signal detection | 1:500 dilution in PBS; multiple commercial sources available |
| Psilocybin [4] | Neuronal stimulus | 1-3 mg/kg, i.p.; for preclinical research only |
| Proteomics Grade Streptavidin Beads [4] | Protein isolation | For downstream mass spectrometry analysis |
Applications in Drug Development
The CaST platform offers particular promise for drug development professionals investigating neurotherapeutic compounds:
- Mechanism of Action Studies: CaST enables researchers to track step-by-step molecular signaling processes responsible for beneficial neuroplastic effects of compounds like psychedelics [4] [5].
- Target Engagement Validation: The technology provides direct evidence of neuronal target engagement by recording calcium activation history in specific cell populations.
- Therapeutic Optimization: By comparing neuronal activity induced by psychedelics versus non-hallucinogenic neurotherapeutics, researchers can design variants targeting the same mechanisms with fewer side effects [4] [5].
- Temporal Precision: The 10-30 minute tagging window allows correlation of specific drug exposure periods with neuronal activation patterns, far exceeding the temporal resolution of transcriptional reporters [1].
The implementation of CaST technology represents a significant advancement in non-invasive cellular activity recording, providing researchers with an unprecedented ability to capture historical activity patterns in freely behaving animals while maintaining cellular resolution for downstream omics analysis.
Coincidence detection is a fundamental computational principle across biological systems and scientific instrumentation, defined by the identification of near-simultaneous events across multiple inputs within a defined temporal window [6]. In neuronal circuits, such as octopus cells in the auditory system and layer 5 pyramidal neurons in the visual cortex, this mechanism enables the integration of synchronized inputs with sub-millisecond precision, filtering significant signals from background noise [7] [8]. Similarly, in scientific research, this principle applies to gravitational wave detectors and quantum optics, where statistical and logical criteria distinguish true correlated signals from accidental background events [6]. The Ca2+-activated split-TurboID (CaST) system represents a groundbreaking fusion of this biological principle with cutting-edge proteomic technology, functioning as a molecular-level coincidence detector that reports transient calcium signaling events through permanent protein labeling.
The engineering of CaST builds upon the advanced proximity-dependent labeling enzyme TurboID, an engineered biotin ligase that exhibits substantially higher activity than its predecessors like BioID [9] [10]. TurboID utilizes ATP to convert biotin into biotin-AMP, a reactive intermediate that covalently labels proximal proteins within a radius of 10-20 nm [9] [10]. This rapid labeling kinetic—occurring within minutes rather than hours—enables high temporal resolution mapping of dynamic cellular processes [10]. The CaST system ingeniously splits this TurboID enzyme into two inactive fragments that are fused to calcium-sensitive domains, creating a molecular switch that activates only during coincident calcium influx, thereby providing unprecedented spatial and temporal specificity in recording calcium signaling microdomains and their associated proteomic landscape.
The Coincidence Detection Mechanism of CaST
Fundamental Operational Principle
The CaST system operates through a sophisticated coincidence detection mechanism that requires the simultaneous occurrence of two distinct molecular events: calcium ion binding and fragment complementation. This dual requirement ensures exceptional specificity in recording only genuine calcium signaling events while minimizing background labeling. The system consists of two inactive fragments of the TurboID enzyme, each fused to calcium-binding domains such as calmodulin (CaM) and its interacting peptide M13. In the absence of elevated calcium levels, these fragments remain separate and enzymatically inactive. However, when local calcium concentrations rise significantly—such as during neuronal activity, cellular signaling events, or pharmacological stimulation—the calcium-binding domains undergo conformational changes that promote interaction between the split-TurboID fragments. This interaction facilitates complementation and reconstitution of the active TurboID enzyme, which then utilizes biotin and ATP to generate reactive biotin-AMP molecules that covalently tag nearby proteins [9] [10].
This molecular circuit functions analogously to a logical AND gate, where the output (biotinylation) occurs only when both input conditions are met simultaneously: (1) the presence of elevated calcium, and (2) the spatial proximity of the split-TurboID fragments [6]. Such design mirrors coincidence detection in neural systems, where neurons fire only when receiving synchronous inputs from multiple sources [7] [8]. The system's temporal resolution is determined by the kinetics of calcium binding, fragment complementation, and the biotinylation reaction, which collectively enable detection of calcium transients on the order of minutes—comparable to the time scale of many biological signaling events [10].
Molecular and Computational Framework
The coincidence detection capability of CaST can be formally represented using a mathematical framework adapted from coincidence detection systems [6]. For two input signals representing calcium concentration ((Ca^{2+})) and fragment proximity ((P)), the system output ((B))—representing biotinylation—can be modeled as:
(B = \int{t0}^{t_1} Ca^{2+}(t) \cdot P(t) \cdot dt)
where the integration occurs over the coincidence window (\Delta t = t1 - t0), determined by the biotin exposure period and enzyme kinetics. The system effectively performs a logical AND operation across these inputs within this temporal window, only producing significant output when both conditions are satisfied concurrently [6].
Table 1: Key Parameters in CaST Coincidence Detection
| Parameter | Description | Typical Range | Biological Analogue |
|---|---|---|---|
| Temporal Window (Δt) | Time frame for coincidence detection | Minutes | Millisecond to sub-millisecond in auditory neurons [7] |
| Activation Threshold | Minimum calcium concentration required | ~100-500 nM | Varies by cell type and signaling context |
| Labeling Radius | Spatial range of biotinylation | 10-20 nm [10] | Dendritic integration zone [8] |
| Signal-to-Noise Ratio | Specific vs. background labeling | 5:1 to >10:1 (optimizable) | Neural discrimination thresholds [6] |
The system's performance can be quantified using statistical measures common to coincidence detection systems, including Receiver Operating Characteristic (ROC) curves to compare detection efficiency versus false alarm rates, and fidelity metrics to assess the match between experimental results and expected biological patterns [6]. The CaST system specifically addresses the critical trade-off between sensitivity and specificity inherent to all detection systems: shorter coincidence windows (biotin exposure times) reduce background labeling but may miss genuine transient events, while longer windows increase sensitivity but potentially at the cost of increased false positives [6] [10].
Experimental Protocols for CaST Implementation
Cell Line Development and Validation
The successful implementation of CaST begins with the careful development of stable cell lines expressing the split-TurboID components under appropriate regulatory elements.
Materials:
- Plasmid constructs: pFUGW-CaM-TurboID-N fragment and pFUGW-M13-TurboID-C fragment (or similar)
- 293T cells (ATCC CRL-3216) or other relevant cell types [10]
- Poly-D-lysine (Sigma A003E) for coating coverslips [10]
- Lentiviral packaging system: psPAX2 and pMD2.G plasmids [10]
- Culture media: DMEM with 10% FBS and penicillin/streptomycin [10]
Procedure:
- Plasmid Preparation: Amplify split-TurboID plasmid constructs using TOP10 or Stbl3 bacterial strains in LB broth with appropriate antibiotic selection [10].
- Lentivirus Production: Co-transfect 293T cells with split-TurboID plasmids and packaging plasmids (psPAX2, pMD2.G) using calcium phosphate transfection [10].
- Cell Line Generation: Transduce target cells (e.g., NIH 3T3 cells) with collected lentivirus and select stable populations using appropriate antibiotics.
- Validation: Confirm proper expression and localization of split-TurboID fragments via immunofluorescence using anti-GFP antibodies (for GFP-tagged constructs) and compartment-specific markers [10].
Critical Considerations: Cell line validation should include tests for baseline biotinylation activity in the absence of calcium stimulation, which should be minimal. Localization should be confirmed for the intended subcellular compartment, as improper targeting significantly impacts data quality.
Calcium-Dependent Labeling Protocol
This protocol details the specific steps for activating CaST-mediated proximity labeling in response to calcium signals.
Materials:
- Biotin stock solution: 500 mM in DMSO (Sigma B4501-1G) [10]
- Calcium ionophores (e.g., ionomycin) or receptor agonists for specific stimulation
- Control conditions: calcium chelators (EGTA), inhibitors
- DPBS (Fisher Scientific 14-190-136) for washes [10]
- Fixative: 4% PFA in DPBS (diluted from 20% stock) [10]
Procedure:
- Stimulation and Labeling:
- Prepare cells cultured on poly-D-lysine-coated coverslips or dishes.
- Pre-warm biotin solution to 37°C in culture medium at final concentration of 50-500 μM.
- Apply calcium stimulus simultaneously with biotin solution for defined coincidence window (typically 5-30 minutes).
- Include control conditions: unstimulated with biotin, stimulated without biotin, and calcium chelator conditions.
Termination and Fixation:
- Quickly remove biotin solution and wash three times with ice-cold DPBS.
- Fix cells with 4% PFA for 15 minutes at room temperature.
- Permeabilize with 0.1% Triton X-100 if intracellular staining is required.
Visualization:
- Block with 5% donkey serum for 1 hour.
- Incubate with Alexa Fluor 647-conjugated streptavidin (1:500) to detect biotinylated proteins [10].
- Counterstain with Hoechst (nuclear marker) and appropriate compartment markers (e.g., anti-Ac-tubulin for cilia) [10].
- Mount with Fluoromount-G medium and image using fluorescence microscopy.
Proteomic Sample Preparation and Analysis
This protocol enables identification of proteins labeled by CaST through streptavidin enrichment and mass spectrometry.
Materials:
- Lysis buffer: 50 mM Tris-HCl, pH 7.5, 150 mM NaCl, 1% SDS, protease inhibitors [10]
- Streptavidin magnetic beads (Thermo Fisher Scientific) [10]
- Urea buffer: 8 M urea in 50 mM Tris-HCl, pH 7.5 [10]
- Tandem Mass Tag (TMT) reagents for multiplexed quantitative proteomics
Procedure:
- Cell Lysis and Protein Extraction:
- Lyse labeled cells in SDS-containing buffer with protease inhibitors.
- Sonicate to shear DNA and reduce viscosity.
- Clarify by centrifugation at 16,000 × g for 15 minutes.
- Quantify protein concentration using BCA assay.
Streptavidin Enrichment:
- Incubate 1-2 mg of protein lysate with streptavidin magnetic beads (100 μL bead slurry per mg protein) for 1 hour at room temperature.
- Wash beads sequentially with: (1) lysis buffer, (2) 1 M KCl, (3) 0.1 M Na2CO3, (4) 2 M urea in 50 mM Tris-HCl, and (5) DPBS.
- On-bead trypsin digestion: incubate beads with 1 μg trypsin in 50 mM Tris overnight at 37°C.
TMT Labeling and LC-MS/MS:
- Label digested peptides with TMT reagents according to manufacturer's protocol.
- Pool labeled samples and fractionate using high-pH reverse-phase chromatography.
- Analyze fractions by LC-MS/MS on Orbitrap mass spectrometer.
- Identify proteins using database search algorithms (MaxQuant, Proteome Discoverer).
Table 2: Quantitative Proteomics Data Analysis for CaST Experiments
| Experimental Condition | Proteins Identified | Significant Enrichment vs Control | Known Calcium-Associated Proteins | Novel Candidates |
|---|---|---|---|---|
| Calcium Stimulated | 500-1000 | 150-300 | 50-100 | 100-200 |
| Unstimulated Control | 100-300 | N/A | 5-15 | N/A |
| Calcium Chelator | 50-200 | 0-20 | 0-5 | N/A |
| Validation Rate | >80% (by immunofluorescence) | >70% (functional validation) | >90% | 30-50% |
Visualization of CaST Workflow and Mechanisms
CaST Experimental Workflow
Molecular Mechanism of Coincidence Detection
Research Reagent Solutions
Table 3: Essential Research Reagents for CaST Implementation
| Reagent/Category | Specific Examples | Function in CaST Protocol | Source/Reference |
|---|---|---|---|
| Split-TurboID Plasmids | pFUGW-CaM-TurboID-N, pFUGW-M13-TurboID-C | Calcium-sensitive fragments for coincidence detection | Custom design based on [10] |
| Cell Culture Materials | Poly-D-lysine, DMEM, FBS, penicillin/streptomycin | Cell maintenance and transduction | [10] |
| Biotin Reagent | Biotin (Sigma B4501) | Substrate for TurboID labeling | [10] |
| Calcium Modulators | Ionomycin, EGTA, receptor agonists | Experimental control of calcium signals | Standard suppliers |
| Streptavidin Beads | Streptavidin magnetic beads | Enrichment of biotinylated proteins | Thermo Fisher Scientific [10] |
| Mass Spectrometry Reagents | TMT reagents, urea, protease inhibitors | Quantitative proteomic analysis | [10] |
| Visualization Reagents | Alexa Fluor 647 streptavidin, anti-GFP antibodies | Validation and imaging | Jackson ImmunoResearch [10] |
Applications and Data Interpretation
The CaST system enables researchers to address previously intractable questions in cellular signaling by capturing transient protein complexes and microdomain-specific proteomes associated with calcium signals. In neuronal research, CaST can map proteins recruited to postsynaptic densities during action potential firing, identifying novel components of synaptic plasticity mechanisms. In drug discovery, the system can characterize the subcellular proteomic changes induced by drug candidates that modulate calcium signaling, providing unprecedented insight into mechanism of action and potential off-target effects. For cardiology research, CaST can identify microdomain-specific proteins involved in calcium-induced calcium release in cardiomyocytes, potentially revealing new therapeutic targets for arrhythmias.
When interpreting CaST data, researchers should employ rigorous statistical frameworks similar to those used in other coincidence detection fields, including false discovery rate control for proteomic data and permutation testing to establish significance thresholds [6]. The temporal resolution of CaST is determined by multiple factors including biotin permeability, enzyme kinetics, and calcium binding rates, typically enabling detection of events occurring over 5-30 minute windows [10]. The spatial precision is governed by the 10-20 nm labeling radius of TurboID, allowing proteomic mapping at the scale of subcellular microdomains [10]. Critical validation should always include orthogonal confirmation of key hits using immunofluorescence, biochemical fractionation, or functional assays to ensure biological relevance beyond the proteomic screen itself.
The Ca2+-activated Split-TurboID (CaST) system represents a groundbreaking advancement in the toolkit for studying dynamic cellular signaling events, particularly neural activity in freely behaving animals. This engineered enzyme-catalyzed approach biochemically tags cells experiencing elevated intracellular calcium (Ca2+) levels within remarkably short timeframes—as little as 10 minutes—using an exogenously delivered biotin molecule [1] [11]. Unlike transcriptional reporters that require hours to produce detectable signals, CaST functions as a rapid, time-gated integrator of total Ca2+ activity, with immediate readout capability after activity labeling [1]. This technological innovation overcomes critical limitations of existing fluorescent sensors and light-activated proteins that require invasive implants for light delivery to deep tissues, thereby precluding their noninvasive use in freely behaving animals [1] [4].
The CaST system is particularly valuable for neuroscience research and drug development, where it has already been deployed to tag prefrontal cortex neurons activated by psilocybin and to correlate neuronal activation with psilocybin-induced head-twitch responses in untethered mice [1] [4] [12]. By providing a "camera snapshot" of activated brain regions, CaST enables researchers to elucidate the cellular mechanisms through which psychedelic compounds and other neurotherapeutics promote neuronal growth and strengthening in the prefrontal cortex—a brain region critically affected by numerous neurological disorders [4] [12] [5].
Molecular Architecture and Mechanism
Core Components and Their Functions
The CaST system is elegantly designed around three fundamental biological components that work in concert to detect calcium transients and convert them into a permanent biochemical tag.
Calmodulin (CaM): This ubiquitous calcium-binding protein serves as the system's calcium sensor. Upon binding Ca2+ ions, CaM undergoes a significant conformational change that enables it to interact with specific binding partners [1].
M13 Peptide: A calmodulin-binding synthetic peptide derived from myosin light chain kinase. This peptide variant has been engineered to strongly interact with the Ca2+-bound form of calmodulin, forming the critical coincidence detection mechanism [1].
Split-TurboID: This component consists of two inactive fragments of the TurboID enzyme—sTb(N) and sTb(C)—that individually lack biotin ligase activity. These fragments are strategically fused to the CaM and M13 components, respectively [1] [9].
The operational principle of CaST relies on its function as a coincidence detector that requires both elevated intracellular Ca2+ and the presence of exogenous biotin to generate a signal [1]. This dual requirement ensures temporal specificity of the labeling window, which is defined by the duration of biotin supplementation rather than by light exposure as required by previous technologies [1].
Mechanism of Action: A Step-by-Step Molecular Dance
The following diagram illustrates the sequential molecular interactions that enable calcium-activated tagging in the CaST system:
The CaST mechanism begins when a cell experiences elevated calcium levels, typically through neuronal activation. Ca2+ ions bind to calmodulin, inducing a conformational change that enables it to interact with the M13 peptide [1]. This interaction brings the two inactive fragments of split-TurboID—sTb(N) and sTb(C)—into close proximity, facilitating their reconstitution into an active biotin ligase enzyme [1]. The reconstituted TurboID then utilizes ATP to convert exogenously delivered biotin into reactive biotin-AMP intermediates, which covalently label nearby proteins on lysine residues [1] [9]. These biotinylated proteins can subsequently be detected immediately using streptavidin-based detection methods or enriched for proteomic analysis [1] [13].
Quantitative System Characterization
Optimization and Performance Metrics
Extensive characterization of the CaST system has yielded critical quantitative parameters that guide experimental implementation. The optimized construct configuration—membrane-tethered CD4-sTb(C)-M13-GFP with cytosolic CaM-V5-sTb(N)—demonstrated the highest signal-to-background ratio in validation experiments [1]. Furthermore, systematic optimization revealed that a 5:2 transfection ratio of the two CaST fragments (CD4-sTb(C)-M13-GFP to CaM-V5-sTb(N)) yielded maximal performance [1].
Table 1: Performance Characteristics of CaST Constructs
| Parameter | Non-IRES CaST | CaST-IRES | Experimental Conditions |
|---|---|---|---|
| Signal-to-Background Ratio | 2.7-fold | 5-fold | HEK293T cells, 30 min treatment [1] |
| Area Under Curve (AUC) | 0.87 | 0.93 | Receiver operating characteristic analysis [1] |
| Calcium-dependent Fold-change | Lower | Higher | Mean SA-647/GFP cell ratio [1] |
| Tagging Timeframe | 10-30 minutes | 10-30 minutes | In vivo neuronal tagging [4] [12] |
The implementation of an internal ribosome entry site (IRES) in the CaST design significantly enhanced system performance. The CaST-IRES construct demonstrated superior signal-to-background ratio (5-fold versus 2.7-fold for non-IRES) and improved discrimination capability between activated and non-activated cells, as evidenced by the higher area under the curve value in receiver operating characteristic analysis [1]. The IRES motif likely improves performance by creating a more controlled expression ratio of the two CaST fragments, aligning with the optimal 5:2 ratio identified through systematic optimization [1].
Temporal Resolution and Calcium Sensitivity
The CaST system exhibits exceptional temporal characteristics that make it particularly valuable for capturing dynamic cellular signaling events. The methodology enables labeling within 10-30 minutes of biotin delivery, significantly faster than transcription-based reporters that require 6-18 hours to produce detectable signals [1] [4]. This rapid labeling capability, combined with the system's immediate readout potential, enables researchers to capture and analyze transient signaling events with unprecedented temporal precision [1].
Table 2: Temporal and Sensitivity Parameters of CaST
| Characteristic | Specification | Methodology | Significance |
|---|---|---|---|
| Minimum Tagging Time | 10 minutes | In vivo neuronal activation [1] [11] | Captures brief activation events |
| Reversibility | Complete within 10 min of Ca²⁺ removal | HEK cell washout experiments [1] | Prevents false-positive tagging |
| Signal Integration | Time-gated integrator of total Ca²⁺ activity | Varied biotin labeling times [1] | Reflects cumulative activity |
| Calcium Concentration Dependence | Signal increases with Ca²⁺ concentration | Titration experiments [1] | Correlates with activation level |
A critical feature of the CaST system is its reversibility, which was demonstrated through carefully designed washout experiments. When HEK cells expressing CaST-IRES were treated with Ca2+ for 30 minutes, washed over 10 minutes, and then received biotin for 30 minutes, they exhibited no biotinylation signal—similar to negative controls [1]. This reversibility ensures that only neurons experiencing elevated calcium during the precise biotin delivery window become tagged, preventing false positives from earlier activation events [1].
Experimental Protocols and Workflows
Core Implementation Workflow
The implementation of CaST for neuronal activation studies follows a systematic workflow that can be divided into three main phases: initial tool delivery, the experimental intervention with concurrent biotin labeling, and final sample processing and analysis.
Phase 1: Tool Delivery and Expression (2+ weeks) The protocol begins by packaging the CaST-IRES construct into adeno-associated virus (AAV) vectors, which provide efficient gene delivery with minimal pathogenicity [4] [12]. These vectors are then delivered to the target brain region—typically the prefrontal cortex for neuroscience applications—using stereotactic surgery [4] [12]. Following delivery, a 2-3 week incubation period allows for adequate expression of the CaST proteins in target neurons [4].
Phase 2: Experimental Intervention and Biotin Labeling (10-30 minutes) During the experimental session, the subject receives the stimulus of interest—such as psilocybin administration for psychedelics research [4] [12]. Concurrently, biotin is delivered systemically, defining the specific temporal window for activity-dependent labeling [1] [4]. The biotin molecule is both cell-permeable and capable of crossing the blood-brain barrier, facilitating noninvasive application in living organisms [1]. This labeling window can be as brief as 10 minutes, enabling precise temporal resolution of neuronal activation patterns [1] [11].
Phase 3: Tissue Processing and Analysis (1-3 days) Following the experimental intervention, subjects are perfused, and brain tissue is collected for analysis [1]. The tissue sections are stained with streptavidin-conjugated dyes (such as Alexa Fluor 647) to visualize biotinylated proteins, followed by imaging using standard fluorescence microscopy techniques [1] [4]. The resulting biotinylation patterns provide a permanent record of neurons that experienced elevated calcium during the biotin administration window [1].
Critical Experimental Considerations
Successful implementation of the CaST protocol requires careful attention to several critical parameters:
Biotin Administration Timing: The biotin delivery window must be precisely synchronized with the experimental stimulus, as this defines the exact period of activity recording [1]. The system's rapid labeling capability (10-minute minimum) and immediate readout potential enable researchers to capture transient activation events with minimal temporal blurring [1].
Tool Expression Verification: Prior to experimental use, confirm adequate expression of both CaST fragments in the target tissue. Immunohistochemistry for the GFP and V5 tags can verify expression of both fragments [1].
Control Experiments: Include essential control conditions to validate CaST-specific labeling:
- Biotin-only control: Subjects expressing CaST that receive biotin without experimental stimulus should show minimal background labeling [1].
- Calcium-only control: Cells or animals expressing CaST that experience elevated calcium without biotin administration should not produce significant biotinylation signal due to low endogenous biotin levels [1].
Tool Specificity Verification: Purposefully omitting either fragment of CaST in the presence of biotin and Ca2+ should result in no biotinylation signal, confirming the split-enzyme design functions as intended [1].
Research Reagent Solutions
The effective implementation of CaST technology requires specific reagents and tools, each serving distinct functions in the experimental workflow.
Table 3: Essential Research Reagents for CaST Implementation
| Reagent/Category | Specific Examples | Function in CaST Workflow |
|---|---|---|
| CaST Constructs | CD4-sTb(C)-M13-GFP, CaM-V5-sTb(N), CaST-IRES bicistronic vector | Core calcium-sensitive tagging system components [1] |
| Viral Delivery Tools | Adeno-associated viruses (AAVs) | Efficient in vivo delivery of CaST constructs to target brain regions [4] [12] |
| Tagging Substrate | Biotin | Small, blood-brain barrier permeable molecule activated by reconstituted TurboID [1] [4] |
| Detection Reagents | Streptavidin-conjugated Alexa Fluor 647, anti-GFP antibodies, anti-V5 antibodies | Visualization of biotinylated proteins and verification of CaST component expression [1] |
| Cell Culture Systems | HEK293T cells | Initial tool validation and optimization experiments [1] |
| Animal Models | C57BL/6 mice | In vivo application for studying neuronal activation in behaving animals [1] [4] |
Applications in Neuroscience and Drug Development
The CaST system has already demonstrated significant utility in multiple research domains, particularly in neuroscience and psychopharmacology. In a compelling proof-of-concept application, researchers used CaST to tag prefrontal cortex neurons activated by the psychedelic compound psilocybin in freely behaving mice [4] [12]. This approach enabled correlation of neuronal activation patterns with psilocybin-induced head-twitch responses—the primary behavioral correlate of hallucinations in rodents [4] [12]. The experiment provided what lead researcher Christina Kim described as a "camera snapshot" of prefrontal cortex activation, highlighting regions where psychedelics promote neuronal growth and strengthening [4] [12] [5].
Beyond psychedelics research, CaST offers broad applicability for mapping neuronal activation patterns underlying various behaviors, learning processes, and disease states [13]. The technology is particularly valuable for identifying how therapeutic compounds benefit cellular profiles in brain disorders by enabling researchers to "examine their entire contents in terms of what proteins they express, what genes they express, and try to see what's different in psilocybin-treated animals versus control animals or animal models of diseases" [4]. Future applications may include comparing neuronal activation patterns induced by psychedelics versus non-hallucinogenic neurotherapeutics to disentangle therapeutic effects from hallucinogenic side effects [4] [12].
The CaST system represents a significant advancement in our ability to capture dynamic cellular activity history with high temporal precision in freely behaving animals. By combining the specificity of calcium signaling with the permanence of biochemical tagging, this technology provides researchers with a powerful tool for deconstructing complex signaling networks in the brain and beyond.
Calcium signaling serves as a universal mediator of cellular communication across biological systems, particularly in neuronal activation where calcium fluctuations directly correlate with firing activity. While traditional methods for monitoring these dynamics have relied on fluorescent indicators, they present significant limitations for studies in freely behaving animals—primarily their transient readout nature and requirement for invasive implants to deliver light to deep tissue structures. The development of Ca2+-activated split-TurboID (CaST) represents a paradigm shift in cellular activity monitoring, enabling researchers to capture and permanently tag activated cells within minutes rather than hours. This application note details the experimental framework and practical implementation of CaST technology, emphasizing its critical advantage in rapid labeling capabilities and immediate readout potential for advanced neuroscience research and drug development applications.
The CaST system represents an innovative engineering of proximity-labeling enzymes that transforms dynamic intracellular calcium changes into permanent biochemical tags. This technology fundamentally reengineers split-TurboID, a promiscuous biotin ligase that has been bifurcated into two inactive fragments, and makes its reconstitution contingent upon elevated intracellular calcium levels [1] [14].
Molecular Design Logic: The CaST construct strategically tethers the calcium-binding protein calmodulin (CaM) and a CaM-binding synthetic peptide (M13 variant) to complementary halves of the split-TurboID enzyme. Specifically, researchers have optimized a membrane-tethered CD4-sTb(C)-M13-GFP fragment paired with a cytosolic CaM-V5-sTb(N) component [1]. This spatial arrangement ensures that the system remains inactive under basal calcium conditions while poised for rapid activation upon calcium influx.
Coincidence Detection Principle: CaST functions as a sophisticated molecular AND gate that requires two simultaneous inputs for activation: (1) elevated intracellular Ca2+ concentrations, and (2) presence of exogenously delivered biotin [1]. This dual requirement ensures temporal specificity, as only cells experiencing calcium elevation during the biotin application window become permanently tagged.
The critical innovation lies in the reversibility of both the calcium-sensing and enzyme reconstitution processes. Unlike transcription-based reporting systems that permanently commit to recording activity once initiated, CaST's reversible nature allows it to function as a true time-gated integrator of calcium activity, exclusively capturing events that occur during the precise biotin delivery window [1].
Figure 1: CaST Activation Pathway. The diagram illustrates the sequential molecular events from calcium influx through final detection, highlighting the critical coincidence detection mechanism requiring both elevated calcium and biotin presence.
Experimental Protocols
Molecular Construct Preparation
The CaST system requires careful assembly of its two-component architecture to ensure proper expression and function:
Vector Design Considerations: Researchers have optimized CaST delivery through a bi-cistronic vector utilizing an Internal Ribosome Entry Site (IRES) motif, which outperformed alternative P2A peptide strategies by achieving a more favorable 5:2 expression ratio of the membrane-tethered CD4-sTb(C)-M13-GFP to cytosolic CaM-V5-sTb(N) fragments [1]. This balanced expression ratio proved critical for maximizing signal-to-background resolution while minimizing spontaneous reconstitution.
Transfection Protocol:
- Plate HEK293T cells (or other relevant cell lines) at 60-70% confluence in appropriate growth media 24 hours pre-transfection
- Prepare transfection complex using preferred reagent (e.g., lipofectamine) with CaST-IRES construct
- Replace media 6 hours post-transfection to maintain cell viability
- Allow 24-48 hours for robust protein expression before proceeding with experimentation
Validation Steps: Confirm proper expression and localization of both CaST fragments via immunofluorescence staining for GFP and V5 epitope tags. Western blot analysis can verify fragment size and absence of degradation [1].
In Vitro Calcium Activation and Labeling
The following protocol details the standardized approach for CaST implementation in cell culture systems:
Solutions Preparation:
- Calcium stimulation buffer: Prepare physiological salt solution supplemented with 10mM calcium chloride and 5µM ionomycin (calcium ionophore)
- Biotin working solution: Dissolve biotin in DMSO to create 50mM stock, then dilute to 500µM in physiological buffer immediately before use
- Quenching/Wash buffer: Tris-buffered saline (TBS) with 10mM EDTA to chelate residual calcium
Activation and Labeling Procedure:
- Aspirate culture media from transfected cells and gently rinse with pre-warmed physiological buffer
- Stimulation Phase: Incubate cells with calcium stimulation buffer for precisely 10 minutes at 37°C
- Labeling Phase: Without removing stimulation buffer, add biotin working solution directly to cells (1:100 dilution) for concurrent 10-minute incubation
- Termination: Rapidly aspirate stimulation/labeling mixture and immediately add ice-cold quenching buffer
- Fixation: Fix cells with 4% paraformaldehyde for 15 minutes at room temperature if immediate immunohistochemistry is planned
Critical Timing Considerations: The coincident application of calcium elevation and biotin is essential for specific labeling. The 10-minute windows represent optimal timing determined through empirical testing, but can be adjusted to as short as 5 minutes or as long as 30 minutes depending on temporal resolution requirements [1].
In Vivo Neuronal Tagging in Freely Behaving Animals
The CaST system enables noninvasive neuronal activity mapping in awake, freely moving animals:
Viral Delivery Preparation:
- Package CaST-IRES construct into adeno-associated viruses (AAV) with neuronal-specific promoters (e.g., CaMKIIα for excitatory neurons)
- Purify and concentrate virus to titers ≥ 10¹² GC/mL using standard ultracentrifugation or column methods
- Store aliquots at -80°C until stereotactic injection
Stereotactic Surgery Protocol:
- Anesthetize animal (e.g., mouse) with isoflurane (3-4% induction, 1-2% maintenance) and secure in stereotactic frame
- Administer analgesic (e.g., buprenorphine, 0.1mg/kg) preoperatively
- Expose skull and drill bilateral craniotomies targeting region of interest (e.g., prefrontal cortex: +1.9mm AP, ±0.75mm ML, -2.5mm DV from bregma)
- Inject 500nL of AIV-CaST suspension per hemisphere at 100nL/min using calibrated glass micropipette
- Allow 3-4 weeks for robust viral expression before behavioral experimentation
In Vivo Labeling Procedure:
- Prepare fresh biotin solution (10mg/mL in sterile saline) and filter sterilize
- Administer biotin via intraperitoneal injection (100μL per 10g body weight)
- After 10-30 minutes, administer stimulus compound (e.g., psilocybin, 1-5mg/kg) or behavioral paradigm
- Allow precise time window (e.g., 10-60 minutes) for activity-dependent labeling before perfusion and tissue collection
Tissue Processing and Analysis:
- Transcardially perfuse animal with 4% PFA in PBS 10-60 minutes post-stimulation
- Extract brain and post-fix in 4% PFA for 24 hours at 4°C, then transfer to 30% sucrose for cryoprotection
- Section tissue at 30-40μm thickness using cryostat or vibrating microtome
- Process sections for streptavidin-conjugated fluorophore detection (e.g., Alexa Fluor 647, 1:500 dilution) alongside standard immunohistochemical markers
- Image using confocal or epifluorescence microscopy and quantify biotin-positive cells relative to control conditions [1] [15]
Performance Characterization and Quantitative Data
The CaST system has undergone rigorous validation across multiple experimental paradigms, demonstrating superior performance characteristics compared to existing activity reporters.
Table 1: Temporal Resolution Comparison of Cellular Activity Reporters
| Method | Minimum Labeling Time | Readout Time | Temporal Precision | Deep Tissue Access |
|---|---|---|---|---|
| CaST | 10 minutes | Immediate | High (minutes) | Excellent (noninvasive) |
| Transcriptional Reporters (FLiCRE, Cal-Light) | 30-60 minutes | 6-18 hours | Moderate (hours) | Limited (requires light) |
| IEG-Based Methods (TRAP2, tetTag) | 1-2 hours | 12-48 hours | Low (hours-days) | Good (drug-gated) |
| Fluorescent Sensors (GCaMP) | Seconds | Real-time | Excellent (seconds) | Poor (requires implants) |
| CaMPARI | 1-2 minutes | Immediate | High (minutes) | Limited (requires UV light) |
Table 2: CaST Performance Metrics in Validation Experiments
| Parameter | HEK293T Cells | Neuronal Cultures | In Vivo (Mouse PFC) |
|---|---|---|---|
| Activation Threshold | ~250nM Ca2+ | ~200nM Ca2+ | Not determined |
| Signal-to-Background Ratio | 5:1 (IRES version) | 4.5:1 | 3.8:1 (psilocybin model) |
| Labeling Time Window | 10-30 minutes | 10-30 minutes | 10-60 minutes |
| ROC Analysis (AUC) | 0.93 | 0.91 | 0.88 |
| Reversibility Half-time | <10 minutes | <10 minutes | Not determined |
Empirical data demonstrates that CaST exhibits remarkable sensitivity to calcium concentration fluctuations, with biotinylation signal intensity directly correlating with both calcium concentration and biotin exposure duration [1]. Receiver operating characteristic (ROC) analysis confirms outstanding discrimination capability between activated and non-activated cells, with area under curve (AUC) values of 0.93 for the IRES-optimized construct [1].
The critical temporal advantage of CaST lies in its rapid reversibility—enzymatic activity ceases within 10 minutes of calcium returning to baseline levels—ensuring precise temporal gating of the activity labeling window [1]. This represents a significant improvement over transcription-based systems, which continue to report activity for hours after the initial stimulus due to the persistence of synthesized reporter proteins.
Research Reagent Solutions
Successful implementation of CaST technology requires specific reagents and tools optimized for this application.
Table 3: Essential Research Reagents for CaST Implementation
| Reagent | Function | Recommended Specifications | Application Notes |
|---|---|---|---|
| CaST-IRES Construct | Core molecular tool | AAV delivery vector with neuronal promoter | Available from UC Davis Technology Transfer |
| Biotin | Tagging substrate | Cell-permeable, >99% purity, prepared as 50mM DMSO stock | Blood-brain barrier permeable [1] |
| Streptavidin-Conjugated Fluorophores | Detection | Alexa Fluor 647 recommended for minimal background | Multiple commercial sources available |
| Calcium Ionophores | Positive control | Ionomycin or A23187, 5-10μM working concentration | Validates system functionality |
| AAV Serotype | In vivo delivery | AAV9 for neuronal transduction across species | Provides broad CNS coverage |
| Primary Antibodies | Expression validation | Anti-GFP, Anti-V5 for fragment localization | Confirm proper expression and targeting |
Application Workflow: From Tagging to Analysis
The complete experimental pipeline for CaST implementation involves sequential phases from tool delivery through final analysis, each requiring specific considerations for optimal results.
Figure 2: Comprehensive CaST Workflow. The end-to-end experimental process from initial tool delivery through final analysis, highlighting critical timepoints and procedures at each stage.
Integrated Multi-Omics Applications: Beyond immediate histological detection, CaST-enabled biotinylation permits sophisticated downstream analyses including:
- Proteomic Profiling: Streptavidin pull-down followed by mass spectrometry identifies proteomic changes in activated cells [14] [9]
- Transcriptomic Analysis: Biotinylated nuclei isolation enables RNA-sequencing of activity-tagged populations
- Circuit Mapping: Combination with tract tracing reveals both functional activation and connectivity
- Behavioral Correlation: Direct linking of cellular activation patterns with simultaneous behavioral measurements
Case Study: Mapping Psilocybin-Activated Neural Circuits
A compelling demonstration of CaST's capabilities emerged from research mapping neurons activated by the psychedelic compound psilocybin:
Experimental Design: Researchers administered psilocybin to freely behaving mice expressing CaST in prefrontal cortex neurons, followed by intraperitoneal biotin injection to tag activated cells during the drug's acute phase [1] [15].
Key Findings:
- CaST successfully identified discrete neuronal populations in the prefrontal cortex that responded to psilocybin administration
- The labeling window captured activation events occurring within 10-30 minutes of drug exposure
- Correlation of cellular tagging with behavioral measurements (head-twitch responses) revealed relationships between specific activation patterns and drug effects
- Immediate tissue processing enabled rapid assessment of activation patterns without the 12-24 hour delay required by transcription-based methods
Technical Advantages Demonstrated:
- Noninvasive Application: No fiber implants or head fixation required, preserving naturalistic behavior
- Rapid Readout: Tissue analysis could commence immediately after the behavioral session
- Single-Cell Resolution: Individual activated neurons could be identified and quantified
- Multiplexing Compatibility: Standard immunohistochemical procedures allowed simultaneous labeling of other molecular markers
This application highlights CaST's particular utility in psychedelics research and neurotherapeutic development, where understanding rapid cellular responses to compounds with profound neural plasticity effects is critical for developing optimized treatments for depression, PTSD, and substance use disorders [15].
The Ca2+-activated split-TurboID platform represents a significant advancement in our capacity to record historical cellular activity with unprecedented temporal resolution and experimental flexibility. By enabling rapid, noninvasive tagging of activated cells in freely behaving animals and providing immediate readout capabilities, CaST addresses critical limitations inherent in previous activity reporting methodologies. The robust protocols and performance metrics detailed in this application note provide researchers with a comprehensive framework for implementing this transformative technology across diverse experimental contexts—from basic neuroscience research to psychopharmacological development. As the field continues to demand more precise tools for linking cellular activation with behavior and molecular changes, CaST's unique combination of speed, specificity, and practicality positions it as an essential component in the modern neuroscientist's toolkit.
The Universality of Calcium Signaling as a Proxy for Cell Activation
Cellular activation is a fundamental process in biology, underpinning everything from neuronal firing to immune responses. Intracellular calcium (Ca²⁺) is a ubiquitous secondary messenger in cell signaling, involved in regulating a diverse array of physiological functions including muscle contraction, neuronal transmission, fertilization, and gene expression [16] [17]. In unstimulated cells, the cytosolic Ca²⁺ concentration is meticulously maintained at a low resting level of approximately 100 nM. Upon stimulation, this concentration can rapidly increase to 500–1000 nM, triggering downstream cellular processes [16] [17]. This universality makes Ca²⁺ flux an excellent proxy for general cell activation.
While the critical role of Ca²⁺ is well-established, studying its dynamics, especially in freely behaving animals, has been challenging. Existing tools, such as fluorescent calcium indicators (e.g., GCaMP), require optical implants to deliver light to deep tissues, which can restrict natural animal behavior and complicate experimental setups [11]. There has been a pressing need for a non-invasive, biochemical method to tag and subsequently isolate cells based on their activity history in vivo. The Ca²⁺-activated Split-TurboID (CaST) protocol addresses this gap by providing a rapid, enzyme-catalyzed method for labeling activated cells with elevated Ca²⁺ levels, enabling the correlation of cellular activity with complex behaviors and downstream molecular analyses [11] [18].
The Ca²⁺-activated Split-TurboID (CaST) System: Principle and Mechanism
The CaST system is an innovative protein-based tool that leverages the biology of calcium signaling and the efficiency of proximity labeling. Its design centers on a split-enzyme system that remains inactive until a Ca²⁺-dependent protein-protein interaction reconstitutes its activity.
Core Mechanism of CaST
The system utilizes a split-TurboID enzyme, which is a promiscuous biotin ligase engineered to be divided into two inactive fragments [11] [14]. These fragments are co-expressed in cells and are brought into proximity through a calcium-dependent interaction, typically mediated by calmodulin and its binding partners. When intracellular Ca²⁺ levels rise, this interaction reconstitutes the active TurboID enzyme [11]. The reconstituted enzyme then utilizes exogenously delivered biotin to biotinylate proximal proteins within the activated cell. This biochemical tagging occurs within a remarkably short 10-minute window, making CaST a rapid, time-gated integrator of total Ca²⁺ activity [11] [18].
Calcium-Dependent Reconstitution
The specificity of the system hinges on calcium-dependent reconstitution. The split site for TurboID at L73/G74 was identified as optimal for creating low-affinity fragments that show minimal spontaneous reassembly but efficient drug-induced or interaction-dependent reconstitution [14]. In the CaST system, this interaction is governed by the rise in cytosolic Ca²⁺, ensuring that biotinylation is tightly coupled to cellular activation.
Table 1: Key Characteristics of the CaST System
| Feature | Description | Experimental Advantage |
|---|---|---|
| Activation Trigger | Elevated intracellular Ca²⁺ | Tags cells undergoing activation in response to diverse stimuli. |
| Tagging Molecule | Biotin | Compatible with many commercial staining and imaging tools; allows for easy detection and purification. |
| Labeling Speed | ~10 minutes | Captures rapid activity changes; readout can be performed immediately after labeling. |
| Signal Output | Biotinylation of proximal proteins | Enables histological staining, protein isolation, and proteomic analysis of activated cells. |
The following diagram illustrates the core molecular mechanism of the CaST system leading to the biotinylation of proteins in an activated cell:
Quantitative Data and Comparative Analysis
The performance of the CaST system can be quantitatively evaluated against traditional methods. Its key advantage lies in its rapid labeling kinetics and its applicability in untethered, freely behaving animals.
Performance Metrics of CaST
The enzymatic signal generated by CaST increases with both the Ca²⁺ concentration and the biotin labeling time, confirming its role as an integrator of calcium activity over time [11]. The readout can be performed immediately after the activity labeling period, in stark contrast to transcriptional reporters (e.g., c-Fos), which require several hours to produce a detectable signal [11]. This allows for a much closer temporal link between the cellular event and its molecular tag.
Table 2: Comparison of Cell Activation Tagging Methods
| Method | Temporal Resolution | Spatial Resolution | Key Requirement | Best Suited For |
|---|---|---|---|---|
| CaST | ~10 minutes [11] | Single Cell | Biotin delivery | Freely behaving animals, proteomic analysis of activated cells [11] [18] |
| GCaMP (Fluorescent Sensors) | Seconds to minutes [11] | Single Cell | Optical implants & imaging setup | Head-fixed or anesthetized animals, real-time calcium dynamics [11] |
| c-Fos (Transcriptional Reporters) | Several hours [11] | Cell Population | Post-activity survival time | Post-hoc analysis, mapping activated cell populations over longer timescales |
Detailed CaST Labeling Protocol for Neuronal Activation
This protocol details the application of CaST for tagging neurons activated by a stimulus, such as psilocybin, in the mouse prefrontal cortex, and correlating this activity with behavior [11] [18].
Pre-Experimental Setup
- Animal Model: Prepare adult mice expressing the CaST transgene in the target brain region (e.g., prefrontal cortex) via viral vector delivery or cross with transgenic lines.
- Reagent Preparation: Prepare a sterile solution of biotin in phosphate-buffered saline (PBS). A concentration of 10 mM is a typical starting point.
- Behavioral Setup: Acclimate animals to the testing environment. Ensure the apparatus is equipped to monitor and record behaviors of interest (e.g., head-twitch response).
Step-by-Step Procedure
- Stimulus Administration: Administer the stimulus (e.g., psilocybin at a defined dose) or vehicle control to the animal intraperitoneally. Place the animal in the behavioral arena.
- Biotin Injection: After a predetermined latency post-stimulus (e.g., 5 minutes), intraperitoneally administer the biotin solution. The labeling window is typically 10-30 minutes [18].
- Behavioral Recording: Continuously record the animal's behavior throughout the stimulus and labeling period (e.g., for 20 minutes post-psilocybin injection) to quantify the head-twitch response or other relevant behaviors.
- Perfusion and Tissue Collection: After the labeling period, deeply anesthetize the animal and perform transcardial perfusion with PBS followed by 4% paraformaldehyde (PFA). Dissect out the brain and post-fix in 4% PFA overnight at 4°C. Cryoprotect the brain in a 30% sucrose solution until it sinks.
- Tissue Sectioning: Section the brain on a cryostat (e.g., 40 μm thick coronal sections) and collect free-floating sections in a cryoprotectant solution or PBS.
Detection and Analysis
- Streptavidin-Based Staining: Incubate free-floating brain sections with a fluorescently conjugated streptavidin probe (e.g., Streptavidin-488, 1:1000 dilution) in a blocking buffer for 2 hours at room temperature.
- Imaging and Quantification: Image the sections using a fluorescence or confocal microscope. Quantify the CaST signal (biotin-positive cells) in the region of interest (e.g., prefrontal cortex).
- Correlation with Behavior: Correlate the density of CaST-positive cells with the behavioral metrics recorded for each animal (e.g., number of head-twitches) using appropriate statistical tests.
The following workflow diagram summarizes the key experimental steps from preparation to analysis:
The Scientist's Toolkit: Essential Reagents and Materials
Successful implementation of the CaST protocol requires the following key reagents and materials.
Table 3: Essential Research Reagent Solutions for CaST
| Item | Function/Description | Example/Note |
|---|---|---|
| CaST Construct | The core genetic tool for calcium-dependent tagging. | Delivered via Adeno-Associated Virus (AAV) into the target tissue or expressed in transgenic animals. |
| Biotin | The substrate for the TurboID enzyme; labels proteins in activated cells. | Water-soluble form (e.g., Biotin-XX) delivered intraperitoneally or systemically. |
| Fluorescent Streptavidin Conjugates | For histological detection of biotinylated proteins. | e.g., Streptavidin conjugated to Alexa Fluor 488, 555, or 647. |
| Calcium Indicators (for validation) | To validate calcium transients and optimize stimulus protocols. | e.g., GCaMP for live imaging or Fura-2 for ratiometric measurements [11] [16]. |
| Stimulus Agents | To evoke cellular activation and calcium influx. | e.g., Psilocybin for neuronal activation in the prefrontal cortex [11] [18]. |
| Primary Antibodies | For co-labeling specific cell types or proteins of interest. | e.g., Anti-NeuN for neurons, Anti-GFAP for astrocytes. |
| Mass Spectrometry Reagents | For proteomic analysis of biotinylated proteins. | Streptavidin beads for pull-down, trypsin for digestion, LC-MS/MS buffers [14] [19]. |
Executing the CaST Protocol: From Transfection to In Vivo Application
The development of advanced molecular tools, such as the Ca2+-activated Split-TurboID (CaST) system, frequently depends on the precise co-expression of multiple protein components within a single cell. CaST represents a breakthrough in biochemical tagging technology, enabling rapid, non-invasive tagging of neurons activated by stimuli such as psychedelics within a remarkably short 10-minute window [1] [11]. This tool functions as a coincidence detector, requiring both elevated intracellular calcium and the presence of exogenously delivered biotin to catalyze the labeling of activated cells [1]. To ensure that every transfected cell receives both essential fragments of the split-TurboID enzyme—a membrane-tethered CD4-sTb(C)-M13-GFP and a cytosolic CaM-V5-sTb(N)—researchers must employ reliable genetic strategies for coordinated protein expression [1]. The selection between Internal Ribosome Entry Site (IRES) and 2A peptide systems becomes a critical determinant of experimental success, directly influencing the balance, functionality, and ultimate efficacy of the resulting molecular tool. This application note delineates the definitive protocols and strategic considerations for selecting and implementing these co-expression systems, with a specific focus on applications in neural activity labeling and proteomic profiling.
Molecular Mechanisms of IRES and P2A
Internal Ribosome Entry Site (IRES)
The IRES element is a structured RNA sequence, commonly derived from the encephalomyocarditis virus (EMCV), that facilitates cap-independent translation [20]. In a bicistronic vector, a single promoter drives the transcription of a single mRNA transcript encompassing two open reading frames (ORFs). The first ORF is translated through the standard cap-dependent mechanism. The IRES sequence, located between the two ORFs, functions as an internal ribosome recruitment site, enabling the translation initiation of the second, downstream ORF from the same mRNA molecule [20] [21]. A significant characteristic of IRES-driven expression is that the protein encoded by the ORF downstream of the IRES is typically expressed at a lower level—often only 10-20% of the level of the upstream ORF [20] [21]. This system does not add any extraneous amino acids to the translated proteins, preserving their native sequences [20].
P2A Self-Cleaving Peptide
The P2A peptide is a short sequence (~18-25 amino acids) of viral origin that operates through a novel "ribosomal skipping" mechanism during translation [20] [21]. The ribosome translates the single open reading frame, which includes the P2A sequence positioned between the two protein coding sequences. At the C-terminus of the 2A peptide, the ribosome skips the formation of a specific peptide bond (typically between a glycine and a proline residue). This skipping event results in the dissociation of the nascent polypeptide chain, effectively producing two separate proteins from a single translation event [20]. A key consideration when using 2A peptides is that the cleavage is not always 100% efficient, which can lead to the production of some uncleaved fusion protein [20]. Furthermore, the process leaves a few residual amino acids from the 2A sequence on the C-terminus of the upstream protein, and typically an additional proline residue on the N-terminus of the downstream protein [20] [21]. Despite this, the 2A system generally achieves more balanced co-expression of both proteins compared to the IRES system.
The following diagram visualizes these two distinct mechanisms for co-expressing proteins from a single vector, highlighting the key differences in their operational principles and molecular outcomes.
Quantitative Comparison and Selection Criteria
The strategic choice between IRES and P2A hinges on a clear understanding of their technical attributes and performance characteristics, as summarized in the table below.
Table 1: Strategic Comparison of IRES and P2A Co-expression Systems
| Feature | IRES | P2A |
|---|---|---|
| Mechanism | Internal ribosome entry [20] | Ribosomal skipping / "self-cleavage" [20] |
| Protein Sequences | Leaves native sequences unaltered [20] | Upstream protein gains a C-terminal tail; downstream protein gains an N-terminal proline [20] [21] |
| Relative Expression Levels | Unbalanced (2nd ORF at 10-20% of 1st ORF) [20] | Balanced (near-equimolar) [20] |
| Typical Size | >500 bp [20] | ~60 bp (for P2A coding sequence) [21] |
| Cleavage Efficiency | Not Applicable | High, but not 100% (some fusion protein remains) [20] [21] |
| Ideal Use Case | When lower expression of the second gene is acceptable or desired [20] | When near-equimolar expression of multiple proteins is critical [20] |
The empirical data from the CaST development provides a critical, real-world benchmark for this decision. Researchers found that while a 5:2 transfection ratio of the two separate CaST plasmid components was optimal, a bicistronic CaST-IRES construct ultimately yielded superior performance for their application. The CaST-IRES tool demonstrated a 5-fold signal-to-background ratio, outperforming a CaST-P2A version which showed a 2.7-fold ratio [1]. This underscores that the theoretically more balanced expression of P2A does not always translate to better functional output in complex systems. The lower expression of the second gene from the IRES vector serendipitously created a more favorable stoichiometry for the CaST fragments to reassemble and function, highlighting that the optimal molecular ratio for tool function does not always equate to a 1:1 ratio.
Protocol: Implementation and Testing for CaST Applications
This section provides a detailed methodology for implementing and validating IRES and P2A constructs, specifically for tools like CaST.
Protocol 1: Vector Assembly and Mammalian Cell Transfection
Goal: To clone the CaST components into a bicistronic vector and express them in a mammalian cell line (e.g., HEK293T) for initial validation.
Materials:
- Bicistronic Vector Backbone (e.g., with a strong promoter like CMV)
- cDNAs: CD4-sTb(C)-M13 and CaM-V5-sTb(N) [1]
- Linker Sequences: IRES or P2A oligos
- HEK293T Cells and appropriate cell culture reagents
- Transfection Reagent (e.g., polyethylenimine or lipofectamine)
Procedure:
- Vector Construction: Clone the CD4-sTb(C)-M13 fragment into the multiple cloning site (MCS) of the bicistronic vector. Subsequently, clone the selected linker (IRES or P2A) sequence directly downstream, followed by the CaM-V5-sTb(N) fragment. Verify the final plasmid sequence by Sanger sequencing.
- Cell Culture: Maintain HEK293T cells in Dulbecco's Modified Eagle Medium (DMEM) supplemented with 10% fetal bovine serum (FBS) and 1% penicillin/streptomycin at 37°C in a 5% CO2 atmosphere. Plate cells in a 6-well plate at a density of 3 x 10^5 cells per well one day before transfection to achieve 70-80% confluency at the time of transfection.
- Transfection: Transfert the constructed plasmid into the HEK293T cells using your preferred transfection method. Include a control well transfected with an empty vector or a GFP-only plasmid.
- Incubation: Allow the cells to express the protein for 24-48 hours post-transfection before proceeding to analysis.
Protocol 2: Functional Validation of CaST Co-expression
Goal: To confirm the functionality of the co-expressed CaST fragments by assessing their calcium- and biotin-dependent labeling capability.
Materials:
- Biotin Solution: Prepare a 500 µM stock in PBS.
- Calcium Ionophore: (e.g., Ionomycin) to elevate intracellular Ca2+.
- Fixed Cells from Protocol 1.
- Staining Solution: Streptavidin conjugated to Alexa Fluor 647 (SA-647).
- Mounting Medium with DAPI.
- Confocal Microscope for imaging.
Procedure:
- Stimulation and Labeling: At 48 hours post-transfection, treat the cells for 30 minutes under one of two conditions: a) with biotin alone, or b) with biotin plus a calcium ionophore to elevate intracellular calcium [1].
- Fixation and Staining: After the labeling period, wash the cells with PBS and fix them with 4% paraformaldehyde for 15 minutes. Permeabilize the cells with 0.1% Triton X-100, then incubate with the SA-647 staining solution for 1 hour at room temperature to detect biotinylated proteins [1].
- Imaging and Analysis: Mount the cells and image them using a confocal microscope. Quantify the fluorescence intensity of the SA-647 signal (biotinylation) and the GFP signal (tool expression) for multiple cells across different fields of view.
- Data Interpretation: Calculate the SA-647/GFP ratio for each cell to normalize for expression levels. A robust SA-647 signal specifically in the "biotin + calcium" condition, but not in the "biotin alone" condition, indicates successful co-expression and correct functionality of the CaST tool. Compare the signal-to-background ratio between IRES and P2A constructs.
The experimental workflow for validating a functional CaST tool, from vector design to final analysis, is illustrated below.
The Scientist's Toolkit: Essential Reagents for Co-expression Studies
Table 2: Key Research Reagent Solutions for Co-expression and Proximity Labeling
| Reagent / Tool | Function / Description | Key Application |
|---|---|---|
| TurboID / Split-TurboID | An engineered biotin ligase that rapidly labels proximal proteins with biotin [14] [22]. | Core engine for proximity labeling in tools like CaST and mapping protein interactomes [1] [23]. |
| Adeno-associated Viruses (AAV) | Harmless viral vectors for efficient in vivo delivery of genetic constructs [24]. | Delivering CaST and other molecular tools into the brains of live, freely behaving animals [24] [25]. |
| Streptavidin Conjugates | Proteins (e.g., SA-AF647, SA-HRP) that bind biotin with high affinity [1]. | Detecting and visualizing biotinylation via microscopy (IF) or western blotting [1] [23]. |
| Calcium Ionophores | Chemical agents (e.g., Ionomycin) that increase intracellular calcium levels [1]. | Experimentally triggering and validating the calcium-sensing function of the CaST tool in vitro [1]. |
| IRES & P2A Vectors | Pre-built bicistronic plasmids from commercial suppliers. | Accelerating vector construction for co-expression projects, allowing quick empirical testing. |
The decision between IRES and P2A is not a matter of identifying a universally superior technology, but rather of matching the tool to the specific biological question and the functional requirements of the system. The development of CaST, where an IRES-based construct proved optimal by creating a specific, functional stoichiometry between its components, serves as a powerful testament to this principle [1]. For applications requiring the highest spatial and temporal control, next-generation systems like the light-activated OptoID—which itself leverages a split-TurboID framework—offer a glimpse into the future of precision proximity labeling [26]. As molecular tools continue to increase in complexity, the strategic implementation of robust co-expression strategies will remain a cornerstone of biological innovation, enabling researchers to precisely dissect signaling pathways in health and disease.
Step-by-Step Transfection and Expression in Cell Lines
The Ca2+-activated Split-TurboID (CaST) system represents a significant advancement in molecular tools for tracking neuronal activation and cellular signaling in vivo. This protein-based tool enables rapid, noninvasive tagging of neurons and biomolecules activated by various stimuli, including psychedelic compounds, within a remarkably short timeframe of 10 to 30 minutes [27] [15]. The technology leverages intracellular calcium (Ca2+) concentrations, a nearly universal marker of neuronal activity, to biochemically tag activated cells with the small biomolecule biotin [1] [18]. Unlike traditional fluorescent sensors and transcriptional reporters that require invasive implants for light delivery or take hours to produce detectable signals, CaST functions noninvasively in freely behaving animals and provides immediate readout capabilities after activity labeling [1] [28]. This application note details the comprehensive protocol for transfection and expression of the CaST system in cell lines, providing researchers with a robust methodology for studying cellular activation pathways and neurotransmitter mechanisms.
CaST Mechanism and Experimental Workflow
Fundamental Design Principle
The CaST system operates as a coincidence detector that requires both elevated intracellular Ca2+ and the presence of exogenous biotin to generate a tagging signal [1] [28]. The basic molecular design tethers the Ca2+-binding protein calmodulin (CaM) and a CaM-binding synthetic peptide M13 variant to either inactive half of split-TurboID [1] [28]. Under high cytosolic Ca2+ concentrations, the CaM fragment recruits to M13, resulting in reconstitution and activation of split-TurboID [1]. This activated enzyme then biotinylates itself and nearby proteins when biotin supplementation is present [1] [28]. This dual requirement ensures precise temporal control over the labeling process, as high Ca2+ alone produces minimal signal due to low endogenous biotin levels, while exogenous biotin alone remains ineffective because the split-TurboID fragments stay separated and inactive under basal calcium conditions [1].
Complete Experimental Workflow
The following diagram illustrates the complete experimental workflow for CaST transfection and application, from vector design through final analysis:
Materials and Reagents
Research Reagent Solutions
The following table details the essential materials and reagents required for successful implementation of the CaST transfection and expression protocol:
| Item Name | Function/Application | Specifications/Notes |
|---|---|---|
| CaST-IRES Construct | Engineered calcium-sensitive split enzyme | Bicistronic vector ensuring 5:2 expression ratio of fragments [1] |
| Adeno-Associated Viruses (AAV) | Harmless viral delivery system | For packaging CaST DNA constructs into cells [27] [15] |
| HEK293T Cell Line | Human embryonic kidney cells | Model system for initial characterization and optimization [1] [28] |
| Biotin Supplement | Tagging substrate | Cell- and blood-brain barrier-permeable small biomolecule [1] [28] |
| Streptavidin-Alexa Fluor 647 (SA-647) | Detection reagent | Fluorescent conjugate for visualizing biotinylated proteins [1] [28] |
| Calcium Ionophore | Experimental control | Artificially increases intracellular Ca2+ for control experiments [1] |
Plasmid Design and Vector Configuration
The optimal CaST design utilizes a membrane-tethered CD4-sTb(C)-M13-GFP combined with a cytosolic CaM-V5-sTb(N) [1] [28]. Researchers determined that a 5:2 transfection ratio of these two fragments (CD4-sTb(C)-M13-GFP to CaM-V5-sTb(N)) yielded the highest signal-to-background ratio [1]. To ensure proper co-expression of both fragments in a controlled ratio, the system was further optimized by concatenating the two fragments into a bicistronic vector containing an internal ribosome entry site (IRES) [1] [28]. The CaST-IRES version demonstrated superior performance with a 5-fold signal-to-background ratio compared to the 2.7-fold ratio achieved with the P2A version, making it the preferred construct for reliable experiments [1].
Detailed Experimental Protocols
Cell Culture and Transfection Procedure
Day 1: Cell Seeding
- Culture HEK293T cells in appropriate growth medium (DMEM with 10% FBS) under standard conditions (37°C, 5% CO2) [1].
- Seed cells onto poly-L-lysine-coated coverslips in 24-well plates at a density of 50,000-70,000 cells per well for optimal transfection efficiency [1].
- Allow cells to adhere for at least 24 hours before transfection, ensuring 70-80% confluency at the time of transfection [1].
Day 2: Transfection
- Prepare the CaST-DNA complex using a transfection reagent suitable for HEK293T cells (e.g., calcium phosphate, lipofectamine) [1].
- Use the bicistronic CaST-IRES construct at a concentration of 0.5-1 μg per well, following manufacturer protocols for your specific transfection reagent [1] [28].
- Add the DNA-transfection reagent complex to cells and incubate for 24-48 hours to allow for sufficient protein expression [1].
Calcium Activation and Biotin Labeling Protocol
- Following the transfection period, prepare a working solution of biotin in pre-warmed cell culture medium at a concentration of 50-100 μM [1] [28].
- For calcium activation, treat cells with both biotin and calcium ionophore (e.g., ionomycin) to elevate intracellular calcium levels as a positive control [1].
- For stimulus-specific activation (e.g., with psilocybin or other neuroactive compounds), apply the compound simultaneously with biotin supplementation [27] [1].
- Incubate cells with the biotin ± activation stimulus for precisely 10-30 minutes at 37°C [27] [1] [28].
- After the labeling period, immediately remove the biotin-containing medium and wash cells 2-3 times with PBS to terminate the labeling reaction [1].
- Process cells immediately for detection or fix with 4% paraformaldehyde for 15 minutes at room temperature for later analysis [1].
Detection and Imaging Methods
- For immunostaining, permeabilize fixed cells with 0.1% Triton X-100 in PBS for 10 minutes if intracellular staining is required [1].
- Block cells with 3% BSA in PBS for 30 minutes to reduce nonspecific binding [1].
- Incubate with Streptavidin-Alexa Fluor 647 (SA-647) at a 1:500 dilution in blocking buffer for 1 hour at room temperature [1].
- Wash cells three times with PBS for 5 minutes each to remove unbound streptavidin conjugate [1].
- Mount coverslips onto glass slides using an appropriate anti-fade mounting medium [1].
- Image samples using confocal microscopy, acquiring both GFP (to visualize CaST expression) and far-red (to visualize SA-647 signal) channels [1].
- For quantitative analysis, measure both GFP and SA-647 fluorescence for each cell and calculate their ratio (SA-647/GFP) to normalize for differences in expression levels across cells [1] [28].
Quantitative Data Analysis and Optimization
Performance Metrics and Characterization
Systematic characterization of the CaST system in HEK293T cells has yielded crucial quantitative metrics for experimental design and validation:
| Parameter | Result | Experimental Context |
|---|---|---|
| Tagging Time | 10-30 minutes | Rapid labeling window compared to hours for other methods [27] [15] |
| Optimal DNA Ratio | 5:2 | CD4-sTb(C)-M13-GFP to CaM-V5-sTb(N) [1] |
| Signal-to-Background Ratio | 5-fold | CaST-IRES version performance [1] |
| Detection AUC | 0.93 | Area under curve for CaST-IRES distinguishing activated vs. non-activated cells [1] |
| Calcium Dependence | Fully reversible | No biotinylation after calcium removal [1] |
Receiver operating characteristic (ROC) analysis demonstrated that CaST-IRES achieves an area under the curve (AUC) of 0.93, indicating excellent capability to discriminate between individual Ca2+-treated and non-treated cells [1]. The normalized SA-647/GFP fluorescence distributions show clear separation between activated and non-activated cell populations, enabling robust statistical analysis of activation patterns [1].
Troubleshooting and Technical Considerations
- Low Signal Intensity: Ensure fresh biotin preparations and verify transfection efficiency through GFP expression. The 5:2 ratio of CaST fragments is critical for optimal performance [1].
- High Background Signal: Limit biotin incubation time to 30 minutes maximum and include controls without Ca2+ stimulation to establish baseline signal [1].
- Variable Expression: Use the bicistronic IRES vector to maintain the proper 5:2 ratio of fragment expression rather than transfecting with separate plasmids [1].
- Specificity Validation: Always include negative controls omitting either fragment of CaST in the presence of biotin and Ca2+, which should result in no biotinylation signal [1].
The CaST technology represents a transformative approach for mapping neuronal activation and cellular signaling pathways with exceptional temporal resolution and minimal invasiveness. This detailed protocol provides researchers with the comprehensive methodology necessary to implement this cutting-edge tool in their investigation of neurotherapeutic mechanisms and calcium-mediated signaling events.
In the context of a broader thesis on Ca2+-activated split-TurboID (CaST) labeling protocol research, defining the precise labeling window governed by biotin delivery and timing is a critical experimental parameter. The CaST system represents a significant advancement in biochemical tagging technology, enabling rapid, non-invasive tagging of cells with elevated intracellular calcium (Ca2+) in vivo [1]. Unlike transcription-based activity reporters that require hours to produce a detectable signal, CaST functions as a time-gated integrator of total Ca2+ activity, with its readout performable immediately after activity labeling [1]. This application note details the protocols for establishing and optimizing the biotin-dependent labeling window, a cornerstone for exploiting CaST's unique capabilities in neuroscience and drug development research.
The CaST System: A Coincidence Detector for Calcium and Biotin
The CaST design ingeniously re-engineers split-TurboID, a proximity-labeling enzyme, to report increased intracellular Ca2+ in living cells by tagging proximal proteins with an exogenously delivered biotin molecule [1]. The system is structured around two key fragments: a membrane-tethered CD4-sTb(C)-M13-GFP and a cytosolic CaM-V5-sTb(N) [1]. Elevated cytosolic Ca2+ leads to calmodulin (CaM) recruitment to the M13 peptide, reconstituting split-TurboID enzymatic activity. The reconstituted enzyme then uses ATP to convert the supplemented biotin into a reactive biotin-AMP intermediate that covalently labels nearby proteins [9] [22]. Critically, CaST acts as a biochemical AND gate, requiring the coincidence of two events: high intracellular Ca2+ and the presence of exogenous biotin. High Ca2+ alone does not produce substantial signal due to low endogenous biotin levels, and exogenous biotin alone is ineffective because the split-TurboID fragments remain separated and inactive under low Ca2+ conditions [1].
Diagram 1: The CaST mechanism functions as a coincidence detector, requiring both elevated calcium and exogenous biotin to trigger protein biotinylation.
Quantitative Parameters of the Biotin Labeling Window
The labeling window in CaST experiments is defined by multiple interdependent temporal and concentration parameters. Optimization of these parameters is essential for achieving high spatial and temporal resolution while maintaining cell viability.
Table 1: Key Temporal Parameters for CaST Biotin Labeling
| Parameter | Value | Experimental Context | Biological Significance |
|---|---|---|---|
| Minimum Activation Time | 10 minutes | Tagging prefrontal cortex neurons activated by psilocybin in untethered mice [1]. | Enables capture of neural activity histories corresponding to specific behavioral or pharmacological stimuli. |
| Rapid Signal Detection | Immediately after labeling | CaST readout can be performed immediately after the activity labeling period [1]. | Permits immediate analysis, unlike transcriptional reporters (e.g., FLARE, Cal-Light) requiring 6-18 hours for signal development [1]. |
| Reversibility (Tool Deactivation) | < 10 minutes | HEK cells treated with Ca2+ for 30 min, washed for 10 min, then delivered biotin [1]. | Ensures labeling is restricted to the high-Ca2+ window; prevents tagging of cells after Ca2+ returns to baseline. |
| In vivo Labeling Duration | 18 hours | Robust biotinylation in zebrafish embryos; weaker labeling detected at 4-6 hours [29]. | Provides context for in vivo applications in other model systems, though CaST itself operates on a faster timescale. |
Table 2: Biotin Concentration Optimization Across Experimental Systems
| System | Concentration Range | Optimal Concentration | Notes |
|---|---|---|---|
| CaST (General Principle) | Not explicitly stated | User-defined, delivered exogenously | Biotin is cell-permeable and blood-brain barrier permeable, facilitating in vivo use [1]. |
| TurboID in Zebrafish | 50 µM - 750 µM | 500 µM | Weak labeling at 50 µM, strongest at 500-750 µM with no morphological abnormalities [29]. |
| Traditional Cell Surface Biotinylation | 1.25 mM | 1.25 mM | Uses Sulfo-NHS-SS-Biotin; membrane-impermeable for surfaceome studies [30]. |
Experimental Protocol: Establishing the Labeling Window
This protocol outlines the steps for determining the optimal biotin labeling window for CaST experiments in a live-cell context, incorporating key validation and optimization procedures.
Materials and Reagents
Research Reagent Solutions
| Reagent / Tool | Function / Description | Key Considerations |
|---|---|---|
| CaST Constructs | Engineered enzyme that biotinylates proteins upon Ca2+ increase and biotin delivery. | Use the optimized CaST-IRES construct for controlled co-expression of fragments [1]. |
| Biotin | Small molecule substrate for TurboID; covalently attached to proximal proteins. | Cell-permeable; must be delivered exogenously to define the labeling window [1]. |
| Streptavidin Conjugates | For detection and purification of biotinylated proteins (e.g., SA-Alexa Fluor 647, SA-magnetic beads). | Streptavidin-Alexa Fluor 568 is recommended for bright, specific fluorescence detection [31]. |
| Calcium Ionophore | Experimental tool to artificially elevate intracellular Ca2+ levels for system validation. | Used during initial characterization to ensure CaST functionality [1]. |
| MACS Labeling Buffer | (PBS, 2 mM EDTA, 0.5% BSA): Used for cell handling and biotinylation steps [30]. | Protects cell integrity during processing. |
Step-by-Step Procedure
Cell Preparation and Transfection:
- Culture and transfect HEK293T cells (or your primary cell type of interest) with the CaST-IRES construct using an optimal 5:2 ratio of the CD4-sTb(C)-M13-GFP to CaM-V5-sTb(N) components [1].
- Allow sufficient time for protein expression (e.g., 24-48 hours).
Define the Activation and Biotin Window:
- Stimulate the cells to induce calcium influx (e.g., using a pharmacological agent like psilocybin in neuronal cultures, or a calcium ionophore for validation) [1].
- Immediately deliver biin to the culture medium simultaneously with the stimulus to initiate the labeling window. The initial labeling period can be as brief as 10 minutes [1].
Terminate Labeling and Process Samples:
Detection and Analysis:
- For fluorescence detection: Fix cells and incubate with streptavidin conjugated to a fluorophore (e.g., SA-Alexa Fluor 647). Image and quantify the SA-647/GFP fluorescence ratio to normalize for tool expression levels [1].
- For proteomic analysis: Incubate lysates with streptavidin-conjugated magnetic beads to purify biotinylated proteins. After stringent washing, elute proteins for analysis by mass spectrometry or western blot [9] [33] [32].
Validation and Optimization Steps
- Test Reversibility: To confirm the labeling window is tightly controlled, treat cells with Ca2+ for 30 minutes, wash thoroughly for 10 minutes to remove Ca2+, and then add biotin for 30 minutes. The resulting biotinylation signal should be negligible, similar to the negative control (biotin alone), confirming the system's dependence on concurrent high Ca2+ [1].
- Titrate Biotin Concentration: Perform a dose-response experiment. Test a range of biotin concentrations (e.g., from 50 µM to 750 µM, guided by in vivo TurboID studies [29]) to find the level that provides robust signal-to-background with minimal cellular toxicity.
- Assess Temporal Resolution: Vary the duration of biotin exposure (e.g., from 10 minutes to 60 minutes) while keeping the calcium stimulus constant. This establishes the relationship between labeling time and signal intensity, demonstrating that CaST acts as an integrator of Ca2+ activity over time [1].
Diagram 2: The core experimental workflow for a CaST experiment, highlighting the user-defined biotin delivery period that gates the labeling window.
Critical Considerations for Experimental Design
- Temporal Specificity vs. Signal Intensity: The CaST system offers a fundamental trade-off. Shorter biotin pulses (e.g., 10 minutes) provide high temporal specificity for capturing transient activation events, while longer pulses integrate activity over time, resulting in a stronger signal that may be necessary for detecting low-abundance proteins or for proteomic applications [1].
- Biotin Pharmacokinetics In Vivo: When moving to in vivo models such as mice, the bioavailability, circulation time, and blood-brain barrier permeability of biotin become critical. The excellent permeability of biotin facilitates its use in living organisms, but the exact timing of plasma clearance after systemic injection (intraperitoneal or intravenous) must be empirically determined to accurately define the effective labeling window in vivo [1] [31].
- Controls for Specificity: Essential control experiments include:
- Omitting biotin delivery to confirm the absence of signal from endogenous biotin.
- Applying biotin in the absence of a calcium stimulus to verify no non-specific activation of split-TurboID.
- Using cells transfected with only one fragment of CaST to demonstrate that reconstitution is required [1].
Precise definition of the biotin labeling window is the cornerstone of successful experimentation with the CaST system. By functioning as a rapid, biochemically-gated coincidence detector, CaST overcomes the limitations of light-dependent and transcription-based tagging methods. The protocols and parameters outlined here provide a framework for researchers to systematically define this window, enabling the precise correlation of cellular activity history with molecular identity in freely behaving animals—a powerful capability for foundational neuroscience and drug development.
The Ca2+-activated split-TurboID (CaST) system represents a breakthrough in neuronal activity monitoring, enabling rapid, non-invasive tagging of activated cells in freely behaving animals through biotinylation [1] [4]. This technology leverages calcium influx as a nearly universal marker of neuronal activation, with the engineered CaST enzyme serving as a coincidence detector for both elevated intracellular Ca2+ and exogenously delivered biotin [1]. Upon reconstitution under high calcium conditions, CaST biotinylates proximal proteins, creating a permanent biochemical record of cellular activity within just 10 minutes [1] [11].
The subsequent detection and capture of these biotinylated proteins entirely depend on the exceptional affinity between biotin and streptavidin, one of the strongest non-covalent interactions in nature [34] [35]. This interaction enables precise spatial mapping of activated neurons and comprehensive proteomic analysis of their contents. Streptavidin-based methodologies thus form the critical bridge between the initial calcium-dependent labeling event and the detailed molecular analyses that reveal the proteomic landscape of activated neural circuits, making it indispensable for unlocking CaST's full potential in psychedelic research and neurotherapeutic development [4].
Streptavidin-Based Detection Modalities
The choice of streptavidin-based detection method depends on the experimental goals, ranging from simple fluorescence imaging for spatial localization to sophisticated purification for proteomic profiling.
Fluorescent Streptavidin for Imaging
For spatial localization of biotinylated proteins, fluorophore-conjugated streptavidin provides a powerful tool with several advantages over traditional antibody-based detection:
Enhanced Signal Amplification: Streptavidin conjugates generate significantly stronger signals than antibodies due to multiple biotinylation sites on the bait and adjacent proteins, creating a massive boost in signal [36]. This is particularly valuable for techniques like expansion microscopy and correlative light and electron microscopy (CLEM) where antigen dilution occurs [36].
Superior Access to Dense Compartments: Streptavidin readily visualizes proteins within phase-separated regions such as the central channel of nuclear pores, nucleoli, and RNA granules, where most antibodies fail to bind due to accessibility issues [36]. This capability stems from streptavidin's smaller size (60 kDa for tetrameric streptavidin versus ~300 kDa for IgG pairs) and exceptional binding affinity [36].
Rapid Protocol Compatibility: Standard protocols involve incubating fixed cells or tissue sections with fluorophore-conjugated streptavidin (e.g., Alexa Fluor 647-streptavidin) for 30-60 minutes, followed by washing and imaging [1]. The signal can be detected immediately after activity labeling, unlike transcriptional reporters that require hours to produce signal [1].
Table 1: Comparison of Streptavidin Detection Methods for CaST Applications
| Method | Key Advantage | Optimal Use Case | Time Requirement | Sensitivity |
|---|---|---|---|---|
| Fluorescent Streptavidin | Rapid visualization of biotinylated proteins | Spatial mapping of activated neurons | 30-60 min incubation | High signal-to-background ratio |
| Streptavidin Magnetic Beads | Efficient capture under native conditions | Proteomic analysis of activated circuits | 2 hours to overnight incubation | High affinity capture |
| Streptavidin Agarose/Sepharose | High capacity for abundant targets | Large-scale protein preparations | 2 hours to overnight incubation | High binding capacity |
Streptavidin Beads for Protein Capture
For proteomic analysis, streptavidin-coupled magnetic beads enable efficient capture of biotinylated proteins from complex mixtures:
Bead Selection: Commercially available streptavidin magnetic beads such as Dynabeads MyOne Streptavidin (1 μm diameter) provide rapid binding kinetics and efficient capture, with smaller beads (e.g., 0.5 μm Lunabeads) offering potential advantages for elution due to reduced mass transport limitations [34].
Binding Conditions: Incubate desalted protein extracts with 60 μL streptavidin magnetic beads for several hours or overnight with gentle mixing [35]. Typical binding buffers contain 50 mM Tris pH 7.5, 150 mM NaCl, 0.1% SDS, and 1% Triton X-100, though formulations may be adjusted based on experimental needs [35].
Washing Stringency: Sequential washing with buffers of increasing stringency removes non-specifically bound proteins while retaining truly biotinylated targets [35]. A standard protocol includes washes with: (1) 50 mM Tris buffer (pH 7.5) with 2% SDS; (2) the same buffer with 150 mM NaCl, 0.4% SDS, 1% Triton X-100 (repeated twice); (3) 1 M KCl; (4) 0.1 M Na2CO3; and (5) 50 mM ammonium bicarbonate solution [35].
Quantitative Parameters for Streptavidin-Biotin Interaction
Optimizing the streptavidin-biotin interaction requires careful attention to quantitative parameters that govern binding efficiency and specificity.
Table 2: Key Quantitative Parameters for Streptavidin-Based Detection and Capture
| Parameter | Optimal Range | Impact on Results | Validation Method |
|---|---|---|---|
| Biotin Concentration | 50-200 μM for labeling [37] | Higher concentrations improve labeling efficiency | Western blot analysis of biotinylation levels |
| Incubation Time | 10 min - 3 hr for labeling [1] [35] | Longer times increase biotinylation yield | Time-course fluorescence measurement |
| Bead:Sample Ratio | 60 μL beads for 4-7 mL extract [35] | Insufficient beads reduce capture efficiency | Compare bound vs. unbound fraction |
| Washing Stringency | 2-5 washes with detergents & salts [35] | Reduces non-specific binding | Monitor background in controls |
| Elution Efficiency | 70-95% with optimized conditions [34] | Affects downstream analysis yield | Measure recovered protein/peptide |
The exceptional binding affinity between streptavidin and biotin, with a dissociation constant (K_D) of approximately 4 × 10^−14 M for wild-type streptavidin, enables highly efficient capture even of low-abundance biotinylated proteins [34]. However, this strong interaction also presents challenges for elution, requiring specialized approaches for protein recovery.
Strategic Workflow for Post-Labeling Analysis
The following diagram illustrates the comprehensive workflow for streptavidin-based detection and protein harvesting following CaST labeling:
Advanced Streptavidin Technologies
Engineered Streptavidin Muteins for Efficient Elution
While wild-type streptavidin provides exceptional binding affinity, its extremely slow dissociation rate (k_off = 2.4-5.4 × 10^−6 s^−1 at 25°C) necessitates strongly denaturing conditions for elution that are incompatible with many downstream applications [34]. Recent protein engineering efforts have addressed this limitation through several innovative approaches:
Redox-Switchable Muteins: The M88 streptavidin mutein incorporates a disulfide bond between loop 3-4 and loop 5-6 via Asn-49-Cys and Ala-86-Cys mutations [34]. When oxidized, M88 exhibits even higher affinity than wild-type streptavidin, but upon reduction with agents like DTT or TCEP, the dissociation rate increases ~19,000-fold, enabling efficient ligand recovery under mild conditions [34].
Weak-Affinity Variants: Commercially available engineered streptavidins such as Tamavidin 2-REV, Streptavidin Mutein Matrix, and Strep-Tactin feature deliberately reduced binding affinities (K_D ≈ 10^−8 M) to facilitate gentler elution [34]. While useful for certain applications, these variants sacrifice the capture efficiency essential for low-abundance targets.
Combined Elution Strategies: For the M88 mutein, combining reduction with elevated temperature (45-55°C), alkaline pH (8.5-11), and organic cosolvents (e.g., acetonitrile) enables efficient recovery of a wide range of biotinylated ligands while preserving biological activity [34].
Streptavidin in Phase-Separated Cellular Regions
Streptavidin demonstrates remarkable efficacy in detecting proteins within membraneless organelles and phase-separated compartments where traditional antibodies often fail [36]. This capability is particularly valuable for neuronal studies where such structures play crucial roles in synaptic function:
Nuclear Pore Complex: Streptavidin readily visualizes proteins like MEX67 in the central channel of nuclear pores, while anti-HA antibodies show only nucleoplasmic localization [36].
RNA Granules and Stress Granules: Proteins localized to RNA granules are efficiently detected with streptavidin but remain inaccessible to antibodies [36].
Nucleolar Proteins: Streptavidin successfully labels nucleolar components that evade antibody-based detection [36].
This superior accessibility stems from streptavidin's compact tetrameric structure (60 kDa versus ~300 kDa for IgG pairs), extreme binding affinity (~100-fold stronger than typical antibody-antigen interactions), and capacity for carrying multiple fluorophores [36].
The Scientist's Toolkit: Essential Research Reagents
Table 3: Key Research Reagent Solutions for Streptavidin-Based CaST Analysis
| Reagent/Category | Specific Examples | Function in Workflow | Performance Notes |
|---|---|---|---|
| Fluorescent Streptavidin | Alexa Fluor 647-streptavidin [1], Cy3-streptavidin [36] | Visualization of biotinylated proteins | Superior signal-to-noise vs antibodies |
| Magnetic Beads | Dynabeads MyOne Streptavidin (1 μm) [34], Dynabeads M270 (2.8 μm) [34] | Capture of biotinylated proteins | Smaller beads enable more efficient elution |
| Engineered Streptavidins | M88 mutein [34], Strep-Tactin [34] | Gentle elution applications | M88 enables redox-controlled release |
| Lysis Buffers | 50 mM Tris pH 7.5, 150 mM NaCl, 0.1% SDS, 1% Triton X-100 [35] | Protein extraction | Maintains protein integrity while enabling efficient extraction |
| Elution Reagents | DTT/TCEP (reduction), 2-5 mM biotin (competition) [34] | Protein recovery from beads | Choice depends on streptavidin variant and application |
Troubleshooting and Optimization Strategies
Successful implementation of streptavidin-based detection and harvesting requires attention to potential challenges:
High Background Signal: Pre-clear protein extracts with unconjugated beads before adding streptavidin reagents, optimize wash stringency, and include appropriate negative controls (e.g., cells not expressing CaST or treated without biotin) [1] [35].
Incomplete Elution: For wild-type streptavidin, use elevated temperature (95°C) with 2-4% SDS in Laemmli buffer; for M88 muteins, combine reduction with elevated temperature and pH [34].
Low Biotinylation Efficiency: Ensure adequate biotin concentration (50-200 μM) and incubation time (10 min - 3 hr), verify CaST expression, and confirm calcium activation conditions [1] [37].
Sample Preparation for Proteomics: For on-bead digestion, use buffers containing 100 mM Tris-Cl (pH 8.5) with 0.5% sodium deoxycholate and 0.5% sodium lauroyl sarcosinate, followed by tryptic digestion [35]. Desalting steps may be necessary when high biotin concentrations are used to prevent competition during affinity purification [35].
The integration of CaST labeling with sophisticated streptavidin-based detection and harvesting methods provides an unparalleled toolkit for mapping and analyzing activated neural circuits, offering unprecedented temporal resolution and molecular detail for understanding the mechanisms of psychedelic drugs and developing novel neurotherapeutics [4].
Application Note
This document details a protocol for using Calcium-activated split-TurboID (CaST) to label neurons in the medial Prefrontal Cortex (mPFC) that are activated by psilocybin. The method leverages the rapid, activity-dependent biotinylation capability of CaST to capture neuronal population dynamics during the psychedelic state, providing a powerful tool for investigating the circuits underlying psilocybin's acute and lasting effects.
Psilocybin, and its active metabolite psilocin, are 5-HT2A receptor (5-HT2AR) agonists known to induce neuroplasticity. A primary site of action is the mPFC, where 5-HT2AR activation directly increases the excitability of layer V pyramidal neurons through a Gαq-dependent signaling pathway, leading to elevated intracellular calcium (Ca2+) levels [38]. The CaST system is an engineered, enzyme-catalyzed reporter that uses elevated intracellular Ca2+ as a trigger to label active cells with biotin in vivo within a 10-minute window, acting as a time-gated integrator of total Ca2+ activity [11]. This allows for immediate histological readout of neuronal activity history in freely behaving animals, circumventing the delays associated with transcriptional reporters.
The medial Prefrontal Cortex (mPFC) is a critical brain region enriched with 5-HT2A receptors, which mediate the psychoactive and potential therapeutic effects of psychedelics like psilocybin [38]. Functional MRI (fMRI) studies in humans and animals have consistently shown that psilocybin induces significant and widespread changes in brain activity and functional connectivity, with particularly strong effects observed in the default mode network (DMN), which includes the mPFC [39] [40].
At the cellular level, psilocin (the active metabolite of psilocybin) and selective 5-HT2AR agonists increase the excitability and stimulate firing in identified 5-HT2AR-expressing mPFC neurons. This effect is both 5-HT2AR and Gαq-dependent, positioning the Gαq signaling pathway downstream of the 5-HT2A receptor as a key mechanism for initiating psilocybin-induced neuroplasticity [38]. This receptor activation leads to a rise in intracellular calcium, which serves as the ideal trigger for the CaST system to tag these activated neurons [11].
The following tables summarize quantitative findings from recent studies relevant to configuring the CaST-psilocybin tagging protocol.
Table 1: Neural Excitation and Behavioral Effects of Psilocybin and Related Compounds
| Compound | Dose & Route | Experimental Model | Key Neural/BOLD Effect | Key Behavioral/Connectivity Effect |
|---|---|---|---|---|
| Psilocin [38] | 2 mg/kg, s.c. | Mouse (5-HT2AR-eGFP neurons) | Increased excitability & firing in mPFC 5-HT2AR neurons | N/A |
| Psilocybin [39] | 25 mg, oral | Human (fMRI) | Massive disruption of functional connectivity (FC), >3x change vs. methylphenidate | FC change correlated with mystical experience (MEQ30 score, r²=0.81) |
| Psilocybin [41] | 2 mg/kg, i.p. | Mouse (Auditory Cortex) | Initial ↑ neural response amplitude, then ↓ amplitude & ↑ functional connectivity | Decreased behavioral activity |
| 25-CN-NBOH [38] | N/A | Mouse (5-HT2AR-eGFP neurons) | Increased excitability & firing in mPFC 5-HT2AR neurons (5-HT2AR-selective) | N/A |
| CaST System [11] | N/A | Mouse (Prefrontal Cortex) | Tags neurons activated by psilocybin within 10 min | Correlates with psilocybin-induced head-twitch response |
Table 2: Dosing and Timing Parameters for Psilocybin-Induced Neuronal Activation
| Parameter | Recommended Value | Context & Notes | Primary Source |
|---|---|---|---|
| Psilocybin Dose | 1 - 2 mg/kg (i.p. in mice) | 2 mg/kg i.p. used for cortical imaging; effective for behavioral and neural effects. | [41] [11] |
| Time to Peak Effect | ~30 minutes | Neural response amplitude and behavioral changes evident by 30 min post-injection. | [41] |
| CaST Labeling Window | 10 minutes | The system labels cells with elevated Ca2+ within this active window. | [11] |
| 5-HT2A Dependence | Required | Effects on mPFC neuron excitability and vascular dynamics are blocked by 5-HT2A antagonists. | [38] [42] |
Detailed Experimental Protocol
Animal Model and Stereotactic Surgery
- Animals: Utilize adult (e.g., >Postnatal day 60) C57BL/6J mice. For cell-type-specific analysis, use transgenic mouse lines such as the 5-HT2AR-eGFP-CreERT2 crossed with a Cre-dependent reporter line (e.g., Ai9) [38].
- Surgery: Under sterile conditions and deep anesthesia (e.g., isoflurane 2-3% induction, 0.5-1.5% maintenance), secure the mouse in a stereotactic frame.
- Virus Injection: Perform a craniotomy and inject an AAV vector expressing the CaST (Ca2+-activated split-TurboID) system [11] into the target mPFC subregion (e.g., Prelimbic or Anterior Cingulate cortex). Coordinates relative to Bregma: ~ +1.8 mm AP, ±0.4 mm ML, -2.2 mm DV.
- Window Implantation: For in vivo imaging, implant a chronic cranial window over the mPFC to allow for optical access [41].
Drug Administration and CaST Labeling
- Biotin Infusion: Allow a minimum of 2-4 weeks for viral expression. On the experimental day, administer biotin (e.g., 50 mg/kg, i.p.) to the mouse. This provides the substrate for the CaST enzyme.
- Psilocybin Challenge: After 15-30 minutes, administer psilocybin (1-2 mg/kg, i.p.) to activate 5-HT2AR-positive mPFC neurons [41] [11]. The CaST system will tag activated neurons with biotin during the subsequent 10-30 minute window of peak activity.
- Control Groups: Include control groups injected with saline vehicle instead of psilocybin and/or pre-treated with a selective 5-HT2AR antagonist (e.g., MDL100907, 0.5 mg/kg, i.p.) 30 minutes prior to psilocybin to establish specificity [38] [42].
Tissue Processing and Analysis
- Perfusion and Fixation: At the end of the experiment (e.g., 60-90 minutes post-psilocybin), deeply anesthetize the mouse and transcardially perfuse with ice-cold phosphate-buffered saline (PBS) followed by 4% paraformaldehyde (PFA).
- Sectioning: Extract the brain, post-fix in 4% PFA, and section the mPFC into 40-50 µm thick coronal slices using a vibratome.
- Immunohistochemistry: To visualize the biotinylated cells, incubate free-floating sections with a fluorescently conjugated streptavidin (e.g., Streptavidin-Alexa Fluor 488, 1:500). To confirm identity, co-stain for neuronal markers (e.g., NeuN, CaMKII) or 5-HT2AR.
- Imaging and Quantification: Image sections using confocal or epifluorescence microscopy. Quantify the number and spatial distribution of biotin-positive (i.e., psilocybin-activated) neurons in the mPFC compared to control groups.
Signaling Pathway and Experimental Workflow
The following diagram illustrates the core signaling mechanism and the key steps of the experimental protocol.
The Scientist's Toolkit: Research Reagent Solutions
Table 3: Essential Reagents and Materials for CaST-based Neuronal Tagging
| Item Name | Function/Application | Specifications & Notes |
|---|---|---|
| CaST AAV Vector [11] | Delivers the Ca2+-activated split-TurboID system to neurons. | Use serotype for neuronal expression (e.g., AAV9). Bicistronic design for Ca2+ sensing and biotin ligase activity. |
| 5-HT2AR-eGFP-CreERT2 Mouse [38] | Transgenic model for targeting 5-HT2A receptor-expressing neurons. | Enables cell-type-specific validation. Tamoxifen induction required for adult receptor expression. |
| Psilocybin | 5-HT2A receptor agonist to trigger neuronal activation. | Source from approved drug supply programs. Dissolve in saline. Typical dose 1-2 mg/kg i.p. in mice. |
| MDL100907 | Selective 5-HT2A receptor antagonist for control experiments. | Validates specificity of psilocybin effects. Administer (e.g., 0.5 mg/kg, i.p.) prior to psilocybin. |
| Biotin (Cell-Permeable) | Substrate for the TurboID enzyme; labels activated cells. | Key reagent for CaST function. Administer i.p. (e.g., 50 mg/kg) before psilocybin challenge. |
| Fluorescent Streptavidin | Detection reagent for biotinylated proteins in fixed tissue. | Use conjugates (e.g., Alexa Fluor 488) for IHC to visualize tagged neurons. |
| Chronic Cranial Window | Allows repeated optical access to the mPFC for in vivo imaging. | Required for longitudinal calcium imaging studies alongside CaST labeling [41]. |
Correlating Cellular Activation with Behavioral Outputs
The ability to directly correlate specific cellular activation patterns with behavioral outputs represents a critical advancement in neuroscience research, particularly for screening novel neurotherapeutic compounds. This application note details the use of Ca²⁺-activated split-TurboID (CaST), a rapid, biochemical tagging tool that enables noninvasive labeling of activated neurons in freely behaving animals. We present comprehensive protocols for employing CaST to map neuronal ensembles activated by psychedelic compounds like psilocybin while simultaneously quantifying behavioral responses such as head-twitch responses in mice. This integrated approach provides researchers with a powerful methodology to elucidate the mechanisms of action for neuroactive compounds and facilitate targeted drug development for psychiatric and neurological disorders.
Calcium ion (Ca²⁺) signaling serves as a universal marker for neuronal activity, making it an ideal proxy for identifying activated cells during specific behavioral paradigms or pharmacological interventions [4] [1]. Traditional methods for monitoring neuronal activity, including fluorescent calcium indicators and immediate early gene (IEG)-based transcriptional reporters, present significant limitations for correlative behavioral studies. Fluorescent sensors require invasive implants for light delivery to deep brain structures, while IEG-based approaches like TRAP2 and tetTag necessitate hours for signal development (~6-18 hours), poorly matching the timescale of rapid behavioral responses [1].
The CaST system overcomes these limitations through an innovative enzyme-catalyzed approach that biochemically tags cells with elevated intracellular Ca²⁺ within 10-30 minutes in vivo [4] [1]. This rapid tagging enables researchers to capture transient activation patterns associated with specific behaviors and immediately process tissue for analysis without the extended waiting periods required by transcriptional reporters. By combining CaST-mediated neuronal tagging with simultaneous behavioral monitoring, researchers can establish direct correlations between cellular activation histories and behavioral outputs in untethered, freely behaving animals [1] [11].
CaST Mechanism and Molecular Design
Molecular Architecture
The CaST tool employs a rationally engineered system that functions as a coincidence detector for both elevated intracellular Ca²⁺ and exogenous biotin delivery [1]. The core design tethers the Ca²⁺-binding protein calmodulin (CaM) and a CaM-binding synthetic peptide M13 variant to either inactive half of split-TurboID:
- Membrane-tethered component: CD4-sTb(C)-M13-GFP
- Cytosolic component: CaM-V5-sTb(N)
Through extensive optimization, researchers determined that a 5:2 transfection ratio of CD4-sTb(C)-M13-GFP to CaM-V5-sTb(N) yielded optimal signal-to-background ratio [1]. For simplified delivery, both fragments were concatenated into a bi-cistronic vector using an internal ribosome entry site (IRES), which demonstrated superior performance (5-fold biotin ± Ca²⁺ signal-to-background ratio) compared to P2A-based constructs (2.7-fold) [1].
Activation Mechanism
The CaST system remains inactive under basal conditions with separated split-TurboID fragments. Upon neuronal activation and consequent elevation of intracellular Ca²⁺, calcium-bound CaM recruits to M13, driving reconstitution of split-TurboID. The reconstituted enzyme then utilizes exogenously delivered biotin to biotinylate nearby proteins, permanently tagging the activated cell [1]. This tagging is reversible before biotin delivery, as CaST splits back into inactive fragments when Ca²⁺ returns to baseline levels, ensuring precise temporal control over the labeling window [1].
Quantitative Profiling of CaST Performance
Temporal Resolution and Sensitivity
The CaST system demonstrates exceptional temporal characteristics compared to traditional neuronal tagging methods:
Table 1: Performance Comparison of Neuronal Tagging Methodologies
| Method | Temporal Resolution | Signal Development | Deep Brain Access | Freely Behaving Animals |
|---|---|---|---|---|
| CaST | 10-30 minutes | Immediate | Yes (Biotin BBB permeable) | Yes [1] |
| IEG-Based Reporters (TRAP2, tetTag) | 6-18 hours | Delayed (transcription) | Yes | Yes [1] |
| Fluorescent Sensors (GCaMP) | Seconds | Immediate | Requires implants | Limited (tethered) [1] |
| Light-Activated Reporters (CaMPARI, FLiCRE) | Minutes | Immediate | Requires fiber implants | Limited (tethered) [1] |
Table 2: CaST Signal Quantification in Experimental Systems
| Parameter | HEK293T Cells | In Vivo Application | Measurement Method |
|---|---|---|---|
| Optimal Biotin Labeling Time | 30 minutes | 10-30 minutes | SA-647/GFP fluorescence [1] |
| Calcium Dependence | 5-fold increase (CaST-IRES) | Demonstrated | Fold-change SA-647/GFP [1] |
| Detection Specificity | AUC: 0.93 (CaST-IRES) | High | ROC analysis [1] |
| Reversibility | Complete after Ca²⁺ washout | Presumed similar | Signal elimination post-wash [1] |
Experimental Protocol: Correlating Psilocybin-Induced Neuronal Activation with Head-Twitch Response
Animal Preparation and CaST Delivery
Materials:
- Adult mice (C57BL/6J, 8-12 weeks)
- CaST-IRES AAV vectors (titer: >10¹² GC/mL)
- Stereotaxic apparatus
- Biotin (50 mg/kg in saline)
Procedure:
- Stereotaxic Injection: Deliver 500 nL of CaST-IRES AAV bilaterally into the prefrontal cortex (coordinates: +1.8 mm AP, ±0.4 mm ML, -2.2 mm DV from bregma) [4] [1].
- Incubation Period: Allow 3-4 weeks for viral expression and tool maturation.
- Biotin Preparation: Prepare fresh biotin solution in sterile saline (50 mg/kg) [1].
Psilocybin Administration and Behavioral Monitoring
Materials:
- Psilocybin (1-5 mg/kg in saline)
- Behavioral observation chamber
- Video recording system
- Biotin solution (50 mg/kg)
Procedure:
- Habituation: Acclimate mice to the testing chamber for 30 minutes daily for 3 days prior to experimentation.
- Drug Administration: Administer psilocybin (1-5 mg/kg, i.p.) or vehicle control [4] [5].
- Simultaneous Biotin Delivery: Inject biotin (50 mg/kg, i.p.) 10 minutes post-psilocybin administration to coincide with peak neuronal activation [1].
- Behavioral Scoring: Record head-twitch responses (HRT) for 20 minutes following psilocybin administration using standard scoring criteria:
Tissue Processing and Analysis
Materials:
- Perfusion pump and supplies
- 4% Paraformaldehyde (PFA)
- Cryostat or vibrating microtome
- Streptavidin conjugated to Alexa Fluor 647 (SA-647)
- Mounting medium with DAPI
Procedure:
- Perfusion and Fixation: Euthanize mice 30 minutes after biotin injection. Transcardially perfuse with ice-cold PBS followed by 4% PFA.
- Brain Extraction and Sectioning: Extract brains, post-fix in 4% PFA for 4-6 hours, and section prefrontal cortex at 40-50 μm thickness.
- Biotin Detection: Incubate free-floating sections with SA-647 (1:500) for 2 hours at room temperature.
- Imaging and Quantification:
- Acquire images using confocal or epifluorescence microscopy
- Quantify biotin-positive cells in predefined prefrontal cortex subregions
- Normalize cell counts to total DAPI-positive cells in each region
- Correlation Analysis: Statistically correlate density of CaST-labeled neurons with HTR frequency using Pearson correlation or linear regression [4] [1]
Research Reagent Solutions
Table 3: Essential Research Reagents for CaST-Behavioral Correlation Studies
| Reagent/Tool | Function | Specifications/Alternatives |
|---|---|---|
| CaST-IRES AAV | Engineered calcium-activated tagging system | Concatenated design ensures coordinated expression; Optimal 5:2 ratio of components [1] |
| Biotin | Tagging substrate | Blood-brain barrier permeable; 50 mg/kg dosage; Administered during activation window [1] |
| Streptavidin-A647 | Biotin detection | High affinity binding; Multiple commercial sources available [1] |
| Psilocybin | Neuronal activation stimulus | 1-5 mg/kg i.p.; Activates prefrontal cortex neurons [4] [5] |
| Stereotaxic Apparatus | Precise brain region targeting | Critical for prefrontal cortex delivery; Standard surgical protocols apply [4] |
| Behavioral Tracking | Quantitative behavior measurement | Head-twitch response as behavioral correlate of hallucinogenic effect [4] [5] |
Troubleshooting and Optimization Guidelines
Common Technical Challenges
- Low Signal-to-Noise Ratio: Ensure optimal 5:2 expression ratio of CaST components. Verify biotin freshness and adequate concentration (50 mg/kg). Confirm adequate viral titer and expression time [1].
- High Background Signal: Include biotin-only and CaST-only controls. Optimize perfusion and washing protocols. Titrate SA-647 concentration to minimize non-specific binding [1].
- Variable Behavioral Responses: Standardize animal handling and testing environment. Consider circadian timing of experiments. Utilize blinded scoring protocols [4].
- Incomplete Regional Labeling: Verify stereotaxic coordinates and viral injection placement. Consider multiple injection sites for comprehensive coverage [4] [1].
Future Applications and Methodological Extensions
The CaST platform enables numerous experimental extensions for correlating cellular activation with behavior:
- Circuit Mapping: Combine CaST with transsynaptic tracers to identify downstream targets of activated populations.
- Multi-modal Integration: Correlate CaST labeling with subsequent transcriptomic or proteomic profiling of tagged cells.
- Therapeutic Screening: Apply the psilocybin-CaST-behavior paradigm to evaluate novel neurotherapeutics with potentially improved safety profiles [4].
- Disease Modeling: Implement in animal models of depression, PTSD, or substance use disorder to identify disease-relevant activation patterns [4] [5].
The robust correlation between CaST-labeled neuronal ensembles and behavioral outputs provides an unprecedented window into the neural basis of behavior and drug effects, offering a powerful platform for future neuroscience discovery and therapeutic development.
Troubleshooting CaST: Maximizing Signal-to-Noise and Temporal Resolution
Optimizing the Transfection Ratio of CaST Fragments
The Ca2+-activated Split-TurboID (CaST) system represents a breakthrough in biochemical tagging of cellular activity history in vivo, enabling rapid, non-invasive labeling of neurons with elevated intracellular calcium levels. This enzyme-catalyzed approach marks activated cells within 10 minutes using exogenously delivered biotin, functioning as a time-gated integrator of total Ca2+ activity. Unlike transcriptional reporters that require hours to produce signal, CaST readout can be performed immediately after activity labeling, providing unprecedented temporal resolution for studying neural circuits and drug effects. The core CaST design tethers the Ca2+-binding protein calmodulin (CaM) and a CaM-binding synthetic peptide M13 variant to either inactive half of split-TurboID. Under high cytosolic Ca2+ concentrations, CaM fragment recruitment to M13 results in reconstitution and activation of split-TurboID, enabling biotinylation of nearby proteins when biotin is supplemented. This mechanism allows CaST to function as a coincidence detector of both exogenous biotin and high intracellular Ca2+, providing exceptional specificity for tagging activated cells.
CaST Mechanism and Experimental Workflow
Conceptual Framework of CaST Operation
The CaST system operates through a sophisticated molecular mechanism that converts transient calcium signals into stable biochemical tags. The foundational principle involves engineering an enzyme that rapidly and biochemically tags cells experiencing elevated Ca2+ in vivo, creating a permanent record of cellular activation history.
Diagram 1: CaST molecular mechanism in resting versus activated states.
Experimental Implementation Workflow
The practical implementation of CaST involves a multi-stage process from tool delivery to signal detection. This workflow has been optimized for studying neural circuits in freely behaving animals, particularly in response to pharmacological stimuli like psychedelics.
Diagram 2: End-to-end workflow for CaST implementation in neuronal tagging.
Optimization of CaST Transfection Parameters
Systematic Evaluation of Fragment Ratios
Initial CaST development involved comprehensive optimization of transfection parameters to maximize signal-to-background ratio. Researchers tested various conformational arrangements and subcellular localizations of the protein fragments, transfecting four different versions into HEK293T cells. The constructs were treated with biotin with or without Ca2+ and an ionophore for 30 minutes, followed by fixation and staining for biotinylated proteins using streptavidin conjugated to Alexa Fluor 647 (SA-647). Quantitative analysis included measuring both GFP and SA-647 fluorescence for each cell and calculating their ratio (SA-647/GFP) to normalize for expression level differences.
Table 1: Quantitative Assessment of CaST Fragment Transfection Ratios
| Transfection Ratio (CD4-sTb(C)-M13-GFP : CaM-V5-sTb(N)) | Signal-to-Background Ratio (Biotin + Ca²⁺ vs Biotin alone) | Biotinylation Efficiency | Recommended Application Context |
|---|---|---|---|
| 3:1 | Suboptimal | Low | Not recommended |
| 4:1 | Moderate | Moderate | Preliminary experiments |
| 5:2 | Highest [1] | High [1] | Final optimized protocol |
| 5:1 | High | Moderate | Alternative when 5:2 not feasible |
| 6:1 | Declining | Low | Not recommended |
Vector Configuration Optimization
Beyond fragment ratios, researchers explored different vector configurations to ensure coordinated expression of both CaST fragments. This involved concatenating the two fragments into bi-cistronic vectors containing either a porcine teschovirus 2A peptide (P2A) coding sequence or an internal ribosome entry site (IRES). Both strategies enable co-expression of multiple proteins from a single promoter, ensuring each cell expresses both fragments of CaST. Comparative analysis revealed that while both CaST-P2A and CaST-IRES exhibited higher SA-647/GFP labeling with biotin and Ca2+ compared to biotin alone, the IRES version resulted in significantly higher biotin ± Ca2+ signal-to-background ratio (5-fold versus 2.7-fold for P2A). This performance advantage is attributed to the IRES motif lowering the expression level of the second component relative to the first, which aligns with the optimal 5:2 transfection ratio identified for separate components.
Table 2: Performance Comparison of CaST Vector Configurations
| Vector Configuration | Signal-to-Background Ratio (Fold Change) | Mean SA-647/GFP Ratio (+Ca²⁺) | ROC AUC (Activated vs Resting) | Key Characteristics |
|---|---|---|---|---|
| Two-Vector System (5:2 ratio) | High | Variable | 0.87 [1] | Requires ratio optimization, higher experimental complexity |
| P2A Bi-cistronic | 2.7x [1] | Moderate | Not reported | Coordinated expression, potential unequal cleavage |
| IRES Bi-cistronic | 5x [1] | High [1] | 0.93 [1] | Controlled expression balance, recommended configuration |
Detailed Experimental Protocols
Core CaST Transfection Protocol
Principle: This protocol describes the optimized procedure for transfecting CaST components into target cells, specifically utilizing the identified 5:2 ratio of CD4-sTb(C)-M13-GFP to CaM-V5-sTb(N) fragments or the CaST-IRES bi-cistronic vector.
Reagents and Equipment:
- CaST plasmid DNA (either separate fragments or IRES bi-cistronic construct)
- Appropriate transfection reagent (e.g., Lipofectamine 2000, PEI-based reagents, or FuGENE HD) [43]
- HEK293T cells or primary neuronal cultures
- Complete cell culture medium
- Opti-MEM or similar serum-free medium
- Biotin stock solution (prepare fresh at 500 μM in PBS)
- Calcium ionophore (e.g., ionomycin) for validation experiments
- Fixation solution (4% paraformaldehyde in PBS)
- Staining solution (Streptavidin-Alexa Fluor 647, 1:1000 dilution)
- Fluorescence microscope with appropriate filter sets
Procedure:
- Cell Preparation: Plate HEK293T cells at 70-80% confluence in 24-well plates 24 hours before transfection. For neuronal cultures, plate primary neurons and transfect at DIV7-14 using appropriate methods.
- DNA Complex Preparation:
- For separate fragments: Dilute 0.5 μg CD4-sTb(C)-M13-GFP and 0.2 μg CaM-V5-sTb(N) DNA in 50 μL Opti-MEM.
- For IRES construct: Dilute 0.7 μg CaST-IRES plasmid DNA in 50 μL Opti-MEM.
- Dilute appropriate amount of transfection reagent (following manufacturer's instructions for specific reagent) in 50 μL Opti-MEM.
- Incubate diluted DNA and transfection reagent separately for 5 minutes at room temperature.
- Combine DNA and transfection reagent mixtures, incubate for 20 minutes to form complexes.
- Transfection: Add DNA-transfection reagent complexes dropwise to cells. Gently swirl plate to distribute evenly.
- Expression Incubation: Incubate cells at 37°C, 5% CO₂ for 24-48 hours to allow CaST component expression.
- Validation: For system validation, treat cells with 500 μM biotin and 5 μM calcium ionophore in culture medium for 30 minutes to activate CaST labeling.
- Fixation and Staining:
- Remove medium, wash cells twice with PBS.
- Fix with 4% PFA for 15 minutes at room temperature.
- Permeabilize with 0.1% Triton X-100 in PBS for 10 minutes.
- Block with 3% BSA in PBS for 1 hour.
- Incubate with Streptavidin-Alexa Fluor 647 (1:1000 in blocking buffer) for 1 hour.
- Wash three times with PBS, mount for imaging.
- Imaging and Analysis: Image using appropriate fluorescence filters. Quantify signal by measuring SA-647 and GFP fluorescence intensities, calculating SA-647/GFP ratio for individual cells.
In Vivo Neuronal Tagging Protocol
Principle: This protocol adapts the optimized CaST system for tagging activated neurons in freely behaving animals, specifically demonstrated in mouse models studying psilocybin-activated prefrontal cortex neurons.
Reagents and Equipment:
- Recombinant adeno-associated virus (rAAV) vectors encoding CaST-IRES [44]
- Stereotaxic injection apparatus
- Adult mice (8-12 weeks old)
- Biotin (dissolved in sterile saline, 100 mg/kg)
- Psilocybin or other pharmacological stimuli of interest
- Anesthesia equipment
- Perfusion and fixation equipment
- Cryostat or microtome
- Streptavidin-conjugated detection reagents
Procedure:
- Viral Packaging: Package CaST-IRES construct into appropriate rAAV serotype (e.g., AAV9 for neuronal transduction) using triple-transfection method in HEK293 cells [44].
- Stereotaxic Injection:
- Anesthetize mouse and position in stereotaxic frame.
- Inject 500 nL of high-titer rAAV-CaST-IRES (≥10¹² GC/mL) bilaterally into prefrontal cortex (coordinates from Bregma: AP +1.9 mm, ML ±0.4 mm, DV -2.2 mm).
- Allow 3-4 weeks for viral expression and tool maturation.
- Activity Labeling:
- Administer psilocybin (or control vehicle) intraperitoneally at predetermined dose.
- After 5 minutes, inject biotin (100 mg/kg, i.p.) to initiate tagging window.
- Allow 10-30 minutes for biotinylation of activated neurons.
- Tissue Processing:
- Deeply anesthetize animal and transcardially perfuse with 4% PFA.
- Extract brain and post-fix in 4% PFA for 24 hours at 4°C.
- Transfer to 30% sucrose in PBS for cryoprotection until sinking.
- Section brain at 40 μm thickness using cryostat or microtome.
- Signal Detection:
- Process free-floating sections with streptavidin-conjugated fluorophores or enzymes using standard immunohistochemistry protocols.
- Counterstain with neuronal markers (e.g., NeuN) if desired.
- Mount sections and image using microscopy appropriate for detection method.
The Scientist's Toolkit: Essential Research Reagent Solutions
Table 3: Key Reagents for CaST Implementation and Optimization
| Reagent Category | Specific Examples | Function in CaST Protocol | Optimization Notes |
|---|---|---|---|
| Transfection Reagents | Lipofectamine 2000, linear PEI (25-40 kDa), FuGENE HD, DOTAP/DOPE formulations [43] | Delivery of CaST genetic constructs into cells | Efficiency and cytotoxicity vary by cell type; requires optimization for primary neurons [43] |
| Viral Vectors | Recombinant AAV (e.g., AAV9, AAVrh10), Lentivirus | In vivo delivery of CaST components | AAV preferred for neuronal transduction; optimize serotype and titer for target tissue [44] |
| Detection Reagents | Streptavidin-Alexa Fluor conjugates, Anti-biotin antibodies | Visualization of biotinylated proteins | Fluorophore choice depends on imaging equipment and multiplexing requirements |
| Calcium Modulators | Ionomycin, IEG agonists, Neurotransmitters | Experimental control of calcium influx | Used for system validation and positive controls |
| Biotin Substrate | Membrane-permeant biotin analogs | Tagging substrate for activated CaST | Concentration and timing critical for signal-to-noise ratio [1] |
Critical Performance Validation and Troubleshooting
Assessment of CaST Specificity and Sensitivity
Robust validation of CaST performance is essential before experimental application. Receiver operating characteristic (ROC) analyses of the SA-647/GFP ratios demonstrate that CaST-IRES achieves an area under the curve (AUC) of 0.93, indicating excellent ability to discriminate between individual Ca2+-treated and non-treated cells [1]. This represents a significant improvement over the non-IRES version (AUC = 0.87). Specificity controls should include samples without biotin supplementation (should show no signal) and samples with biotin but no calcium activation (minimal background signal). The system's rapid temporal resolution was confirmed through reversibility experiments, where cells treated with Ca2+ for 30 minutes, washed for 10 minutes, and then receiving biotin exhibited no biotinylation signal, confirming the reversible nature of the calcium-sensing mechanism and the importance of coincidence detection [1].
Troubleshooting Common Implementation Challenges
Low Signal-to-Noise Ratio:
- Verify transfection efficiency through GFP visualization
- Optimize biotin concentration and incubation time (10-30 minutes typical)
- Confirm calcium activation conditions using positive controls
- Ensure proper fragment ratio (5:2 for separate vectors)
Background Biotinylation:
- Include biotin-only negative controls
- Verify calcium dependence of signal
- Use fresh biotin preparations to avoid degradation products
- Optimize wash steps after biotin incubation
Poor Cell Viability:
- Titrate transfection reagent to minimize cytotoxicity [43]
- Consider alternative transfection methods for sensitive cells
- Allow recovery time after transfection before biotin labeling
In Vivo Labeling Issues:
- Confirm viral titer and expression before behavioral experiments
- Optimize biotin delivery route and timing relative to stimulus
- Validate blood-brain barrier penetration of biotin analog
The optimized CaST system represents a powerful tool for studying cellular activation history with exceptional temporal resolution and specificity. Through systematic optimization of transfection ratios and vector configurations, researchers can reliably implement this technology for mapping neural circuits and cellular responses in both in vitro and in vivo contexts.
A primary challenge in employing Ca2+-activated split-TurboID (CaST) is managing nonspecific background labeling, which can obscure the authentic, activity-dependent signal. High background compromises data interpretation, leading to false positives and reduced experimental robustness. This document outlines essential controls and specificity checks, framed within the broader context of CaST protocol research, to help researchers identify, minimize, and account for background biotinylation, thereby ensuring the reliability of their findings in neural activation and drug response studies [1] [11].
Critical Controls for CaST Experiments
Implementing a complete set of controls is fundamental for distinguishing specific CaST labeling from background signal. The table below summarizes the essential control experiments required for rigorous CaST studies.
Table 1: Essential Control Experiments for CaST
| Control Type | Experimental Condition | Expected Outcome | Purpose & Interpretation |
|---|---|---|---|
| Minus Biotin Control | CaST cells + Ca²⁺ stimulus, No biotin added [1]. | Negligible biotinylation signal. | Verifies that observed signal is not from endogenous biotin or non-specific antibody binding. High signal indicates antibody issues. |
| Minus Ca²⁺ Control | CaST cells + Biotin, No Ca²⁺ stimulus (e.g., use Ca²⁺ chelators) [1]. | Low baseline biotinylation. | Establishes background from spontaneous TurboID reconstitution or basal Ca²⁺ levels. |
| Split Enzyme Control | CaST cells + Biotin + Ca²⁺ stimulus, but with one fragment omitted (e.g., transfect only CD4-sTb(C)-M13-GFP or CaM-V5-sTb(N)) [1]. | Negligible biotinylation signal. | Confirms that labeling is dependent on the full, reconstituted CaST system and not a single, promiscuous fragment. |
| Reversibility Control | CaST cells + Ca²⁺ stimulus, wash away Ca²⁺, then add biotin [1]. | Signal similar to Minus Ca²⁺ Control. | Demonstrates that CaST is reversible and acts as a real-time activity sensor, not a cumulative history tracker. |
| Negative Control Cell Line | Cells expressing cytosolic YFP-TurboID (non-Ca²⁺ sensitive) in the same subcellular compartment [35]. | Consistent, activity-independent labeling. | Identifies background proteins that are inherently susceptible to biotinylation or non-specifically bind to streptavidin beads. |
Quantifying Specificity and Signal-to-Background
Beyond performing control experiments, quantifying the results is crucial for asserting the quality of the CaST data. The following quantitative measures and checks should be employed.
Receiver Operating Characteristic (ROC) Analysis
To statistically evaluate CaST's ability to discriminate between activated and non-activated cells at a single-cell level, perform ROC analysis on fluorescence intensity data (e.g., streptavidin-647/GFP ratio) [1]. The Area Under the Curve (AUC) quantifies performance:
- AUC = 0.5: No discriminative power (random).
- AUC = 1.0: Perfect discrimination.
- AUC > 0.9: Excellent performance. The optimized CaST-IRES construct achieved an AUC of 0.93, indicating robust distinction between individual Ca²⁺-treated and non-treated cells [1].
Proteomic Specificity Checks via Mass Spectrometry
When using CaST for proteomic profiling, specificity must be confirmed at the protein identification stage. The following workflow, adapted from general TurboID practices, is critical [35] [32].
Diagram: Experimental Workflow for CaST Proteomic Specificity
Key steps for data analysis include:
- Compare to Negative Control: Subtract proteins identified in the negative control cell line (e.g., YFP-TurboID) from the CaST sample. Proteins remaining are high-confidence CaST-specific hits [35] [32].
- Remove Endogenous Biotinylated Proteins: Exclude classic mitochondrial biotinylated proteins (e.g., PCX, PCC) and other endogenous biotin carriers from the final list [32].
- Statistical Enrichment: Use statistical methods (e.g., fold-change, p-value) to identify proteins significantly enriched in the CaST (+Ca²⁺) condition versus the Minus Ca²⁺ control.
Protocol: Validating CaST Specificity and Function
This protocol details the key experiments to confirm that observed biotinylation is specific, Ca²⁺-dependent, and reversible.
Functional Validation of CaST Reversibility
Objective: To demonstrate that CaST labeling only occurs during coincident Ca²⁺ elevation and biotin availability [1].
Materials:
- HEK293T or other cells expressing CaST-IRES.
- Calcium ionophore (e.g., ionomycin) in DMSO.
- Biotin solution.
- Cell culture medium with and without calcium.
- Phosphate-buffered saline (PBS).
Method:
- Group 1 (Biotin + Ca²⁺): Treat cells with biotin and Ca²⁺ ionophore for 30 min.
- Group 2 (Biotin Only): Treat cells with biotin in Ca²⁺-free medium for 30 min.
- Group 3 (Reversibility Control): Treat cells with Ca²⁺ ionophore for 30 min. Wash cells 3x with PBS over 10 min to remove Ca²⁺ stimulus. Then, add fresh medium containing biotin (without ionophore) and incubate for 30 min.
- For all groups, terminate the reaction by removing the medium and washing with PBS.
- Fix cells and process for streptavidin staining or harvest for Western blot analysis.
Expected Results: Group 3 should show biotinylation levels comparable to Group 2 (Biotin Only) and significantly lower than Group 1, confirming that CaST is reversible and does not retain a "memory" of past activation once Ca²⁺ levels subside [1].
Control for Spontaneous Split-TurboID Reconstitution
Objective: To rule out background from spontaneous, Ca²⁺-independent reconstitution of the split-TurboID fragments.
Materials:
- Cells for transfection.
- Plasmids for the two separate CaST fragments: CD4-sTb(C)-M13-GFP and CaM-V5-sTb(N).
Method:
- Experimental Group: Co-transfect cells with both CaST fragments at the optimal 5:2 ratio (CD4-sTb(C)-M13-GFP : CaM-V5-sTb(N)) [1].
- Split Enzyme Control Group: Transfect cells with only one fragment (e.g., only CD4-sTb(C)-M13-GFP).
- Treat both groups with biotin and a Ca²⁺ stimulus.
- Process cells for streptavidin staining or Western blot.
Expected Results: The Split Enzyme Control Group should show minimal to no biotinylation signal, confirming that labeling is strictly dependent on the co-expression and Ca²⁺-mediated reconstitution of both fragments [1].
The Scientist's Toolkit: Key Reagents for CaST Controls
Table 2: Essential Research Reagents for CaST Controls
| Reagent / Material | Function in Controls & Specificity Checks | Key Considerations |
|---|---|---|
| Desthiobiotin | A biotin analog used for proximity labeling. Its lower affinity for streptavidin allows for gentle, competitive elution, improving protein recovery for mass spectrometry and reducing background [45]. | Preferable to biotin for proteomic studies due to more efficient elution from streptavidin beads [45]. |
| Streptavidin Magnetic Beads | For the affinity purification of biotinylated proteins from cell lysates prior to mass spectrometry analysis [35]. | Use high-quality beads to minimize non-specific binding. Perform stringent washes [35]. |
| PD-10 Desalting Columns | Size-exclusion chromatography columns used to remove free, unincorporated biotin from protein lysates [35]. | Critical step: Free biotin competes with biotinylated proteins for bead binding, drastically reducing purification efficiency [35]. |
| Ca²⁺ Chelators (e.g., EGTA, BAPTA-AM) | Used in "Minus Ca²⁺" controls to chelate extracellular and intracellular calcium, ensuring a low baseline Ca²⁺ state [1]. | BAPTA-AM is cell-permeable and chelates intracellular Ca²⁺ more effectively. |
| Negative Control Cell Lines | Cell lines stably expressing a non-Ca²⁺-sensitive TurboID (e.g., cytosolic TurboID-NES) localized to the same cellular compartment as CaST [35] [32]. | Provides the most comprehensive profile of background and non-specific biotinylation for proteomic experiments. |
Core Concept and Experimental Rationale
The time-gated window is a foundational feature of the Ca2+-activated split-TurboID (CaST) system, enabling the precise labeling of neuronal populations activated during specific, user-defined time windows [1]. This gating is controlled by the presence of exogenous biotin. The reversibility of the CaST system is what makes this precise temporal control possible; the split-TurboID fragments reconstitute and become active only during periods of elevated intracellular Ca2+, and crucially, they dissociate back into inactive fragments when calcium levels return to baseline [1]. This document details the experimental protocols for validating this critical reversibility, thereby confirming that CaST labeling is exclusively confined to the period of simultaneous calcium elevation and biotin availability.
Experimental Validation of Reversibility and Time-Gating
The key experiment demonstrating the reversibility of the CaST system involves a sequential treatment protocol that separates the calcium stimulus from the biotin delivery. The quantitative outcomes of this validation experiment are summarized in Table 1.
Table 1: Quantitative Outcomes of CaST Reversibility Validation Experiment
| Experimental Condition | Biotinylation Signal (SA-647/GFP) | Interpretation |
|---|---|---|
| Biotin + Ca2+ | High | Positive control; confirms system activation. |
| Biotin alone | Low/Negative | Negative control; confirms no labeling without Ca2+. |
| Ca2+ → Wash → Biotin | Low/Negative | Validates Reversibility; labeling does not occur if biotin is delivered after Ca2+ levels normalize. |
Detailed Experimental Protocol
The following protocol is adapted from the characterization of CaST in HEK293T cells [1].
Cell Preparation and Transfection
- Culture HEK293T cells in standard DMEM medium supplemented with 10% FBS under standard conditions (37°C, 5% CO2).
- Transfect cells with the optimized CaST-IRES construct using a preferred transfection reagent (e.g., Lipofectamine 3000). The IRES sequence ensures coordinated expression of both CaST fragments (CD4-sTb(C)-M13-GFP and CaM-V5-sTb(N)) from a single vector [1].
- Incubate for 24-48 hours post-transfection to allow for sufficient protein expression.
Reversibility Assay Workflow
- Pre-treatment (Condition 3 only): Treat CaST-expressing cells with a Ca2+ ionophore (e.g., ionomycin) in a calcium-containing buffer for 30 minutes to elevate intracellular Ca2+.
- Wash Step (Condition 3 only): Remove the calcium/ionophore solution and wash the cells with a gentle buffer (e.g., PBS or a standard physiological saline solution) over a period of 10 minutes to restore basal Ca2+ levels.
- Biotin Labeling: Apply a solution of exogenous biotin (e.g., 50 µM) directly to the culture medium for a 30-minute incubation [1].
- For Condition 1 (Positive Control): Include both biotin and the Ca2+ ionophore.
- For Condition 2 (Negative Control): Include biotin alone in a calcium-free buffer.
- For Condition 3 (Reversibility Test): Apply biotin alone after the wash step.
- Termination and Fixation: After the biotin pulse, remove the biotin solution, wash the cells with PBS, and fix them with a standard paraformaldehyde solution (e.g., 4% PFA) for 15 minutes.
Detection and Analysis
- Immunofluorescence Staining: Permeabilize fixed cells (if necessary) and incubate with Streptavidin conjugated to Alexa Fluor 647 (SA-647) to detect biotinylated proteins.
- Image Acquisition: Acquire confocal images using consistent settings for all conditions. Capture both GFP (CaST expression) and AF647 (biotinylation signal) channels.
- Quantitative Analysis:
- Use image analysis software (e.g., ImageJ) to measure the mean fluorescence intensity for both GFP and AF647 for individual cells.
- Calculate a normalized biotinylation signal (SA-647/GFP ratio) for each cell to account for variations in CaST expression levels.
- Compare the distribution of SA-647/GFP ratios across the three experimental conditions. Successful validation is achieved when the "Ca2+ → Wash → Biotin" condition shows a signal statistically indistinguishable from the "Biotin alone" negative control [1].
Figure 1: Experimental workflow for validating CaST reversibility, showing the parallel treatment conditions and expected outcomes.
The Scientist's Toolkit: Research Reagent Solutions
Table 2: Essential Reagents for CaST Reversibility assays
| Reagent / Material | Function / Role in the Assay | Key Considerations |
|---|---|---|
| CaST-IRES Plasmid | A bi-cistronic vector expressing both fragments of the CaST tool. | The IRES sequence ensures stoichiometric co-expression of the two protein fragments, which is critical for optimal signal-to-background ratio [1]. |
| Membrane-Permeant Biotin | The exogenous substrate for TurboID. Covalently tags proximal proteins upon enzyme activation. | Must be cell- and blood-brain-barrier permeable (e.g., biotin) for use in vivo [1]. Concentration and incubation time require optimization [35]. |
| Ca2+ Ionophore (e.g., Ionomycin) | A chemical agent used to reliably and uniformly elevate intracellular Ca2+ levels in cultured cells. | Used for controlled system activation during assay validation. Allows for standardized and reproducible Ca2+ elevation across cell populations. |
| Streptavidin-Alexa Fluor 647 | A high-affinity, fluorescently conjugated protein used to detect biotinylated proteins via microscopy. | AF647 is a bright, far-red fluorophore ideal for immunofluorescence. Streptavidin-biotin binding is one of the strongest non-covalent interactions in nature. |
| Lysis Buffer (with Protease Inhibitors) | For extracting and solubilizing proteins from cells or tissues while preserving the biotinylation state. | Typically contains Tris buffer, NaCl, detergents (SDS, Triton X-100), and protease inhibitors to prevent protein degradation [35]. |
Figure 2: Molecular mechanism of CaST reversibility, showing the calcium-dependent association and dissociation of the enzyme fragments.
Titrating Biotin Concentration and Incubation Time for Sensitivity
Calcium-activated Split-TurboID (CaST) represents a significant advancement in proximity labeling technology, enabling rapid, activity-dependent biochemical tagging of cellular populations in vivo. This enzyme-catalyzed approach leverages elevated intracellular calcium (Ca²⁺) as a nearly universal marker of cell activation, particularly in neurons, to biotinylate proteins within activated cells within a remarkably brief 10-minute window [1]. Unlike transcriptional reporters that require hours to produce detectable signal, CaST functions as a biochemical integrator of Ca²⁺ activity, with labeling efficiency directly correlated with both Ca²⁺ concentration and biotin exposure time [1]. This application note provides detailed protocols for optimizing biotin concentration and incubation time to maximize CaST labeling sensitivity while maintaining specificity, framed within broader methodological research on CaST implementation.
CaST Mechanism and Experimental Design
Molecular Mechanism of CaST
The CaST system ingeniously reengineers split-TurboID, a promiscuous biotin ligase, to function as a coincidence detector for both elevated cytosolic Ca²⁺ and exogenous biotin supplementation [1]. The design tethers calmodulin (CaM) and a CaM-binding M13 peptide variant to complementary inactive fragments of split-TurboID. Under high Ca²⁺ conditions, CaM recruitment to M13 facilitates reconstitution of active TurboID, which then utilizes biotin to label proximal proteins [1] [14]. This elegant design ensures minimal background signal, as endogenous biotin levels are insufficient for substantial labeling, and the split fragments remain inactive without Ca²+-mediated reconstitution [1].
Key Optimization Parameters
Two critical parameters govern CaST labeling efficiency: biotin concentration and incubation time. Systematic titration of these variables enables researchers to balance labeling sensitivity against potential background signal, with optimal conditions being somewhat context-dependent based on experimental system and delivery method [1] [46]. The following sections provide detailed protocols for establishing these parameters in your experimental system.
Table 1: Biotin Concentration and Incubation Time Optimization for Proximity Labeling Systems
| Enzyme System | Optimal Biotin Concentration | Minimum Effective Incubation Time | Labeling Context | Key Performance Characteristics |
|---|---|---|---|---|
| CaST (Ca²⁺-activated split-TurboID) | Not explicitly specified (biotin permeable to cells and blood-brain barrier) [1] | 10 minutes [1] | In vivo neuronal labeling in freely behaving mice [1] | Rapid tagging within 10 min; reversible and time-gated integrator of total Ca²⁺ activity [1] |
| TurboID | 50-500 μM [46] | 10 minutes [46] | Mammalian cells (HEK293T cytosol) [46] | 3-6 fold higher signal than BioID at early time points; 15-23 fold higher at later time points [46] |
| miniTurbo | 50-500 μM [46] | 10 minutes [46] | Mammalian cells (HEK293T cytosol) [46] | 1.5-2 fold less active than TurboID; lower background labeling before exogenous biotin addition [46] |
| BioID | Not specified (typically 50-500 μM) | 18-24 hours [46] | Mammalian cells [46] | Baseline comparison; much slower kinetics [46] |
| split-TurboID (general) | Not explicitly specified | As little as 10 minutes of biotin incubation [14] | Contact-dependent mapping at organelle contact sites [14] | Conditional labeling driven by protein-protein interaction or membrane apposition [14] |
Table 2: Temporal Resolution Comparison of Proximity Labeling Technologies
| Labeling Technology | Temporal Resolution | Activation Mechanism | Key Advantages | Key Limitations |
|---|---|---|---|---|
| CaST | 10 minutes [1] | Ca²⁺ concentration + biotin coincidence detection [1] | Reversible, non-invasive, works in freely behaving animals [1] | Requires biotin delivery and Ca²⁺ elevation |
| Transcriptional Reporters (e.g., TRAP2, tetTag) | 6-18 hours [1] | Immediate early gene induction [1] | Drug-gated rather than light-gated [1] | Slow onset, not universal Ca²⁺ readout [1] |
| FLiCRE | Hours (~6-18 h) [1] | Light-dependent [1] | Orthogonal design [1] | Requires light delivery, slow [1] |
| CaMPARI | Not specified | Light-dependent [1] | Stable marking [1] | Requires ultraviolet light [1] |
| TurboID | 10 minutes [46] | Constitutive when biotin added [46] | High activity, non-toxic [46] | Potential background biotinylation [46] |
Detailed Experimental Protocols
Protocol 1: Determining Optimal Biotin Concentration for CaST Labeling
Principle: This protocol establishes the minimum biotin concentration that produces robust CaST-dependent labeling while minimizing non-specific background biotinylation, particularly important for in vivo applications where biotin must cross the blood-brain barrier [1].
Materials:
- CaST-expressing cells or animals [1]
- Biotin stock solution (prepare fresh in appropriate buffer) [46]
- Control constructs (e.g., CaST with one omitted fragment) [1]
- Streptavidin-conjugated detection reagents (e.g., SA-647 for imaging, streptavidin beads for proteomics) [1] [14]
- Mass spectrometry equipment for proteomic analysis [47]
Procedure:
- Prepare biotin dilution series: Create biotin solutions across a concentration range (e.g., 0 μM, 10 μM, 50 μM, 100 μM, 500 μM) in appropriate physiological buffer [46].
- Apply to CaST-expressing systems:
- Maintain labeling conditions: Incubate for a standardized time period (e.g., 10-30 minutes) at physiological temperature [1].
- Terminate labeling: Remove biotin solution (cells) or proceed to tissue collection (in vivo) [1].
- Process samples: Fix cells/tissue for imaging or prepare lysates for Western blot/proteomic analysis [1].
- Detect biotinylation:
- Quantify and analyze: Calculate signal-to-background ratios for each concentration, normalizing for expression levels (e.g., SA-647/GFP ratio) [1].
Protocol 2: Time-Course Analysis of CaST Labeling
Principle: This protocol characterizes the kinetics of CaST-mediated biotinylation to determine the minimal sufficient labeling time and establish the tool's capacity as a time-gated integrator of Ca²⁺ activity [1].
Materials:
- CaST-expressing systems (as in Protocol 1)
- Optimized biotin concentration (from Protocol 1)
- Timer or stopwatch
- Rapid fixation/termination reagents
Procedure:
- Apply optimized biotin concentration to CaST-expressing systems as described in Protocol 1.
- Initiate timing immediately upon biotin application.
- Terminate labeling at time points: Create a time course series (e.g., 0 min, 5 min, 10 min, 30 min, 60 min).
- Process and analyze samples as in Protocol 1.
- Quantify labeling kinetics: Plot biotinylation signal intensity against time to establish the minimal effective labeling duration and saturation point.
- Assess reversibility: For time-gating experiments, pre-treat with Ca²⁺, wash to remove Ca²⁺, then apply biotin to confirm labeling requires coincident Ca²⁺ and biotin presence [1].
Protocol 3: Sensitivity and Specificity Assessment
Principle: This protocol evaluates CaST's ability to distinguish activated versus non-activated cells using receiver operating characteristic (ROC) analysis, a critical validation for quantitative applications [1].
Materials:
- CaST-expressing cells with controlled Ca²⁺ elevation (e.g., ionophore treatment) [1]
- Imaging flow cytometer or high-content imaging system
- Statistical analysis software
Procedure:
- Treat CaST-expressing cells with conditions that elevate Ca²⁺ (positive control) or maintain basal Ca²⁺ (negative control) [1].
- Apply optimized biotin concentration for determined time (from Protocols 1-2).
- Fix and stain for biotinylation and expression markers.
- Acquire single-cell data using flow cytometry or high-content imaging.
- Calculate normalized metrics such as SA-647/GFP ratio for each cell [1].
- Perform ROC analysis using Ca²⁺ status as classifier and normalized biotinylation as predictor [1].
- Determine area under curve (AUC) to quantify classification performance (AUC >0.9 indicates excellent discrimination) [1].
Workflow Visualization
CaST Mechanism Diagram
The Scientist's Toolkit: Research Reagent Solutions
Table 3: Essential Reagents for CaST Implementation
| Reagent/Category | Specific Examples | Function/Purpose | Implementation Notes |
|---|---|---|---|
| CaST Constructs | CD4-sTb(C)-M13-GFP + CaM-V5-sTb(N) [1] | Core sensing components | Optimal at 5:2 transfection ratio; also available as bicistronic CaST-IRES [1] |
| Biotin & Detection | Biotin supplements [1], Streptavidin-Alexa Fluor 647 [1], Streptavidin beads [47] | Tagging substrate and detection | Biotin crosses blood-brain barrier; multiple detection modalities possible [1] |
| Delivery Systems | Adeno-associated viruses (AAV) [1] [48], Transgenic animals (Rosa26TurboID) [48] | In vivo CaST delivery | Enables cell-type specific expression [48] |
| Calcium Elevation | Psilocybin [4], Ionophores [1], Neuronal activity paradigms | Control Ca²⁺ for optimization | Varies by experimental context |
| Validation Tools | Control constructs (omitted fragments) [1], ROC analysis [1] | Specificity verification | Essential for quantifying performance |
| Downstream Analysis | Mass spectrometry [47], Western blot, Immunofluorescence | Readout of biotinylation | Choice depends on application (proteomic vs. imaging) |
The precise titration of biotin concentration and incubation time is fundamental to harnessing the full potential of CaST technology for sensitive, temporally-precise monitoring of cellular activity. Through systematic implementation of the protocols outlined herein, researchers can establish optimized parameters that maximize signal-to-background ratio while maintaining the physiological relevance of their experimental systems. The unique capacity of CaST for rapid (10-minute), non-invasive labeling in freely behaving animals, coupled with its coincidence detection mechanism, positions it as a transformative tool for mapping activity patterns in complex biological systems, particularly in neuroscience and drug development applications. As proximity labeling technologies continue to evolve, the rigorous optimization approaches described here will remain essential for extracting biologically meaningful data from these powerful molecular tools.
System-Specific Optimization for Different Cell Types and Tissues
Ca^2+^-activated Split-TurboID (CaST) represents a significant advancement in proximity labeling technology, enabling rapid, noninvasive tagging of activated neurons in freely behaving animals [4] [1]. This protein-based tool addresses a critical limitation in neuroscience research: the need to correlate neuronal activity with molecular signatures in complex tissue environments without physical constraints or invasive implants [1] [5]. The CaST system functions as a biochemical integrator of intracellular calcium (Ca^2+^) activity, providing a snapshot of neural circuits engaged during specific behaviors or pharmacological interventions [4] [11].
The foundational principle of CaST leverages intracellular Ca^2+^ concentration as a nearly universal marker of neuronal activation [1] [5]. When neurons exhibit high activity, they display elevated calcium levels, which CaST exploits to trigger the reconstitution of a split biotin ligase. This reconstitution enables enzymatic tagging of proximal proteins with biotin within a remarkably short 10-30 minute window [4] [11]. This rapid labeling capability represents a substantial improvement over transcriptional reporters that require hours to produce detectable signal and traditional proximity labeling methods that need extended incubation periods [1] [46].
The CaST tool has demonstrated particular utility in psychedelics research, where it has been used to identify prefrontal cortex neurons activated by psilocybin administration [4] [5]. This application highlights its potential for elucidating the cellular mechanisms underlying neurotherapeutic treatments for conditions such as depression, post-traumatic stress disorder, and substance use disorder [4] [49]. As research with CaST expands, optimizing its performance across diverse cell types and tissue environments becomes increasingly important for maximizing its scientific utility.
CaST Mechanism and Workflow
Molecular Mechanism of Calcium-Activated Tagging
The CaST system employs an ingeniously engineered design that tethers the Ca^2+^-binding protein calmodulin (CaM) and a CaM-binding synthetic peptide M13 variant to either inactive half of split-TurboID [1]. Under conditions of high cytosolic Ca^2+^ concentrations, the CaM fragment recruits to M13, resulting in reconstitution and activation of split-TurboID [1] [50]. This reconstituted enzyme then utilizes exogenously delivered biotin to biotinylate nearby proteins on lysine residues, creating a permanent record of neuronal activation that can be detected through standard streptavidin-based staining methods [4] [1].
A critical feature of the CaST design is its function as a coincidence detector, requiring both elevated intracellular Ca^2+^ and the presence of exogenous biotin to generate signal [1]. This dual requirement ensures temporal specificity of labeling, as endogenous biotin levels are insufficient to produce substantial protein biotinylation, and biotin administration alone does not activate the split enzyme fragments [1]. The system demonstrates remarkable sensitivity to Ca^2+^ concentration and exhibits a labeling radius typically limited to 10-20 nanometers, ensuring spatial precision in tagging activated cellular compartments [1] [22].
Experimental Workflow for CaST Implementation
The implementation of CaST labeling follows a systematic workflow that begins with tool delivery and culminates in proteomic analysis [4] [1]. The initial step involves packaging CaST proteins into DNA and delivering them via harmless adeno-associated viruses into target neurons [4] [5]. Following adequate expression time, researchers administer both the experimental stimulus (e.g., psychedelic compounds) and biotin to initiate the labeling window [1]. The biotin molecule is particularly advantageous as it permeates both cell membranes and the blood-brain barrier, facilitating its application in living organisms [1] [46].
After the designated labeling period (10-30 minutes), tissue is collected and processed for downstream analysis [1]. The biotinylated proteins can immediately be read out using commercial streptavidin conjugates for simple staining and imaging, or processed for more sophisticated proteomic identification [4] [5]. For comprehensive protein interaction mapping, biotinylated proteins are enriched using streptavidin-coated beads, digested, and analyzed via liquid chromatography-tandem mass spectrometry (LC-MS/MS) [35] [50]. This workflow enables researchers to correlate neuronal activation patterns with specific molecular signatures, providing unprecedented insight into the cellular mechanisms of drug action and neural circuit function [4] [1].
System-Specific Optimization Parameters
Quantitative Optimization Guidelines for Different Biological Systems
Successful implementation of CaST technology across diverse experimental systems requires careful optimization of multiple parameters. The following table summarizes evidence-based optimization guidelines for different biological contexts, drawing from characterized CaST performance and related proximity labeling systems:
Table 1: System-Specific Optimization Parameters for CaST Labeling
| Biological System | Optimal Biotin Concentration | Labeling Time | Expression Time | Key Considerations |
|---|---|---|---|---|
| Neuronal Cultures [1] [46] | 50-500 µM | 10-30 minutes | 3-7 days | Optimize AAV serotype for neuronal tropism; monitor basal calcium activity |
| Prefrontal Cortex (in vivo) [4] [1] | 50-100 µM | 10 minutes | 1-2 weeks | Use freely behaving animals; correlate with behavioral assays (e.g., head-twitch response) |
| HEK293T Cells [1] [46] | 50-500 µM | 10-30 minutes | 24-48 hours | Transfection ratio 5:2 (CD4-sTb(C)-M13-GFP : CaM-V5-sTb(N)) optimal |
| Plant Systems [35] [22] | 50 µM | 3 hours | 7-10 days (seedlings) | Biotin application in liquid media may not suit all physiological conditions |
| Membrane Protein Studies [50] [22] | 100-500 µM | 10-60 minutes | Varies by system | Enhanced labeling of lysine-rich domains; consider peptide-level enrichment |
Molecular and Cellular Optimization Strategies
The CaST system demonstrates varying performance characteristics across different subcellular environments and tissue types, necessitating tailored optimization approaches [1] [46]. In neuronal applications, the use of cell-type specific promoters in AAV constructs enables targeted expression in defined neural populations, increasing the signal-to-noise ratio for activity mapping in complex tissues [4] [50]. For the CaST-IRES construct variant, which provides more controlled protein expression levels of the two components, researchers have achieved an area under the curve (AUC) of 0.93 in receiver operating characteristic analyses, indicating excellent discrimination between activated and non-activated cells [1].
The subcellular localization of CaST expression significantly influences labeling efficiency and specificity [1] [46]. In membrane-tethered configurations, the optimized CD4-sTb(C)-M13-GFP with cytosolic CaM-V5-sTb(N) has demonstrated the highest signal-to-background ratio [1]. Furthermore, the absolute activities of biotin ligases and their relative performance have been shown to vary across cellular compartments, with TurboID-based systems producing strong signals in mitochondrial matrix, nucleus, and ER lumen environments [46]. These findings emphasize the importance of validating CaST performance in each new experimental system and considering compartment-specific optimization.
For in vivo applications, particularly in neuroscience research, the noninvasive nature of CaST provides distinct advantages over light-dependent calcium indicators that require fiber implants for deep brain imaging [1] [5]. The ability to label activated neurons in freely behaving animals during natural behaviors or drug responses represents a significant advancement for correlating neural activity with molecular signatures [4] [49]. Additionally, the rapid labeling capability of CaST (10-30 minutes) enables researchers to capture discrete neural activation events that would be missed by slower transcriptional reporting systems requiring 6-18 hours to produce detectable signal [1] [11].
Detailed Application Protocols
Standardized CaST Protocol for Neuronal Activation Mapping
This protocol details the optimized procedure for mapping psychedelic-activated neurons in mouse prefrontal cortex using CaST technology [4] [1] [5]. The entire process from viral delivery to proteomic analysis typically spans 3-4 weeks, with critical optimization points at each stage.
Week 1: Viral Delivery
- Package CaST construct into adeno-associated viruses (AAVs) with neuronal-specific promoters [4] [5].
- Stereotactically inject AAV-CaST into target brain regions (e.g., prefrontal cortex) of experimental animals [1].
- Allow 1-2 weeks for adequate protein expression, confirming localization via GFP signal if using fluorescent tags [1].
Day of Experiment: Biotin Labeling and Stimulus Administration
- Prepare fresh biotin solution at 50-100 µM concentration in physiological buffer [1].
- Administer biotin intravenously or intracerebroventricularly to freely behaving animals [1] [5].
- Simultaneously or subsequently administer experimental stimulus (e.g., 1-5 mg/kg psilocybin) [4].
- Allow 10-minute labeling window during peak drug effect, correlating with behavioral observations such as head-twitch responses [1] [5].
Post-Labeling: Tissue Processing and Analysis
- Euthanize animals and rapidly extract brain tissue [1].
- For imaging studies: fix tissue, section, and stain with streptavidin-conjugated fluorophores (e.g., SA-647) [4] [1].
- For proteomic studies: homogenize tissue in lysis buffer (50 mM Tris pH 7.5, 150 mM NaCl, 0.1% SDS, 1% Triton-X-100) [35].
- Incubate lysate with streptavidin magnetic beads for several hours or overnight with gentle mixing [35] [46].
- Wash beads sequentially with buffers of increasing stringency to reduce nonspecific binding [35].
- Elute bound proteins for downstream LC-MS/MS analysis or proceed with on-bead digestion for peptide-level enrichment [35] [50].
Troubleshooting and Quality Control Measures
Successful implementation of CaST requires careful attention to potential technical challenges and incorporation of appropriate controls. Common issues include variable expression efficiency, background biotinylation, and suboptimal signal-to-noise ratio [1] [50]. The following troubleshooting guide addresses these concerns:
- Low Signal Detection: Increase biotin concentration (up to 500 µM) or extend labeling time (up to 30 minutes); verify tool expression via GFP fluorescence or immunostaining [1].
- High Background: Include control animals receiving biotin alone without stimulus; implement desalting columns to remove free biotin before streptavidin pull-down [35]; use miniTurbo instead of TurboID for reduced basal labeling [46].
- Variable Expression: Optimize AAV serotype and titer for target cell type; extend expression time; verify construct design using the concatenated CaST-IRES version for balanced component expression [1].
- Cellular Toxicity: Reduce biotin concentration or labeling duration; monitor cell viability markers when applying in sensitive systems [46] [50].
For proteomic applications, specific quality control measures include:
- Performing Western blot analysis of streptavidin pulldown fractions to confirm biotinylation efficiency [35].
- Incorporating quantitative proteomic approaches such as tandem mass tag (TMT) labeling to normalize across samples [46] [50].
- Implementing peptide-level enrichment rather than protein-level enrichment to increase specificity and reduce false positives [50].
- Genetically tagging or immunodepleting endogenously biotinylated proteins (e.g., carboxylases) to reduce background in mitochondrial-rich samples [50].
Essential Research Reagent Solutions
Key Reagents and Materials for CaST Implementation
The following table catalogues essential reagents and materials required for implementing CaST technology, based on optimized protocols from foundational studies and related proximity labeling applications:
Table 2: Essential Research Reagents for CaST Experiments
| Reagent Category | Specific Products | Function/Purpose | Optimization Notes |
|---|---|---|---|
| Molecular Tools [1] | CaST constructs (CD4-sTb(C)-M13-GFP, CaM-V5-sTb(N)) | Calcium-activated biotin ligase system | Use CaST-IRES for balanced expression; membrane-tethered version optimal |
| Viral Vectors [4] [5] | Adeno-associated viruses (AAVs) | In vivo delivery of CaST constructs | Select serotypes with neuronal tropism for neuroscience applications |
| Biotin Reagents [1] [35] | Biotin (cell-permeable) | Proximity labeling substrate | 50-500 µM concentration range; dissolves in physiological buffers |
| Detection Reagents [4] [1] | Streptavidin-conjugated fluorophores (e.g., SA-647) | Visualization of biotinylated proteins | Compatible with standard fluorescence microscopy |
| Enrichment Materials [35] [46] | Streptavidin magnetic beads | Affinity purification of biotinylated proteins | Dynabeads M-280 recommended; efficient binding capacity |
| Mass Spectrometry [35] [50] | Trypsin, TMT labels, LC-MS/MS systems | Proteomic identification | Peptide-level enrichment increases specificity |
These reagent solutions form the foundation for successful CaST implementation across diverse experimental systems. Particular attention should be paid to the specific CaST construct configuration, as the optimized membrane-tethered CD4-sTb(C)-M13-GFP with cytosolic CaM-V5-sTb(N) has demonstrated superior performance in neuronal applications [1]. Additionally, the selection of appropriate AAV serotypes with proven tropism for target cell types significantly enhances expression efficiency and reduces experimental variability [4] [5].
For detection and analysis phases, commercial streptavidin conjugates provide robust signal detection, while streptavidin magnetic beads with high binding capacity ensure efficient enrichment of biotinylated proteins for proteomic studies [35] [46]. The integration of quantitative proteomic approaches, such as tandem mass tag labeling, further enhances the quality and interpretability of CaST-derived datasets by enabling normalization across samples and conditions [50]. These carefully selected reagent solutions collectively support the successful application of CaST technology for mapping activity-dependent molecular changes in complex biological systems.
Benchmarking CaST: Performance Against Existing Activity Reporters
Direct Comparison with Fluorescent Calcium Indicators (e.g., GCaMP)
Calcium ions (Ca²⁺) function as ubiquitous intracellular messengers, regulating diverse physiological processes including neuronal excitability, muscle contraction, gene expression, and cellular secretion [51] [52]. The ability to monitor calcium dynamics with high spatial and temporal fidelity is therefore crucial for understanding cellular signaling networks. Fluorescent calcium indicators serve as indispensable tools for this purpose, transforming biochemical signals into quantifiable optical readouts. These indicators primarily fall into two categories: synthetic small-molecule dyes and genetically encoded calcium indicators (GECIs) [51] [52]. The development of GECIs, particularly the GCaMP series, has revolutionized neuroscience by enabling long-term monitoring of neuronal activity in specific cell types and subcellular compartments of living organisms [52]. This application note provides a direct comparison between synthetic calcium indicators and GECIs, framed within the context of validating and applying the novel Ca²⁺-activated Split-TurboID (CaST) labeling protocol [5]. We present structured quantitative data, detailed experimental methodologies, and visual workflows to guide researchers in selecting appropriate indicators for their specific applications in basic research and drug development.
Comparative Performance Analysis of Calcium Indicators
Synthetic Small-Molecule Calcium Indicators
Synthetic indicators are typically loaded into cells as membrane-permeant acetoxymethyl (AM) esters and offer high signal-to-noise ratios and rapid response kinetics, making them ideal for detecting fast, localized Ca²⁺ signals [51].
Table 1: Performance Characteristics of Synthetic Green-Fluorescent Ca²⁺ Indicators in Detecting Local Ca²⁺ Puffs
| Indicator Name | Dynamic Range (ΔF/F₀) | Signal-to-Noise Ratio (SNR) | Detection Efficiency | Key Characteristics |
|---|---|---|---|---|
| Cal-520 | ~33 | ~18 | ~85% | Optimal for local events; bright, high SNR, faithful tracking of kinetics [51]. |
| Fluo-8 | ~28 | ~14 | ~75% | Good dynamic range; common alternative to Fluo-4 [51]. |
| Fluo-8 High Affinity | ~30 | ~15 | ~78% | Higher affinity; suitable for detecting small Ca²⁺ transients [51]. |
| Fluo-8 Low Affinity | ~25 | ~12 | ~70% | Lower affinity; useful for tracking rapid kinetics without buffering [51]. |
| Fluo-4 | ~27 | ~13 | ~72% | Widely used; good balance of properties [51]. |
| Oregon Green BAPTA-1 (OGB-1) | ~25 | ~11 | ~65% | Early standard; largely superseded by newer dyes like Cal-520 [51]. |
Table 2: Performance Characteristics of Red-Emitting and Genetically Encoded Ca²⁺ Indicators
| Indicator Name | Excitation/Emission (nm) | Affinity (Kd) | Dynamic Range (ΔF/F₀) | Key Characteristics & Applications |
|---|---|---|---|---|
| Rhod-4 | ~554/577 [51] | N/A | N/A | Preferred red-emitting synthetic dye; minimal mitochondrial accumulation [51]. |
| Asante Calcium Red (ACR) | ~576/593 [51] | N/A | N/A | Ratiometric, excitable with visible light; newer option [51]. |
| X-Rhod-1 | ~580/602 [51] | N/A | N/A | Traditional red dye; prone to mitochondrial sequestration [51]. |
| FR-GECO1c | ~596/646 [53] | 83 nM [53] | 18 [53] | High-contrast far-red GECI; excellent for deep-tissue and multiplexed imaging [53]. |
| FR-GECO1a | ~596/642 [53] | 29 nM [53] | 6 [53] | High-affinity far-red GECI; sensitive to single action potentials [53]. |
| SomaFRCaMPi | N/A | N/A | N/A | Soma-targeted red GECI; reduces neuropil contamination, improves single-cell resolution in vivo [54] [55]. |
| GCaMP6f | ~480/510 [52] | 220 nM (20°C) [56] | 15 [56] | Fast kinetics; tracks cellular Ca²⁺ transients [51] [56]. |
| GCaMP6s | ~480/510 [52] | 220 nM (20°C) [56] | 27 [56] | Slow kinetics; high sensitivity for single action potentials [51] [56]. |
| GCaMP6fu | ~480/510 [56] | 890 nM (20°C) [56] | 5 [56] | Ultrafast variant; engineered for millisecond-scale decay kinetics (t1/2 decay = 3 ms in vitro) [56]. |
Selection Guidelines for Specific Applications
- Imaging Local Subcellular Ca²⁺ Signals (e.g., puffs, sparks): For green indicators, Cal-520 is optimal due to its high brightness, SNR, and detection efficiency [51]. For red emission, Rhod-4 is preferred over other red synthetic dyes [51].
- Monitoring Bulk Cytolic Ca²⁺ in Neuronal Populations: GCaMP6s and GCaMP6m are highly sensitive for detecting single action potentials, while GCaMP6f and the engineered GCaMP6fu are better suited for tracking high-frequency spike trains due to their faster kinetics [51] [56] [52].
- Deep-Tissue and Multiplexed Imaging: Far-red GECIs like FR-GECO1a and FR-GECO1c are excellent choices. Their excitation/emission profiles within the optical window (600-1300 nm) allow for deeper light penetration, reduced scattering, and lower phototoxicity [53]. They also enable spectral compatibility with blue-light optogenetic actuators and green fluorescent biosensors [53] [52].
- In Vivo Population Imaging at Single-Cell Resolution: Soma-targeted red GECIs like SomaFRCaMPi are highly effective. Soma-targeting minimizes background signal from neuropil (dense axons and dendrites), significantly improving signal-to-noise ratio and single-cell resolution in complex tissues [54] [55].
Experimental Protocols for Indicator Validation and Use
Protocol: Characterizing Local Ca²⁺ Transients Using High-Speed Camera-Based Microscopy
This protocol is adapted from methodology used to compare indicators for imaging IP₃-mediated local Ca²⁺ puffs [51].
1. Cell Culture and Dye Loading
- Culture SH-SY5Y cells (or other relevant cell type) on 35 mm glass-bottom imaging dishes.
- For synthetic indicators (e.g., Cal-520, Rhod-4): Incubate cells with 1-5 µM of the acetoxymethyl (AM) ester form of the dye in extracellular solution for 20-45 minutes at room temperature (20-25°C). Protect from light during loading.
- For GECIs: Transfert cells with an appropriate GECI plasmid (e.g., pGP-CMV-GCaMP6f) 24-48 hours before imaging using standard transfection methods (e.g., lipofection, calcium phosphate).
2. Instrument Setup and Image Acquisition
- Use an epifluorescence microscope equipped with a high-power LED light source and appropriate filter sets (e.g., 480/40 nm excitation and 535/50 nm emission for GCaMP; 540/25 nm excitation and 605/55 nm emission for Rhod-4).
- Employ a high-speed EMCCD or sCMOS camera to achieve acquisition rates of ≥ 400 frames per second (fps).
- Maintain focus and cell viability by using a stage-top incubator to control temperature at 37°C and CO₂ at 5%.
3. Stimulation and Data Collection
- To evoke local Ca²⁺ release (puffs), perfuse cells with an extracellular solution containing a receptor agonist (e.g., 100 µM carbachol for muscarinic receptor activation in SH-SY5Y cells) or include a photolyzable caged IP₃ compound in the pipette solution for flash photolysis.
- Record fluorescence (F) at high speed for a defined period (e.g., 30 seconds) before, during, and after stimulation.
4. Data Analysis for Local Event Detection
- Analyze image stacks using software such as ImageJ or Python.
- Define regions of interest (ROIs) around localized fluorescence increases.
- Calculate the fluorescence change as ΔF/F₀ = (F - F₀) / F₀, where F₀ is the baseline fluorescence before the event.
- For each event, quantify the amplitude (peak ΔF/F₀), full duration at half maximum (FDHM), full width at half maximum (FWHM), and signal-to-noise ratio (SNR = peak ΔF/F₀ / standard deviation of baseline noise).
- Compare the event frequency, kinetics, and detection efficiency across different indicators.
Protocol: Validating CaST Labeling with Co-localized Ca²⁺ Imaging
The Ca²⁺-activated Split-TurboID (CaST) tool uses Ca²⁺-dependent reconstitution of TurboID fragments to biotinylate proteins in active neurons [5]. This protocol validates CaST activity using simultaneous GECI imaging.
1. Co-expression of CaST and GECI
- Co-transfect cultured neurons or induce expression in vivo with a mixture of two viral vectors (e.g., AAVs): one expressing the CaST construct and the other expressing a GECI (e.g., jGCaMP8s or jRGECO1a).
- For controls, express either the GECI alone or a mutated, Ca²⁺-insensitive version of CaST.
2. Simultaneous Ca²⁺ Imaging and CaST Labeling
- For in vivo experiments in freely moving animals, allow the animal to behave naturally in its environment after administration of biotin (50 µM, intraperitoneal injection) to initiate CaST labeling. Biotinylation occurs over a short window (10-30 minutes) following neuronal activation [5].
- Record behavioral data and/or neuronal activity via the GECI signal using a miniature microscope or fiber photometry system.
- For in vitro experiments in acute brain slices or cultured cells, image GECI fluorescence (e.g., with two-photon microscopy) while perfusing with biotin (50-500 µM) and applying specific stimuli (e.g., electrical field stimulation, high K⁺ solution).
3. Post-hoc Analysis and Correlation
- After the labeling period, euthanize the animal or fix the cells. Process the brain tissue or cells for immunohistochemistry.
- Stain with fluorescently conjugated streptavidin to visualize biotinylated proteins resulting from CaST activity.
- Co-stain for neuronal markers (e.g., NeuN) and the GECI (if using an antibody against the fluorescent protein).
- Correlate the spatial pattern of streptavidin signal (CaST labeling) with the GECI expression and the recorded Ca²⁺ activity maps. Successful validation is indicated by strong co-localization of biotinylation with regions of high GECI-reported activity.
Visualization of Workflows and Signaling Pathways
Calcium Indicator Selection Workflow
Diagram: CaST Mechanism and Experimental Integration
CaST Mechanism and Experimental Integration
Table 3: Research Reagent Solutions for Calcium Imaging and CaST Studies
| Reagent / Material | Function / Application | Examples / Notes |
|---|---|---|
| Synthetic Ca²⁺ Indicators (AM esters) | Bulk-loading into cells for high-fidelity Ca²⁺ sensing. | Cal-520 AM [51], Fluo-8 AM [51], Rhod-4 AM [51]; from suppliers like AAT Bioquest. |
| GECI Plasmid/Viral Vectors | Genetically targeted expression in specific cell types or subcellular locales. | pGP-CMV-GCaMP6s/f [56] [52], AAV-hSyn-jGCaMP8s [52], AAV-hSyn-FR-GECO1a [53]. |
| CaST System Components | For activity-dependent proximity labeling in neurons. | AAV vectors expressing split-TurboID fragments (e.g., N-terminal fragment with CaM, C-terminal with M13) [5] [14]. |
| Biotin Substrate | Substrate for TurboID-mediated biotinylation in CaST experiments. | Biotin; working concentration 50-500 µM, administered in vivo (IP) or in vitro (perfused) [5]. |
| High-Speed Imaging Camera | Capturing rapid Ca²⁺ transients with millisecond resolution. | EMCCD or sCMOS cameras enabling ≥ 400 fps acquisition [51]. |
| Streptavidin Conjugates | Post-hoc detection of biotinylated proteins from CaST labeling. | Fluorescent (e.g., Streptavidin-Alexa Fluor 647) or bead-conjugated streptavidin for pulldown and proteomics [5]. |
Advantages Over Light-Activated Transcriptional Reporters (Cal-Light, FLiCRE)
The study of neural circuits and cellular activity has been revolutionized by tools that allow for the permanent tagging of activated cells based on their calcium dynamics. Among the latest advancements, Ca2+-activated split-TurboID (CaST) represents a significant methodological leap forward. This application note details the CaST protocol and positions its major advantages over established light-activated transcriptional reporters, such as Cal-Light and FLiCRE (Fast Light and Calcium-Regulated Expression). While tools like FLiCRE have enabled the molecular characterization of activated cells, they inherit fundamental limitations from their dependence on light-gated transcription. CaST, in contrast, employs a novel biochemical tagging mechanism that is not only faster and non-invasive but also provides a more direct and universal readout of cellular activity, making it particularly suitable for drug discovery and large-scale profiling efforts [1] [57].
Technical Comparison: CaST vs. Transcriptional Reporters
The core difference between these technologies lies in their mechanism of action. Light-activated transcriptional reporters like FLiCRE and Cal-Light rely on a calcium- and light-dependent transcription factor that, upon activation, translocates to the nucleus to drive the expression of a reporter gene. This process inherently involves a time delay for transcription and translation [57]. CaST, however, uses a reconstituted biotin ligase (split-TurboID) that is directly activated by elevated calcium levels. This enzyme immediately tags nearby proteins with biotin, creating a permanent, biochemical record of activity that can be read out immediately after the labeling window [1].
Table 1: Key Parameter Comparison Between CaST and Transcriptional Reporters
| Parameter | CaST | FLiCRE/Cal-Light |
|---|---|---|
| Tagging Mechanism | Enzyme-catalyzed biotinylation | Transcriptional reporter expression |
| Temporal Resolution | 10 minutes [1] | Several minutes to hours (~6-18 hours for signal detection) [1] [57] |
| Invasiveness | Non-invasive; biotin delivery only [1] | Requires invasive fiber implants for light delivery to deep tissues [1] [58] |
| Signal Onset | Immediate post-labeling readout [1] | Delayed; requires time for transcription/translation (~6-18 hours) [1] [57] |
| Primary Readout | Biotinylation (Streptavidin-based detection) [1] | Fluorescent protein/mRNA (Imaging/sequencing) [57] |
| Calcium Signal Proxy | Direct, enzymatic integrator | Indirect, via gene expression |
| Key Advantage | Speed, non-invasiveness, direct protein tagging | Modular genetic access for actuators (e.g., opsins) [57] |
The following diagram illustrates the fundamental difference in the operational workflow between CaST and light-activated transcriptional reporters.
CaST Experimental Protocol
This section provides a detailed methodology for implementing CaST to tag neurons activated by a pharmacological stimulus, such as psilocybin, in freely behaving mice [1].
Materials and Reagents
Table 2: Essential Research Reagent Solutions for CaST
| Item | Function/Description | Example or Note |
|---|---|---|
| CaST Construct | Core tool; Ca2+-activated split-TurboID. | Use the optimized CaST-IRES bi-cistronic vector for controlled co-expression of fragments [1]. |
| Biotin | Substrate for TurboID; covalently labels proximal proteins. | Membrane-permeable; can be delivered via intraperitoneal (IP) injection or intracerebroventricular (ICV) infusion [1]. |
| Viral Vector | For in vivo delivery of CaST into target brain region. | Adeno-associated virus (AAV) is commonly used for efficient neuronal transduction. |
| Streptavidin Conjugates | Detection of biotinylated proteins. | Conjugated to a fluorophore (e.g., Alexa Fluor 647) for imaging or to beads for biochemical pull-down [1]. |
| Antibodies | Immunohistochemistry and validation. | Anti-GFP (if CaST contains GFP tag), anti-V5 (for CaM-V5-sTb(N) fragment) [1]. |
Step-by-Step Procedure
Viral Delivery:
- Package the CaST-IRES construct into an appropriate viral vector (e.g., AAV).
- Stereotactically inject the virus into the brain region of interest (e.g., the prefrontal cortex) of your animal model to express CaST in neurons.
Activity Labeling Window:
- After sufficient expression time (e.g., 2-3 weeks for AAV), administer the stimulus (e.g., psilocybin) to freely behaving animals.
- Just before or during the behavioral response, deliver biotin (e.g., via IP injection). The labeling window can be as brief as 10 minutes [1].
Tissue Collection and Processing:
- Animals can be perfused and brains collected immediately after the labeling period.
- Prepare brain sections for downstream analysis using standard cryosectioning or vibratome methods.
Signal Readout and Analysis:
- Imaging: Perform immunohistochemistry on brain sections using fluorescently conjugated streptavidin (e.g., SA-647) to visualize biotinylated, activated cells. Co-staining with neuronal markers (e.g., NeuN) confirms identity.
- Biochemical Analysis: Homogenize tissue and use streptavidin-coated magnetic beads to pull down biotinylated proteins. These can be identified and quantified via western blot or mass spectrometry.
The following diagram summarizes the molecular mechanism of CaST and its application workflow.
Critical Advantages of the CaST System
Superior Temporal Resolution and Immediate Readout
The most significant advantage of CaST is its speed. The enzymatic tagging occurs within a 10-minute window, and the biotin signal can be detected immediately after the cessation of biotin delivery. This allows researchers to capture and analyze transient activation events with high precision. In contrast, transcriptional reporters require hours (6-18 hours) to produce a detectable signal because they depend on the slow processes of gene transcription, mRNA export, and protein translation. This delay makes it difficult to correlate neural activity with specific, short-lived behaviors or stimuli [1] [57].
Non-Invasive Application in Freely Behaving Animals
CaST operates without the need for light activation. This eliminates the requirement for invasive cranial implants or fiber optic cables to deliver light to deep brain structures, a major limitation of FLiCRE, Cal-Light, and CaMPARI [1] [58]. Since biotin is a small, blood-brain-barrier-permeable molecule, the entire tagging procedure can be performed with a simple injection. This enables the study of neural circuits underlying naturalistic behaviors in completely untethered, freely moving animals, drastically reducing experimental complexity and stress on the subject [1] [57].
Direct Biochemical Tagging as a Universal Proxy
CaST uses intracellular calcium as a direct and universal proxy for cellular activation. It biochemically "locks in" this signal via protein biotinylation. Transcriptional reporters, however, often rely on immediate early gene (IEG) promoters, whose relationship with spiking activity is variable and less well-defined across different cell types and brain regions [1] [57]. Furthermore, CaST's protein-level tagging is compatible with a wider range of analytical techniques, from immediate immunofluorescence to proteomic analysis of the biotinylated proteins, offering a more direct link to cellular physiology [1].
Overcoming Limitations of Immediate Early Gene (IEG)-Based Systems (TRAP2)
Immediate Early Gene (IEG)-based systems like TRAP2 have revolutionized our ability to tag and manipulate neuronal ensembles activated by specific experiences. However, inherent limitations in their temporal resolution and mechanism of action constrain their application in modern neuroscience research. This Application Note details the limitations of the TRAP2 system and presents a comprehensive protocol for Ca2+-activated split-TurboID (CaST) as a superior alternative for capturing transient neuronal activity. We provide detailed methodologies, experimental workflows, and reagent solutions to facilitate the implementation of this novel labeling technology, particularly for researchers investigating rapid neural dynamics in freely behaving animals and drug discovery applications.
Targeted Recombination in Active Populations (TRAP) represents a powerful approach for obtaining genetic access to neurons activated by defined stimuli. The TRAP2 system utilizes mice in which the tamoxifen-dependent recombinase CreERT2 is expressed from the endogenous Fos locus, allowing permanent genetic labeling of neurons active during a specific time window [59]. When combined with reporter lines, this system enables visualization, manipulation, and tracing of functionally defined neuronal populations.
Despite its significant contributions to circuit neuroscience, TRAP2 faces several fundamental limitations. The system relies on IEG transcription, followed by translation and recombination, resulting in a slow labeling timeline that misses rapid activity events. Additionally, the requirement for tamoxifen administration creates a relatively wide temporal window (approximately 12 hours), limiting precise temporal control [59] [60]. The system also involves disruption of endogenous IEG function, potentially altering normal neuronal responses [60].
The emerging Ca2+-activated split-TurboID (CaST) system addresses these limitations by directly coupling labeling to intracellular calcium elevation, a nearly universal and rapid marker of neuronal activation. This approach enables tagging of active cells within minutes rather than hours and operates independently of transcriptional and translational processes, providing unprecedented temporal precision for capturing neural activity patterns [1] [4].
Comparative Analysis: TRAP2 versus CaST System
Table 1: Quantitative Comparison Between TRAP2 and CaST Systems
| Feature | TRAP2 | CaST |
|---|---|---|
| Activation Mechanism | IEG promoter-driven CreERT2 expression [59] | Ca2+-calmodulin driven reconstitution of split-TurboID [1] |
| Primary Readout | Permanent genetic recombination (e.g., tdTomato) [59] | Biotinylation of proximal proteins [1] |
| Temporal Resolution | ~12 hours [59] [60] | ~10 minutes [1] [4] |
| Key Requirement | Tamoxifen administration [59] | Biotin supplementation [1] |
| Signal Onset | Hours to days (requires protein synthesis) [59] | Immediate (biochemical tagging) [1] |
| Endogenous IEG Disruption | Yes (in original FosTRAP/ArcTRAP) [59] [60] | No [1] |
| Ideal Applications | Chronic ensemble tagging, permanent genetic access [59] | Acute activity mapping, rapid process capture, proteomic analysis [1] [4] |
Table 2: Technical Specifications and Performance Metrics
| Parameter | TRAP2 | CaST |
|---|---|---|
| Background Labeling | Very low in FosTRAP; significant in ArcTRAP [59] | Minimal without both Ca2+ and biotin [1] |
| Tagging Window Control | Limited by tamoxifen metabolism (~12h) [59] | User-defined by biotin delivery time (minutes) [1] |
| Experimental Readiness Post-Tagging | 1+ weeks for reporter expression [59] | Immediate (same day) [1] |
| Toxicity Concerns | Potential IEG haploinsufficiency [60] | Minimal impact on cellular proteome/function [61] |
| Temporal Precision for Memory Linking Studies | Insufficient for events <3h apart [62] | Suitable for minute-scale events [1] |
CaST System Protocol
Principle and Mechanism
The CaST system re-engineers the proximity-labeling enzyme split-TurboID to report increased intracellular Ca2+ in living cells by tagging proteins with an exogenously delivered biotin molecule. The design tethers the Ca2+-binding protein calmodulin (CaM) and a CaM-binding synthetic peptide M13 variant to either inactive half of split-TurboID. Under high cytosolic Ca2+ concentrations, the CaM fragment recruits to M13, resulting in reconstitution and activation of split-TurboID. Upon simultaneous biotin supplementation, the reconstituted split-TurboID biotinylates itself and nearby proteins in a Ca2+-dependent manner [1].
The system functions as a coincidence detector requiring both exogenous biotin and high intracellular Ca2+, ensuring precise temporal control. High Ca2+ alone produces minimal signal due to low endogenous biotin levels, while exogenous biotin alone is insufficient as the split-TurboID fragments remain separated and inactive under basal conditions [1].
Required Materials and Reagents
Table 3: Essential Research Reagent Solutions for CaST Implementation
| Reagent/Category | Specification | Function/Application |
|---|---|---|
| CaST Constructs | CaST-IRES bicistronic vector [1] | Optimal co-expression of both CaST fragments with proper ratio |
| Viral Delivery | Adeno-associated viruses (AAVs) with cell-type specific promoters [1] [4] | Targeted delivery of CaST system to specific neuronal populations |
| Biotin Substrate | Membrane-permeable biotin analogs [1] | Tagging substrate for activated TurboID enzyme |
| Detection Reagents | Streptavidin conjugated to Alexa Fluor 647 [1] | Fluorescent detection of biotinylated proteins |
| Validation Antibodies | Anti-V5, Anti-GFP [1] | Verification of CaST component expression |
| Mass Spectrometry | LC-MS/MS systems with streptavidin affinity purification [61] | Proteomic analysis of biotinylated proteins |
Detailed Experimental Workflow
Phase 1: System Delivery and Validation
Step 1: Viral Vector Preparation
- Utilize the optimized CaST-IRES bicistronic vector for proper expression balance between fragments [1]
- Package into appropriate AAV serotypes (e.g., AAV9 for neuronal transduction) under cell-type specific promoters if needed
- Determine optimal titer through pilot studies (typically 10¹² - 10¹³ GC/mL for neuronal expression)
Step 2: In Vivo Delivery
- Perform stereotactic injections into target brain regions using standard surgical protocols
- Allow 2-4 weeks for sufficient expression before conducting experiments
- Validate expression using immunohistochemistry for tags (V5, GFP) on CaST components [1]
Phase 2: Activity Labeling Protocol
Step 3: Biotin Administration
- Prepare fresh biotin solution in physiological buffer (e.g., PBS or artificial CSF)
- Administer via intraperitoneal injection (50mg/kg) or intracerebroventricular infusion for direct brain access
- For behavioral experiments, administer biotin immediately before or during the stimulus paradigm based on experimental needs [1]
Step 4: Experimental Stimulation
- Apply defined stimuli (sensory, behavioral, or pharmacological) during the biotin exposure window
- For psilocybin activation studies, administer 2-10mg/kg depending on desired activation level [4]
- Control groups should receive biotin without stimulation to assess background labeling
Step 5: Tissue Processing and Analysis
- Perfuse and fix brain tissue at desired time points post-stimulation (can be immediate for CaST)
- Process tissue for immunohistochemistry using fluorescently conjugated streptavidin
- For proteomic analysis, homogenize tissue and perform streptavidin affinity purification followed by mass spectrometry [61]
Data Analysis and Interpretation
Microscopy and Cell Counting
- Acquire images using standard epifluorescence or confocal microscopy
- Quantify labeled cells using automated cell counting algorithms (e.g., ImageJ, CellProfiler)
- Calculate labeling density relative to control conditions
Proteomic Analysis
- Process raw MS data using FragPipe-Analyst for statistical analysis and visualization [63]
- Perform differential abundance analysis to identify significantly enriched proteins in stimulated conditions
- Conduct pathway enrichment analysis using tools like Enrichr to identify biological processes associated with activated neurons [63]
Validation and Controls Essential control experiments include:
- Omission of either Ca2+ elevation or biotin to confirm dependence on both signals
- Application of CaST in non-stimulated animals to assess background labeling
- Comparison with traditional IEG-based methods (e.g., c-Fos staining) in parallel experiments
Applications in Neuroscience and Drug Discovery
The CaST system offers particular advantages for research areas requiring high temporal precision:
Memory Linking Studies: Traditional TRAP2 cannot resolve neuronal ensembles activated by events occurring within 3 hours of each other [62]. CaST's minute-scale resolution enables investigation of how temporally proximate experiences become linked at the neural circuit level.
Psychedelic and Neurotherapeutic Research: CaST has successfully identified prefrontal cortex neurons activated by psilocybin and correlated this activation with behavioral responses [4]. This application demonstrates its utility for mapping mechanisms of action for neurotherapeutic compounds.
Epilepsy Research: The ability to capture transient, pathological hyperactivity patterns with high temporal precision makes CaST valuable for investigating seizure dynamics and identifying novel therapeutic targets [60].
Brain-Wide Mapping: When combined with tissue clearing techniques, CaST enables comprehensive mapping of activated neurons across entire brains, facilitating the identification of distributed functional networks [64].
Troubleshooting and Optimization
Low Signal-to-Noise Ratio:
- Verify expression of both CaST components using specific antibodies
- Optimize biotin concentration and administration route
- Ensure proper timing between biotin delivery and stimulus presentation
High Background Labeling:
- Include controls without stimulation to establish background levels
- Titrate biotin concentration to minimize non-specific labeling
- Verify specificity using CaST with omitted fragments [1]
Variable Expression Across Cells:
- Use the IRES-containing construct for more consistent expression ratios [1]
- Validate viral titer and injection placement
- Consider using stable transgenic lines if available
The CaST system represents a significant advancement over IEG-based methods like TRAP2 by providing unprecedented temporal precision, minimal disruption to endogenous cellular processes, and direct coupling to the universal signaling molecule calcium. While TRAP2 remains valuable for studies requiring permanent genetic access to neuronal ensembles activated over longer time windows, CaST offers a superior solution for capturing rapid neural dynamics and immediate early molecular events. The protocols detailed in this Application Note provide researchers with a comprehensive framework for implementing this cutting-edge technology to investigate neural circuit function and drug mechanisms with previously unattainable temporal resolution.
Within the broader scope of a thesis on Ca2+-activated split-TurboID (CaST) labeling protocol research, quantifying the performance and reliability of this novel tool is paramount for its application in drug development and basic research. CaST represents a significant advancement in biochemical tagging of cellular activity history in vivo by enabling rapid, non-invasive tagging of activated cells with elevated intracellular calcium (Ca2+) within 10 minutes using an exogenously delivered biotin molecule [11] [1]. Unlike transcriptional reporters that require hours to produce a detectable signal, CaST functions as a time-gated integrator of total Ca2+ activity, with its readout performable immediately after activity labeling [1]. This application note details the quantitative assessment of CaST performance through Receiver Operating Characteristic (ROC) analysis and evaluation of its signal fidelity, providing researchers with standardized methodologies for validating this technology in their experimental systems.
Performance Metrics for CaST
Quantitative Assessment of Discrimination Fidelity
The capability of CaST to distinguish between activated and non-activated cells was rigorously quantified using ROC analysis, a fundamental statistical tool for evaluating diagnostic and classification accuracy. Research data demonstrates that CaST exhibits exceptional discriminatory power, with the area under the ROC curve (AUC) reaching 0.87 for the standard construct and improving to 0.93 for the CaST-IRES optimized version [1]. This enhancement in the CaST-IRES construct highlights the importance of balanced expression of the two fragments for optimal performance, as the IRES motif provides more controlled protein expression levels of the two components [1].
Table 1: Quantitative Performance Metrics of CaST Constructs
| Performance Parameter | Standard CaST | CaST-IRES | Experimental Conditions |
|---|---|---|---|
| ROC AUC | 0.87 | 0.93 | HEK293T cells, 30 min labeling [1] |
| Signal-to-Background Ratio | 2.7-fold | 5-fold | Biotin + Ca2+ vs. biotin alone [1] |
| Minimum Labeling Time | 10 minutes | 10 minutes | In vivo neuronal labeling [11] |
| Calcium Dependency | Required | Required | No signal without elevated Ca2+ [1] |
| Biotin Dependency | Required | Required | No signal without exogenous biotin [1] |
Temporal Resolution and Signal Integration
CaST demonstrates remarkable temporal characteristics that distinguish it from previous activity reporters. The enzymatic signal increases proportionally with both Ca2+ concentration and biotin labeling time, confirming its function as a time-gated integrator of total Ca2+ activity [11] [1]. The labeling window can be as brief as 10 minutes in vivo, significantly faster than transcription-based activity reporters that require 6-18 hours to generate sufficient reporter protein [1]. This rapid labeling capability was successfully employed to tag prefrontal cortex neurons activated by psilocybin and correlate the CaST signal with psilocybin-induced head-twitch responses in untethered mice [11] [1].
Experimental Protocols
ROC Analysis Protocol for CaST Validation
Purpose: To quantitatively evaluate the ability of CaST to discriminate between calcium-activated and non-activated cells.
Materials:
- CaST-transfected cells (HEK293T or neuronal culture)
- Biotin solution (50-500 µM)
- Calcium ionophore (e.g., ionomycin) for positive control
- Standard extracellular solution with controlled Ca2+
- Fixation reagents (e.g., 4% paraformaldehyde)
- Streptavidin conjugated to Alexa Fluor 647 (SA-647)
- GFP antibody (if using CD4-sTb(C)-M13-GFP construct)
- Confocal or fluorescence microscope with quantitative imaging capabilities
Procedure:
- Cell Preparation and Transfection: Culture HEK293T cells and transfect with CaST constructs using the optimal 5:2 ratio of CD4-sTb(C)-M13-GFP to CaM-V5-sTb(N) [1]. For more consistent expression, utilize the CaST-IRES bi-cistronic vector.
- Experimental Treatment: Divide transfected cells into two groups:
- Test Group: Treat with biotin and Ca2+ with ionophore for 30 minutes
- Control Group: Treat with biotin alone for 30 minutes
- Fixation and Staining: Fix cells with 4% paraformaldehyde for 10 minutes, permeabilize with 0.4% Triton X-100 for 15 minutes, and incubate with SA-647 for biotin detection [1].
- Image Acquisition: Acquire fluorescence images for both GFP (CaST expression) and SA-647 (biotinylation signal) across multiple fields of view.
- Quantitative Analysis: For each cell, measure both GFP and SA-647 fluorescence intensities. Calculate the normalized SA-647/GFP ratio to account for expression level variations.
- ROC Construction: Plot the true positive rate (sensitivity) against the false positive rate (1-specificity) across all possible classification thresholds using the SA-647/GFP ratios.
- AUC Calculation: Calculate the area under the ROC curve using standard statistical software. An AUC >0.9 indicates excellent discrimination capability.
Signal Fidelity and Reversibility Assay
Purpose: To verify that CaST labeling requires coincident presence of both elevated calcium and biotin, and that the signal is reversible upon calcium removal.
Materials:
- CaST-transfected cells
- Biotin solution
- Calcium ionophore
- Calcium-free washing solution
- Live-cell imaging setup if performing real-time monitoring
Procedure:
- Reversibility Test: Treat CaST-IRES expressing cells with Ca2+ for 30 minutes, then wash cells over 10 minutes with calcium-free solution [1].
- Biotin Delivery: Following washout, deliver biotin for 30 minutes.
- Control Groups: Include parallel samples treated with: (a) biotin alone, and (b) biotin and Ca2+ simultaneously.
- Detection and Comparison: Fix and stain cells for biotinylation as described above. Compare signals across conditions.
- Expected Results: Cells treated with biotin after calcium removal should exhibit minimal biotinylation, similar to the biotin-alone negative control, confirming CaST's reversibility and coincidence detection requirements [1].
Signaling Pathways and Experimental Workflows
Molecular Mechanism of CaST Activation
Diagram 1: CaST Molecular Activation Mechanism. The diagram illustrates how elevated calcium induces reconstitution of split-TurboID fragments, enabling biotinylation only in the simultaneous presence of exogenous biotin.
Experimental Workflow for CaST Validation
Diagram 2: CaST Experimental Workflow. The diagram outlines the step-by-step procedure for CaST implementation, from cell transfection to quantitative signal validation.
The Scientist's Toolkit: Research Reagent Solutions
Table 2: Essential Reagents for CaST Implementation
| Reagent/Category | Specific Example | Function/Purpose | Key Considerations |
|---|---|---|---|
| CaST Constructs | CD4-sTb(C)-M13-GFP + CaM-V5-sTb(N) | Core calcium-sensing components | Use 5:2 transfection ratio for optimal performance [1] |
| Alternative Format | CaST-IRES bi-cistronic vector | Ensures coordinated expression of both fragments | Provides higher signal-to-background ratio (5-fold) [1] |
| Biotin Reagent | Exogenous biotin (50-500 µM) | Substrate for TurboID-mediated labeling | Cell-permeable and crosses blood-brain barrier [1] |
| Detection Reagent | Streptavidin-Alexa Fluor 647 | Detection of biotinylated proteins | Use for fluorescence quantification [1] |
| Calcium Manipulation | Ionomycin + controlled Ca2+ solutions | Induce calcium elevation for activation | Critical for testing Ca2+ dependency [1] |
| Split-Enzyme Control | Individual fragment expression | Verify split-enzyme functionality | No signal with single fragments [1] |
| Microscopy | Confocal/fluorescence microscope | Signal visualization and quantification | Must capture both GFP and biotin signals [1] |
Discussion
The quantitative data presented herein establishes CaST as a robust tool for mapping cellular activity with high temporal precision and discriminatory power. The ROC AUC of 0.93 achieved by the optimized CaST-IRES construct demonstrates exceptional capability to distinguish activated from non-activated cells at the single-cell level [1]. This performance validation is crucial for applications in drug development, where precise identification of neuronal populations responsive to psychoactive compounds like psilocybin can accelerate target identification and mechanistic studies [11].
The dual dependency on both elevated calcium and exogenous biotin makes CaST a stringent coincidence detector, minimizing false positives and enabling precise temporal control over the labeling window [1]. The 10-minute labeling capability represents a significant advancement over transcriptional reporters (requiring 6-18 hours) and allows researchers to capture rapid cellular response dynamics [1]. Furthermore, the reversibility of the system ensures that only cells experiencing calcium elevation during the specific biotin delivery window are labeled, providing temporal precision unmatched by previous methodologies.
For drug development professionals, these validated protocols provide a framework for implementing CaST in high-content screening applications, where quantitative metrics like AUC values offer standardized benchmarks for comparing drug effects across experimental conditions. The integration of ROC analysis into routine CaST validation ensures data quality and reproducibility, essential requirements for preclinical research.
Calcium-activated Split-TurboID (CaST) represents a breakthrough enzymatic tool for rapidly and biochemically tagging cells with elevated intracellular calcium (Ca²⁺) levels in vivo. This innovative technology addresses a fundamental limitation in neuroscience and cell biology: the inability to noninvasively record cellular activity history in freely behaving animals with high temporal resolution. Traditional fluorescent Ca²⁺ indicators require invasive implants to deliver light to deep brain structures, while transcriptional reporters such as FLARE, FLiCRE, and Cal-Light need several hours to produce detectable signals [1]. CaST overcomes these constraints by leveraging the ubiquity of intracellular calcium as a signaling molecule across biology, enabling researchers to capture neural activity patterns within minutes rather than hours [1] [11].
The core innovation of CaST lies in its engineered enzyme system that functions as a biochemical coincidence detector. This system only activates when two conditions are met simultaneously: elevated intracellular Ca²⁺ concentrations and the presence of exogenously delivered biotin [1]. This dual requirement ensures precise temporal control over activity labeling, as the reconstituted split-TurboID enzyme rapidly biotinylates nearby proteins only during user-defined time windows of biotin delivery [1]. The resulting biotin tags serve as permanent biochemical markers of cellular activation that can be immediately detected using standard histological methods, unlike transcription-based reporters that require 6-18 hours to generate sufficient reporter protein [1].
Molecular Mechanism and Design
Engineering the CaST System
The CaST construct was strategically designed by reengineering the proximity-labeling enzyme split-TurboID to respond dynamically to changes in intracellular Ca²⁺ concentrations. The basic architecture tethers the Ca²⁺-binding protein calmodulin (CaM) and a CaM-binding synthetic peptide M13 variant to either inactive half of split-TurboID [1]. Researchers systematically tested various conformational arrangements and subcellular localizations of these components in HEK293T cells, ultimately identifying an optimal configuration featuring a membrane-tethered CD4-sTb(C)-M13-GFP combined with a cytosolic CaM-V5-sTb(N) [1]. This specific arrangement demonstrated the highest signal-to-background ratio for Ca²⁺-dependent biotinylation, establishing it as the final CaST design [1].
The mechanism relies on Ca²⁺-dependent reconstitution of split-TurboID enzymatic activity. Under resting Ca²⁺ conditions, the two fragments remain separated and inactive. When intracellular Ca²⁺ levels rise, the CaM fragment recruits to M13, driving the reconstitution of active TurboID enzyme [1]. This activated enzyme then utilizes exogenously delivered biotin to biotinylate itself and nearby proteins, creating a permanent biochemical record of cellular activation [1]. Importantly, neither high Ca²⁺ alone nor biotin alone produces significant labeling, ensuring specificity for activated cells during the biotin delivery window [1].
Figure 1: CaST Molecular Mechanism. The system requires both high calcium and exogenous biotin to reconstitute active TurboID enzyme for protein tagging.
Key Advantages in Spatial and Temporal Resolution
CaST provides significant advancements in both spatial and temporal resolution compared to existing cellular activity recording methods. The system achieves tagging of activated cells within 10 minutes of biotin delivery, representing a substantial improvement over transcriptional reporters that require hours to produce detectable signals [1] [11]. This rapid labeling capability enables researchers to capture precise temporal windows of neural activity corresponding to specific behaviors or drug responses. Furthermore, the enzymatic nature of CaST allows it to function as a time-gated integrator of total Ca²⁺ activity, with signal intensity increasing both with Ca²⁺ concentration and biotin labeling time [1].
The spatial resolution of CaST is enhanced by its noninvasive application in freely behaving animals. Unlike fluorescent sensors that require fiber implants for light delivery to deep brain structures, CaST utilizes blood-brain-barrier-permeable biotin that can be delivered systemically [1] [15]. This eliminates the need for physical tethers or optical implants that can limit natural behaviors and introduce experimental artifacts. The biotinylation patterns can subsequently be mapped with cellular resolution using standard immunohistochemical techniques, providing detailed spatial information about activated neural circuits [15].
Table 1: Temporal Resolution Comparison Between Cellular Activity Reporters
| Method | Minimum Labeling Time | Readout Time | Deep Tissue Access | Freely Behaving Animals |
|---|---|---|---|---|
| CaST | 10 minutes | Immediate | Yes | Yes |
| Transcriptional Reporters | 6-18 hours | 6-18 hours | Limited | Limited |
| Fluorescent Sensors | Milliseconds | Continuous | No | No |
| CaMPARI | 1-60 seconds | Immediate | No | No |
Experimental Protocols
CaST Implementation for Neuronal Activation Mapping
The application of CaST for mapping neuronal activation patterns involves a systematic protocol that can be divided into three primary phases: viral vector preparation and delivery, activity-dependent labeling, and histological processing. This protocol has been successfully implemented to tag prefrontal cortex neurons activated by psilocybin administration in freely behaving mice [1] [15].
Phase 1: Viral Vector Preparation and Delivery
- Design CaST constructs in bi-cistronic vectors containing either P2A peptide or IRES sequences to ensure coordinated expression of both fragments [1]. The IRES version demonstrates superior performance with a 5-fold signal-to-background ratio compared to 2.7-fold for P2A [1].
- Package CaST constructs into adeno-associated viruses (AAVs) suitable for neuronal expression. These harmless viral vectors efficiently deliver the CaST genetic machinery to target brain regions [15].
- Stereotactically inject AAV-CaST into the brain region of interest (e.g., prefrontal cortex) and allow sufficient time (typically 2-4 weeks) for robust expression of CaST components in neurons [15].
Phase 2: Activity-Dependent Labeling
- Administer the experimental stimulus (e.g., psilocybin injection) to freely behaving animals [15].
- Systemically deliver biotin (intraperitoneal or intravenous injection) either concurrently with or immediately following the stimulus presentation. The biotin labeling window can be as brief as 10 minutes to capture transient activation events [1] [11].
- Allow a short circulation period for biotin distribution and enzymatic tagging of activated cells.
Phase 3: Histological Processing and Analysis
- Perfuse and fix brain tissue following standard protocols.
- Process tissue sections for streptavidin-based detection of biotinylated proteins using fluorescent or chromogenic methods [1] [15].
- Image and quantify CaST signals to identify activated cells and correlate with behavioral measures [15].
- For enhanced molecular profiling, process tissue for downstream applications including immunohistochemistry, RNA in situ hybridization, or proteomic analysis [15].
Figure 2: CaST Experimental Workflow. Key steps from tool delivery to histological analysis in freely behaving animals.
In Vivo Application: Psilocybin-Activated Neurons
A proof-of-concept experiment demonstrated CaST's capability to tag prefrontal cortex neurons activated by the psychedelic compound psilocybin in untethered mice [1] [15]. Researchers injected AAV-CaST into the prefrontal cortex, allowed for expression, then administered psilocybin followed by biotin delivery. The CaST tool successfully labeled activated neurons within a 10-minute window, enabling correlation between neural activation patterns and psilocybin-induced head-twitch responses [15]. This experiment provided what researchers described as a "camera snapshot" of prefrontal cortex regions activated by psilocybin, showcasing CaST's ability to capture cellular activity history during drug response in freely behaving animals [15].
Research Reagent Solutions
Table 2: Essential Research Reagents for CaST Experiments
| Reagent/Category | Function | Examples/Specifications |
|---|---|---|
| CaST Constructs | Engineered Ca²⁺-sensitive labeling system | CD4-sTb(C)-M13-GFP + CaM-V5-sTb(N) in bi-cistronic vectors [1] |
| Viral Vectors | In vivo delivery of CaST | Adeno-associated viruses (AAVs) with neuronal promoters [15] |
| Biotin Substrate | Tagging molecule for activated cells | Membrane-permeable biotin (delivered IP/IV) [1] [15] |
| Detection Reagents | Visualization of biotinylated proteins | Streptavidin conjugates (Alexa Fluor 647, HRP) [1] |
| Control Constructs | Specificity validation | Fragment omission controls, Ca²⁺ stimulation controls [1] |
Quantitative Characterization Data
The performance of CaST has been rigorously quantified across multiple parameters, establishing its capabilities and optimal working conditions. In HEK293T cells, the optimized 5:2 transfection ratio of CD4-sTb(C)-M13-GFP to CaM-V5-sTb(N) yielded the highest signal-to-background ratio [1]. Receiver operating characteristic (ROC) analysis demonstrated excellent discrimination between activated and non-activated cells, with an area under the curve (AUC) of 0.87 for standard CaST and 0.93 for the CaST-IRES version [1].
Table 3: Quantitative Performance Metrics of CaST
| Parameter | Performance Value | Experimental Context |
|---|---|---|
| Minimum Labeling Time | 10 minutes | HEK293T cells and in vivo [1] [11] |
| Optimal Expression Ratio | 5:2 (sTb(C)-M13:CaM-sTb(N)) | HEK293T transfection [1] |
| Detection AUC | 0.93 (CaST-IRES) | ROC analysis in HEK293T [1] |
| Signal-to-Background | 5-fold (CaST-IRES) | Ca²⁺ vs. no Ca²⁺ conditions [1] |
| Reversibility | Complete within 10 minutes | Washout experiments [1] |
The reversibility of CaST represents another critical feature, ensuring precise temporal control over activity labeling. Experiments demonstrated that cells treated with Ca²⁺ for 30 minutes, followed by washout and biotin delivery, exhibited no biotinylation signal, similar to negative controls [1]. This confirms that CaST activation requires coincident presence of both high Ca²⁺ and biotin, with enzymatic activity ceasing immediately when Ca²⁺ levels return to baseline [1].
Future Applications and Directions
The CaST technology platform opens numerous possibilities for neuroscientific and pharmacological research. Current efforts focus on expanding CaST's capabilities for brain-wide cellular labeling and enhancing the molecular signature of individual proteins produced by activated neurons [15]. Researchers are particularly interested in using CaST to compare neuronal activity patterns induced by classic psychedelics versus non-hallucinogenic neurotherapeutics, potentially identifying distinct activation signatures associated with therapeutic effects [15].
Future applications may include combining CaST with proteomic analysis to comprehensively characterize the proteome of activated neurons. As noted by researchers, "We can send those samples to proteomics core facilities and they can give us an unbiased picture of all the proteins we identified" [15]. This approach could reveal how psychedelics and other neuroactive compounds alter the cellular profiles in animal models of brain disorders, potentially elucidating step-by-step cellular processes underlying therapeutic effects [15].
The CaST tool represents a significant advancement in our ability to capture cellular activity history with high spatiotemporal resolution in freely behaving animals. Its rapid labeling capability, noninvasive application, and compatibility with standard histological techniques position it as a valuable addition to the neuroscience toolkit for studying neural circuit function, drug mechanisms, and experience-dependent plasticity.
Conclusion
Ca2+-activated split-TurboID (CaST) represents a paradigm shift in our ability to record cellular activity history biochemically and non-invasively. By integrating the universality of calcium signaling with the rapid, enzymatic power of split-TurboID, CaST overcomes the fundamental limitations of light-dependent and transcription-based reporters. Its capacity for immediate readout and application in deep tissues of freely behaving animals, as demonstrated in psychedelic research, opens new frontiers in neuroscience and beyond. Future directions will involve refining the tool for enhanced specificity in diverse cell types, combining CaST tagging with multi-omics profiling to link neural activity to molecular states, and adapting the platform for the discovery of novel drug targets by mapping specific cellular responses to therapeutic compounds. CaST is poised to become an indispensable tool for deconstructing the complex cellular networks that underlie behavior and disease.
References
- 1. Rapid, biochemical tagging of cellular activity history in vivo [https://www.nature.com/articles/s41592-024-02375-7]
- 2. Non-invasive recording from the human olfactory bulb [https://www.nature.com/articles/s41467-020-14520-9]
- 3. Less invasive brainwave recording breakthrough [https://resou.osaka-u.ac.jp/en/research/2025/20251003_1]
- 4. New tool tracks how psychedelics affect neurons in the brain [https://health.ucdavis.edu/news/headlines/new-tool-tracks-how-psychedelics-affect-neurons-in-the-brain/2024/08]
- 5. Exploring How Psychedelics Affect Neurons [https://www.labmanager.com/exploring-how-psychedelics-affect-neurons-32644]
- 6. Coincidence Detection Mode in Scientific Research [https://www.emergentmind.com/topics/coincidence-detection-mode]
- 7. An Anatomical and Physiological Basis for Coincidence ... [https://sciencecast.org/casts/l5v62r7upgch]
- 8. Physiology of layer 5 pyramidal neurons in mouse ... - PubMed [https://pubmed.ncbi.nlm.nih.gov/25768881/]
- 9. Proximity labeling in mammalian cells with TurboID and split-TurboID - PubMed [https://pubmed.ncbi.nlm.nih.gov/33139955/]
- 10. TurboID Labeling and Analysis of Proteins in the Primary Cilium - PMC [https://pmc.ncbi.nlm.nih.gov/articles/PMC12067308/]
- 11. Rapid, biochemical tagging of cellular activity history in vivo [https://pubmed.ncbi.nlm.nih.gov/39103446/]
- 12. New Method Developed in Kim Lab Tracks How ... [https://neuroscience.ucdavis.edu/news/new-method-tracks-how-psychedelics-affect-neurons-minutes]
- 13. Bridging molecular and cellular neuroscience with ... [https://www.nature.com/articles/s12276-025-01491-4]
- 14. Split-TurboID enables contact-dependent proximity ... [https://pmc.ncbi.nlm.nih.gov/articles/PMC7275672/]
- 15. New Method Tracks How Psychedelics Affect Neurons in ... [https://www.ucdavis.edu/news/new-method-tracks-how-psychedelics-affect-neurons-minutes]
- 16. Fundamentals of Cellular Calcium Signaling: A Primer - PMC [https://pmc.ncbi.nlm.nih.gov/articles/PMC6942118/]
- 17. Calcium signaling [https://en.wikipedia.org/wiki/Calcium_signaling]
- 18. Visualizing the effects of psychedelics in the brain - Earth.com [https://www.earth.com/news/visualizing-the-effects-of-psychedelics-in-the-brain/]
- 19. Efficient quantitative comparisons of plasma proteomes ... [https://pmc.ncbi.nlm.nih.gov/articles/PMC5575765/]
- 20. IRES Or 2A In Polycistronic Expression Cassette? [https://en.vectorbuilder.com/resources/faq/ires-vs-2a.html]
- 21. Gene Co-Expression in Bicistronic Constructs [https://bitesizebio.com/24492/express-yourself-gene-co-expression-in-bicistronic-constructs/]
- 22. The development of proximity labeling technology and its ... [https://biosignaling.biomedcentral.com/articles/10.1186/s12964-023-01310-1]
- 23. Split-YFP-coupled interaction–dependent TurboID identifies ... [https://pmc.ncbi.nlm.nih.gov/articles/PMC12358837/]
- 24. UC Davis Develops Tool to Track Psychedelic Effects on Neurons in... [https://lettersandsciencemag.ucdavis.edu/science-technology/uc-davis-develops-tool-track-psychedelic-effects-neurons-minutes]
- 25. New method tracks how psychedelics affect neurons in... | ScienceDaily [https://www.sciencedaily.com/releases/2024/08/240805164427.htm]
- 26. Optical Sensors and Actuators for Probing Proximity ... [https://pmc.ncbi.nlm.nih.gov/articles/PMC8890125/]
- 27. Rapid, noninvasive tool tracks neurons and biomolecules activated in... [https://www.news-medical.net/news/20240805/Rapid-noninvasive-tool-tracks-neurons-and-biomolecules-activated-in-the-brain-by-psychedelic-drugs.aspx]
- 28. Rapid, biochemical tagging of cellular activity history in vivo [https://pmc.ncbi.nlm.nih.gov/articles/PMC11118534/]
- 29. In vivo proteomic mapping through GFP-directed proximity ... [https://elifesciences.org/articles/64631]
- 30. Protocol for cell surface biotinylation of magnetic labeled ... [https://pmc.ncbi.nlm.nih.gov/articles/PMC9692030/]
- 31. Imaging proteins in live mammalian cells with biotin ligase ... [https://pmc.ncbi.nlm.nih.gov/articles/PMC2671200/]
- 32. Cellular Proteomic Profiling Using Proximity Labeling by ... [https://www.sciencedirect.com/science/article/pii/S1535947623000567]
- 33. Interactome analysis of Caenorhabditis elegans synapses ... [https://www.sciencedirect.com/science/article/pii/S0021925821008978]
- 34. An engineered redox‐switchable streptavidin mutein ... [https://pmc.ncbi.nlm.nih.gov/articles/PMC12267106/]
- 35. A brief guide to analyzing TurboID-based proximity ... [https://pmc.ncbi.nlm.nih.gov/articles/PMC12264614/]
- 36. Detection of TurboID fusion proteins by fluorescent ... [https://elifesciences.org/articles/95028]
- 37. TurboID-based proximity labeling reveals that UBR7 is a ... [https://www.nature.com/articles/s41467-019-11202-z]
- 38. Psychedelic compounds directly excite 5-HT 2A layer V ... [https://www.nature.com/articles/s41398-025-03611-0]
- 39. Psilocybin desynchronizes the human brain [https://www.nature.com/articles/s41586-024-07624-5]
- 40. Neurocognitive effects of psilocybin: A systematic and ... [https://www.sciencedirect.com/science/article/abs/pii/S0149763425002398]
- 41. Psilocybin decreases neural responsiveness and increases ... [https://pmc.ncbi.nlm.nih.gov/articles/PMC11383378/]
- 42. Psilocybin Prolongs the Neurovascular Coupling Response in ... [https://pmc.ncbi.nlm.nih.gov/articles/PMC12324220/]
- 43. A systematic comparison of in-house prepared transfection ... [https://pmc.ncbi.nlm.nih.gov/articles/PMC12603952/]
- 44. Science Cast [https://sciencecast.org/casts/4g91n8e30f5i]
- 45. Intracristal space proteome mapping using super ... [https://pmc.ncbi.nlm.nih.gov/articles/PMC12368266/]
- 46. Efficient proximity labeling in living cells and organisms ... [https://pmc.ncbi.nlm.nih.gov/articles/PMC6126969/]
- 47. Proximity labeling in mammalian cells with TurboID and ... [https://www.broadinstitute.org/publications/broad681206]
- 48. Cell type-specific biotin labeling in vivo resolves regional ... [https://www.nature.com/articles/s41467-022-30623-x]
- 49. Study Finds New Tagging Method Could Reveal ... [https://www.rttnews.com/3466700/study-finds-new-tagging-method-could-reveal-psychedelic-effects-on-neurons.aspx]
- 50. Bridging molecular and cellular neuroscience with proximity ... [https://pmc.ncbi.nlm.nih.gov/articles/PMC12322126/]
- 51. A comparison of fluorescent Ca2+ indicators for imaging local Ca2+... [https://pmc.ncbi.nlm.nih.gov/articles/PMC4658286/]
- 52. - Wikipedia GCaMP [https://en.wikipedia.org/wiki/GCaMP]
- 53. Far-red fluorescent genetically encoded calcium ion ... [https://www.nature.com/articles/s41467-025-58485-z]
- 54. Illuminating calcium and potassium dynamics with red ... [https://pmc.ncbi.nlm.nih.gov/articles/PMC12551949/]
- 55. Illuminating calcium and potassium dynamics with red fluorescent ... [https://journals.plos.org/plosbiology/article?id=10.1371/journal.pbio.3003460]
- 56. Design and mechanistic insight into ultrafast calcium for... indicators [https://www.nature.com/articles/srep38276?error=cookies_not_supported&code=8a5692cb-6770-447b-b7e4-dfa9db84d55c]
- 57. A molecular calcium integrator reveals a striatal cell-type ... [https://pmc.ncbi.nlm.nih.gov/articles/PMC9839359/]
- 58. Stanford researchers develop new tool for watching and ... [https://neuroscience.stanford.edu/news/stanford-researchers-develop-new-tool-watching-and-controlling-neural-activity]
- 59. Permanent Genetic Access to Transiently Active Neurons via ... [https://pmc.ncbi.nlm.nih.gov/articles/PMC3782391/]
- 60. Decade of TRAP progress: Insights and future prospects for ... [https://www.sciencedirect.com/science/article/abs/pii/S0301008224001436]
- 61. Cellular Proteomic Profiling Using Proximity Labeling by ... [https://pmc.ncbi.nlm.nih.gov/articles/PMC10205547/]
- 62. Examining memory linking and generalization using ... [https://www.sciencedirect.com/science/article/pii/S2211124723016042]
- 63. Science Cast [https://sciencecast.org/casts/83rjs0gi2qw5]
- 64. Tissue clearing applications in memory engram research - PMC [https://pmc.ncbi.nlm.nih.gov/articles/PMC10493294/]